
A note on lower timeframe confirming price action…
Waiting for lower timeframe confirmation is our main tool to confirm strength within higher timeframe zones, and has really been the key to our trading success. It takes a little time to understand the subtle nuances, however, as each trade is never the same, but once you master the rhythm so to speak, you will be saved from countless unnecessary losing trades. The following is a list of what we look for:
- A break/retest of supply or demand dependent on which way you’re trading.
- A trendline break/retest.
- Buying/selling tails … essentially we look for a cluster of very obvious spikes off of lower timeframe support and resistance levels within the higher timeframe zone.
- Candlestick patterns. We tend to only stick with pin bars and engulfing bars as these have proven to be the most effective.
EUR/USD
Following the FOMC’s decision to raise interest rates by 25bps, the US dollar plummeted lower and the EUR aggressively advanced. While this is not the ‘expected’ reaction to such an outcome, we believe the market wanted somewhat more of a hawkish response from the Fed Chair, which did not transpire. Furthermore, we feel the dollar was further weakened by the ‘dot plot’ scenario that has showed little change since December.
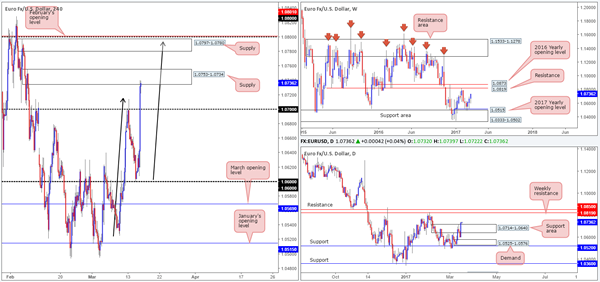
Thanks largely to yesterday’s rally, weekly bulls look to be on course to connect with the weekly resistance at 1.0819, followed closely by the 2016 yearly opening level at 1.0873. Looking down to the daily candles, price ran through the top edge of daily supply at 1.0714-1.0640 (now acting support area) yesterday, and now looks free to challenge the above noted weekly resistance and nearby daily resistance at 1.0850.
While the higher timeframes suggest further buying may be on the cards, H4 action is currently seen teasing the underside of a H4 supply zone coming in at 1.0753-1.0734. A break above this hurdle could lead to a continuation move north up to the H4 supply at 1.0797-1.0780, which happens to be shadowed closely by Feb’s opening level at 1.0801 and the 1.08 handle.
Our suggestions: Despite higher-timeframe direction pointing to a move north, we are not going to be buying into a H4 supply zone! A break above this area, however, would likely call for a move north up to the next H4 supply at 1.0797-1.0780. A short from here is a little more appealing given that it fuses closely with Feb’s opening level at 1.0801, the 1.08 handle and a possible H4 AB=CD (black arrows) bearish formation taken from the low 1.0525. However, there’s still a good chance that this H4 supply zone area will be faked considering that the weekly resistance is sited just above at 1.0819. Therefore, we would need to see the fakeout before looking to short here as this could prove to be a monster trade!
Data points to consider: US housing data, Philly Fed manufacturing index report as well as the US jobless claims figure are all scheduled for release at 12.30pm GMT.
Levels to watch/live orders:
- Buys: Flat (stop loss: N/A).
- Sells: 1.0797-1.0780 ([wait for price to fake above this area to 1.0819 before considering shorts] stop loss: ideally beyond the fakeout candle).
GBP/USD
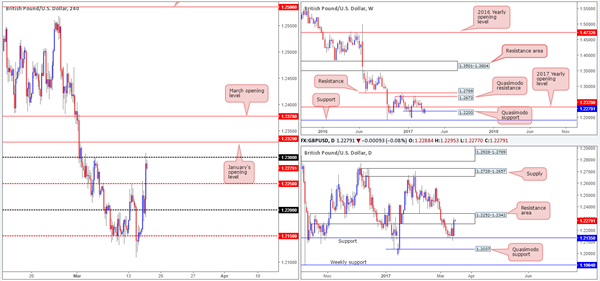
Across the board we saw the US dollar fall sharply yesterday following the FOMC’s decision to raise interest rates by 25bps. This, as you can see, boosted the GBP’s appeal. The pair ran through offers at 1.2250 and tested the 1.23 handle going into the closing bell. However, we believe that this rally will likely generate little follow-through today. This notion is supported by the following factors:
- Just beyond 1.23 is the 2017 yearly opening level at 1.2329.
- Encasing this yearly level is a daily resistance area pegged at 1.2252-1.2342.
- H4 trendline resistance taken from the low 1.2214.
- Overall, this market is entrenched within a clear downtrend at present.
Despite the above points, we would really like to see the H4 candles interact with the 2017 yearly opening base line before we look to consider selling this market.
Our suggestions: Keep an eye out for price to challenge 1.2329. Should this come to fruition, our desk would think about selling from here on the condition that a lower-timeframe sell signal forms (see the top of this report). Ideally, we would look for price to close below 1.23 as this would be enough to justify reducing risk to breakeven.
Data points to consider: Bank of England monetary policy announcements at 12pm. US housing data, Philly Fed manufacturing index report as well as the US jobless claims figure are all scheduled for release at 12.30pm GMT.
Levels to watch/live orders:
- Buys: Flat (stop loss: N/A).
- Sells: 1.2329 region ([waiting for a lower-timeframe confirming signal to form is advised] stop loss: dependent on where one confirms this level).
AUD/USD
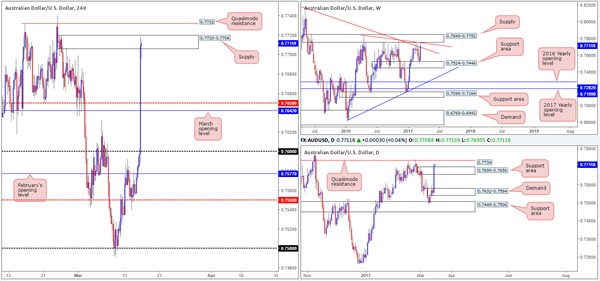
The commodity currency gravitated north against its US counterpart yesterday after the FOMC decided to raise interest rates by 25bps. From the weekly scale we can see that price is currently back shaking hands with the weekly trendline resistance stretched from the high 0.8163. In the event that the bulls continue to press forward here, the next upside objective can be seen at 0.7849-0.7752: a weekly supply that merges nicely with another weekly trendline resistance taken from the high 0.7835. Down on the daily chart, yesterday’s candle smashed its way through the daily supply at 0.7699-0.7656, and is now seen retesting the top edge of this area as support. Assuming that the bulls remain in the driving seat here, our expectation is for price to connect with the nearby daily Quasimodo resistance at 0.7734.
Jumping across to the H4 candles, the pair is seen trading within the walls of a H4 supply at 0.7720-0.7706. Although the bears have made an attempt to push things lower from here, we feel this base is on the verge of giving way which could see the candles approach the H4 Quasimodo resistance at 0.7732.
Our suggestions: Quite simply, we are looking to short from the current H4 Quasimodo resistance level today. Not only does this base converge closely with the daily Quasimodo resistance line at 0.7734, it’s also positioned around the weekly structures mentioned above. We would, dependent on the time of day, likely look to go in aggressive at 0.7732 and place stops above the apex high at 0.7740. However, do be aware that we have Australian employment figures due soon!
Data points to consider: Aussie employment figures at 12.30am. US housing data, Philly Fed manufacturing index report as well as the US jobless claims figure are all scheduled for release at 12.30pm GMT.
Levels to watch/live orders:
- Buys: Flat (stop loss: N/A).
- Sells: 0.7732 (Stop loss: 0.7742).
USD/JPY
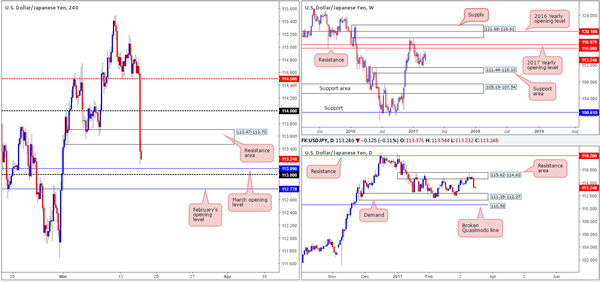
Yesterday’s FOMC decision to hike rates by 25bps sent the US dollar screaming lower. The H4 mid-way support at 114.50, the 114 handle and the H4 demand base at 113.47-113.70 (now acting resistance) were collectively taken out during the bearish assault! With March’s opening level at 113.09, followed closely by the 113 handle and February’s opening level at 112.70 (112.70/113.09) now in view, where do we go from here?
Both the weekly and daily charts indicate room to extended lower this week, with the closest support structure not seen in view until 111.35-112.37: a daily demand zone which sits around the top edge of a weekly support area drawn from 111.44-110.10. As such, there is a possibility that the H4 112.70/113.09 zone may suffer a breach as price may want to tag the top edge of the current daily demand at 112.37. Does this mean we should ignore 112.70/113.09 altogether? Certainly not!
Our suggestions: Wait for price to cross paths with 112.70/113.09 and only look to go long only if a reasonably sized H4 bullish rotation candle presents itself from within the zone. This, of course, will by no means guarantee that price will advance, but what it will do is show buyer intent within a high-probability buy zone.
Data points to consider: US housing data, Philly Fed manufacturing index report as well as the US jobless claims figure are all scheduled for release at 12.30pm. Bank of Japan monetary policy announcements (tentative) GMT.
Levels to watch/live orders:
- Buys: 112.70/113.09 ([waiting for a reasonably sized H4 bull candle to form is advised before pulling the trigger] stop loss: ideally beyond the trigger candle).
- Sells: Flat (stop loss: N/A).
USD/CAD
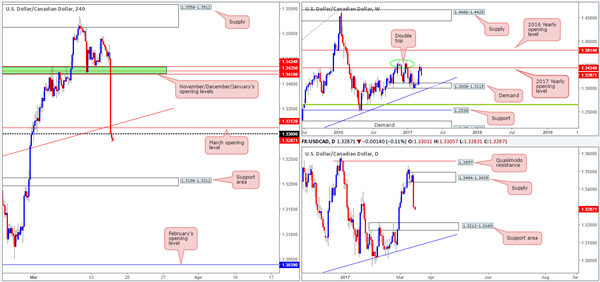
Recent events show that the FOMC’s decision to hike rates by 25bps sent the US dollar aggressively lower against the Canadian dollar. As can be seen from the H4 chart, the pair concluded trade by closing beyond March’s opening base line at 1.3312, the round number 1.33 and a H4 trendline support taken from the high 1.3171. To our way of seeing things, as long as the bears defend the recently broken H4 levels as resistance, there is little structure seen in this market until we reach the H4 support area coming in at 1.3196-1.3212 (fixed within a daily support area at 1.3212-1.3169).
Our suggestions: Based on the above points, our prime focus today will be on looking for shorting opportunities on any retest seen between 1.3312/1.33. Should the retest occur and a reasonably sized H4 bearish candle presents itself, we will be all over this, targeting the aforementioned H4 support area.
Data points to consider: US housing data, Philly Fed manufacturing index report as well as the US jobless claims figure are all scheduled for release at 12.30pm GMT.
Levels to watch/live orders:
- Buys: Flat (stop loss: N/A).
- Sells: 1.3312/1.33 ([waiting for a reasonably sized H4 bear candle to form is advised before pulling the trigger] stop loss: ideally beyond the trigger candle).
USD/CHF
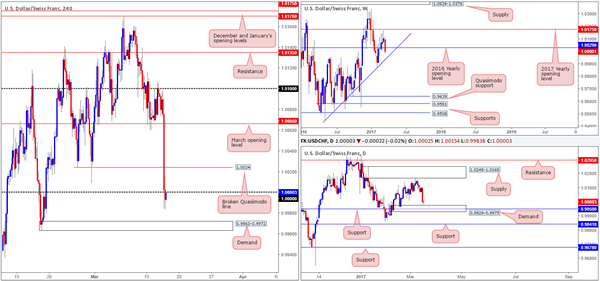
With the US dollar taking a hit yesterday on the back of FOMC actions, the H4 candles are now seen trading a tad beyond parity (1.0000) as we write. The next downside hurdle on this scale comes in around the H4 demand area drawn from 0.9963-0.9972. Also noteworthy is the daily chart. Price is currently hovering just ahead of a daily demand barrier chalked in at 0.9929-0.9975, which happens to intersect with not only a daily support level seen at 0.9950, but also a weekly trendline support etched from the low 0.9443.
Our suggestions: Owing to the confluence seen within the above noted daily demand area; we have a keen interest in the aforementioned H4 demand area today given that it’s located within the walls of the said daily demand. However, seeing as how there’s a fairly good chance that price could fake beyond this H4 zone into the depths of the daily demand, we would strongly recommend waiting for a reasonably sized H4 bullish candle to take shape before executing a trade.
Data points to consider: US housing data, Philly Fed manufacturing index report as well as the US jobless claims figure are all scheduled for release at 12.30pm.Swiss National Bank monetary policy announcements at 8.30am GMT.
Levels to watch/live orders:
- Buys: 0.9963-0.9972 ([waiting for a reasonably sized H4 bull candle to form is advised before pulling the trigger] stop loss: ideally beyond the trigger candle).
- Sells: Flat (stop loss: N/A).
DOW 30
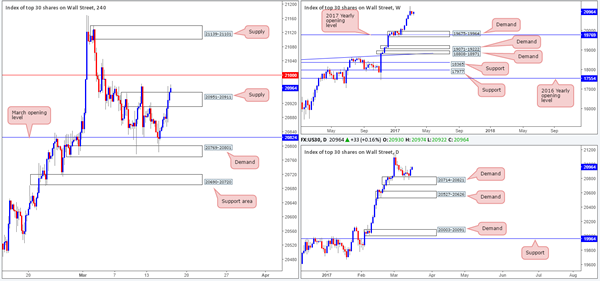
After the Fed raised its benchmark interest rate 25bps yesterday we saw the US equity market extend Tuesday’s bounce from the H4 demand area at 20769-20801, and eventually spike above H4 supply coming in at 20951-20911. Although both the weekly and daily charts show little resistance on the horizon, we cannot afford to buy this market just yet. Once, or indeed if, the 21000 H4 resistance is conquered, we will then have a relatively free run up until the H4 supply zone picked at 21139-21101.
Our suggestions: Quite simply, watch for a H4 close to print beyond the 21000 mark today. In the event that this comes into view, and price retests 21000 as support and prints a reasonably sized H4 bull candle, we would consider entering long from here, targeting the aforementioned H4 supply and possibly beyond.
Data points to consider: US housing data, Philly Fed manufacturing index report as well as the US jobless claims figure are all scheduled for release at 12.30pm GMT.
Levels to watch/live orders:
- Buys: Watch for price to engulf 21000 and then look to trade any retest seen thereafter ([waiting for a reasonably sized H4 bull candle to form following the retest is advised before pulling the trigger] stop loss: ideally beyond the trigger candle).
- Sells: Flat (stop loss: N/A).
GOLD
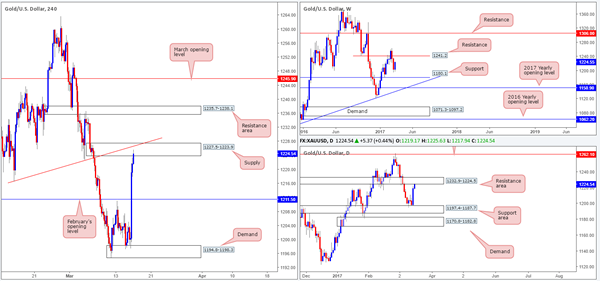
Shortly after the FOMC announced its decision to raise interest rates by 25bps, the dollar fell and by extension dragged the price of gold higher. This, as you can see, has brought the yellow metal up to within the jaws of a rather interesting H4 supply zone penciled in at 1227.5-1223.9. Not only is there a converging H4 trendline resistance etched from the low 1216.5, there’s also a daily resistance area bolstering this base at 1232.9-1224.5. Despite weekly action not showing any resistance until we reach the 1241.2 neighborhood, there’s a relatively sound chance that price will decline in value from the current H4 supply area sometime today.
Our suggestions: While there is a possibility that the H4 candles may ignore this H4 zone today and head for the above noted weekly resistance barrier, we feel a sell trade from the said H4 supply can still be considered valid if a reasonably sized H4 bearish candle forms.
Levels to watch/live orders:
- Buys: Flat (stop loss: N/A).
- Sells: 1227.5-1223.9 ([waiting for a reasonably sized H4 bear candle to form is advised before pulling the trigger] stop loss: ideally beyond the trigger candle).


