
DXY:
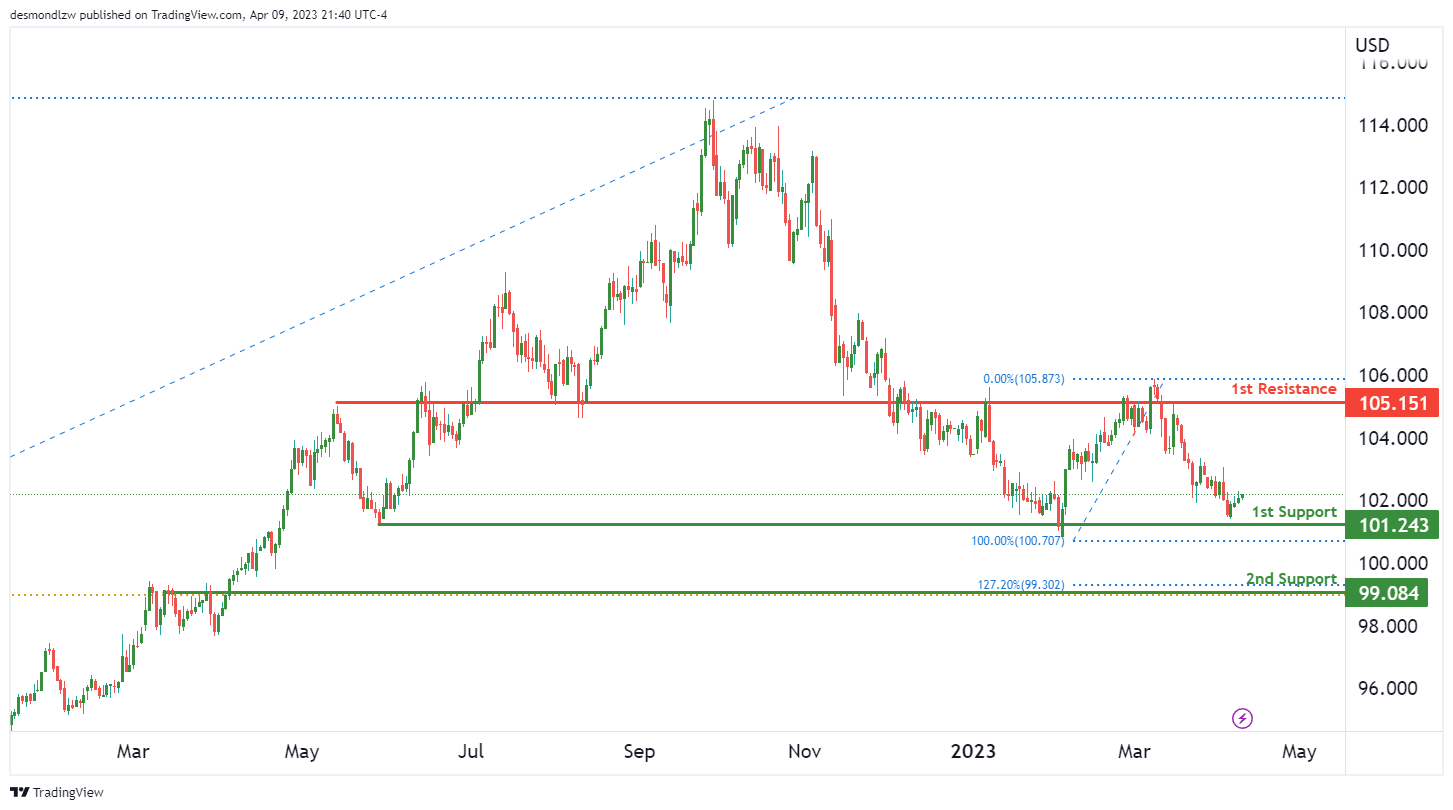
Looking at the DXY chart, the overall momentum of the chart is bullish, indicating a potential for prices to rise in the near future. The first potential scenario for price is a bullish continuation towards the first resistance at 105.15, which is a strong overlap resistance level.
On the support side, the first support level to watch is at 101.24, which is a multi-swing low support level. This level has been tested multiple times in the past and has held strong as a level of support. If price were to drop below the first support, the next support level to watch is at 99.08, which is an overlap support level. This level has also held as a level of support in the past.
On the resistance side, the first resistance level to watch is at 105.15, which is a strong overlap resistance level. This level has been tested multiple times in the past and has held as a level of resistance. If price were to break above the first resistance, the next level to watch is the second resistance level at 107.50, which is a swing high resistance level.
EUR/USD:
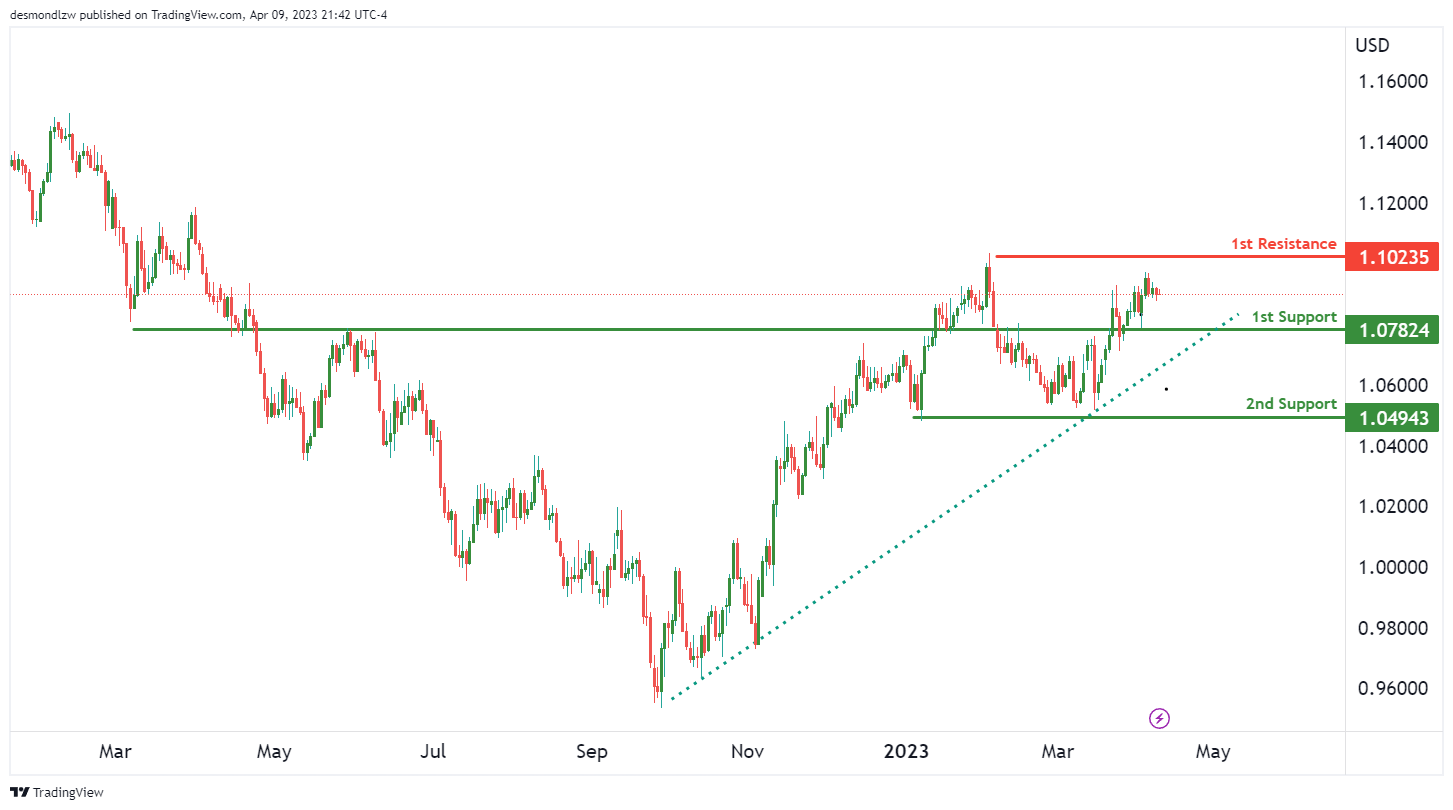
Looking at the EUR/USD chart, the overall momentum is currently neutral. However, it’s worth noting that the price is above a major ascending trend line, which suggests that there may be further bullish momentum on the cards.
In terms of potential price movements, price could fluctuate between the 1st resistance and 1st support levels.
The 1st support level is at 1.0782 and is an overlap support level. This level has been tested multiple times in the past, making it a strong support level.
The 2nd support level is at 1.0494 and is a multi-swing low support level. This level has also been tested multiple times in the past, making it another strong support level to watch out for.
On the resistance side, the 1st resistance level is at 1.1024 and is an overlap resistance level. This level has also been tested multiple times in the past, making it a strong resistance level.
GBP/USD:
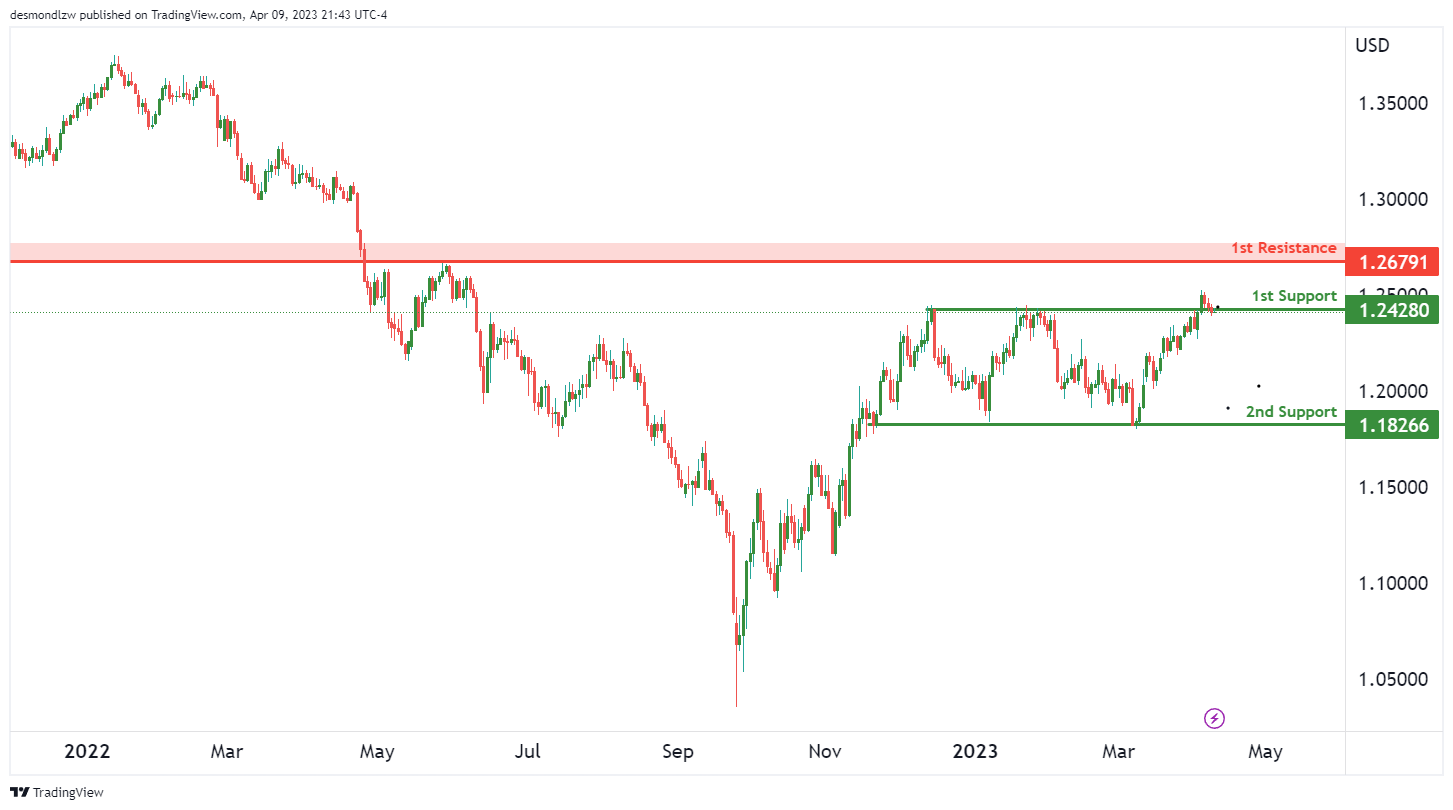
Looking at the chart for GBP/USD, the overall momentum is bullish. Price has the potential to continue its bullish momentum towards the first resistance level of 1.2679.
The first support level to watch is at 1.2428, which is a pullback support level. This level provides a good buying opportunity as price could potentially bounce off from this level and continue its bullish trend. The second support level to watch is at 1.1826, which is a multi-swing low support level. This level is also important as price has previously bounced off from this level, indicating its significance.
On the resistance side, the first level to watch is at 1.2679, which is an overlap resistance level. This level is significant as a break above it could potentially signal a continuation of the bullish momentum
USD/CHF:
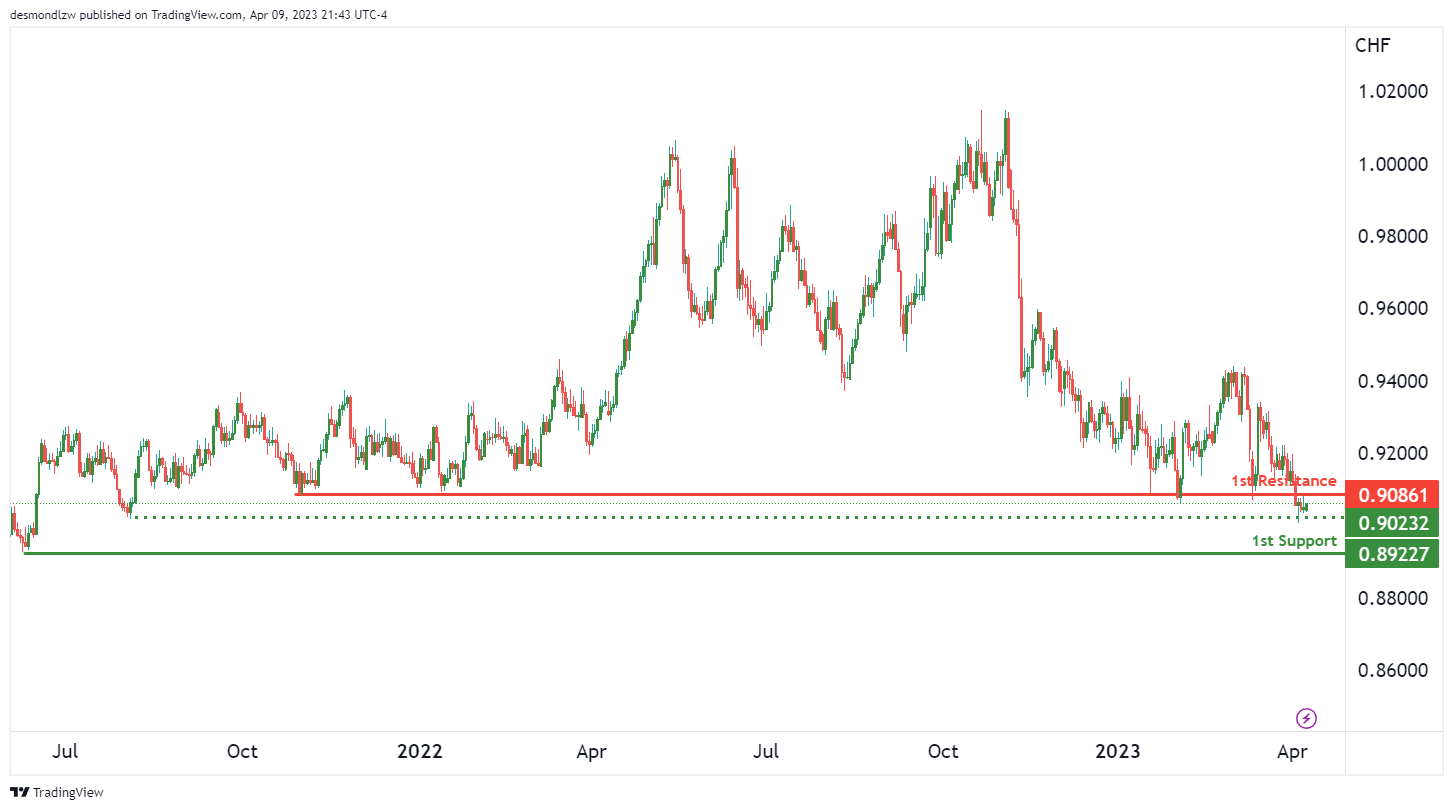
Looking at the USD/CHF chart, the overall momentum is bearish, with price potentially continuing its bearish movement towards the first support level. Price is currently below an ascending trendline, which could contribute to the bearish momentum.
The first support level to watch is at 0.8922, which is a swing low support level. If price breaks below this level, it could potentially signal a continuation of the bearish momentum. There is also an intermediate support level at 0.9023, which is a multi-swing low support level.
On the resistance side, the first level to watch is at 0.9086, which is a pullback resistance level. If price manages to break above this level, it could potentially signal a reversal of the bearish momentum.
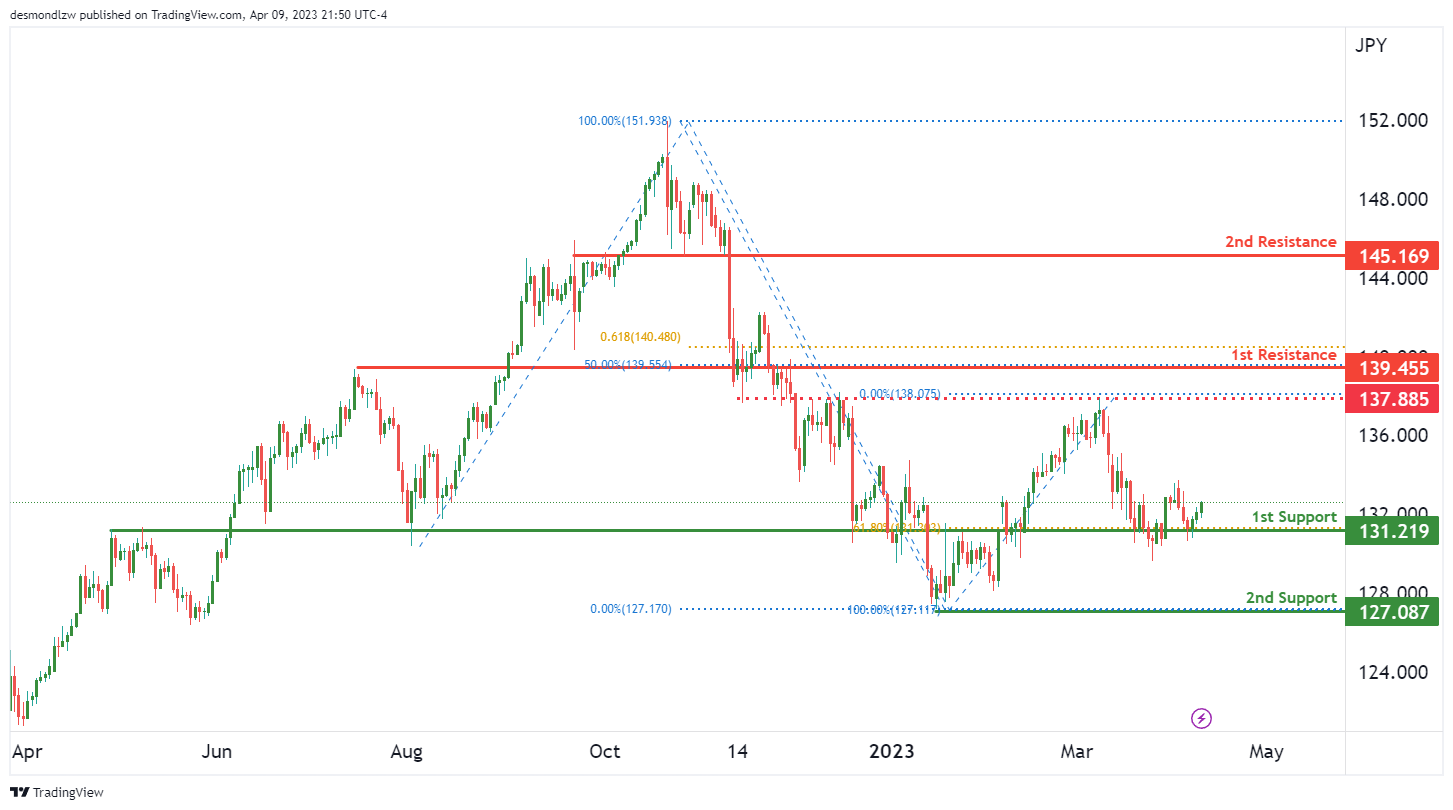
USD/JPY:
Looking at the USD/JPY chart, the overall momentum is bullish. This suggests that price could potentially continue to rise towards the 1st resistance level.
The 1st support level is at 131.2100, which is a strong overlap support level and also coincides with the 61.80% Fibonacci retracement. This makes it a good level for buyers to potentially enter the market.
If price were to drop below the 1st support level, it could potentially find support at the 2nd support level at 127.0800, which is a swing low support level.
On the other hand, if price were to continue to rise, it could potentially reach the 1st resistance level at 139.4500, which is a pullback resistance level and coincides with the 50% Fibonacci retracement.
If price were to break the 1st resistance level, it could potentially rise towards the 2nd resistance level at 145.1600, which is also a pullback resistance level.
There is also an intermediate resistance level at 137.8800, which is an overlap resistance level and could potentially act as a barrier for price before reaching the 1st resistance level.
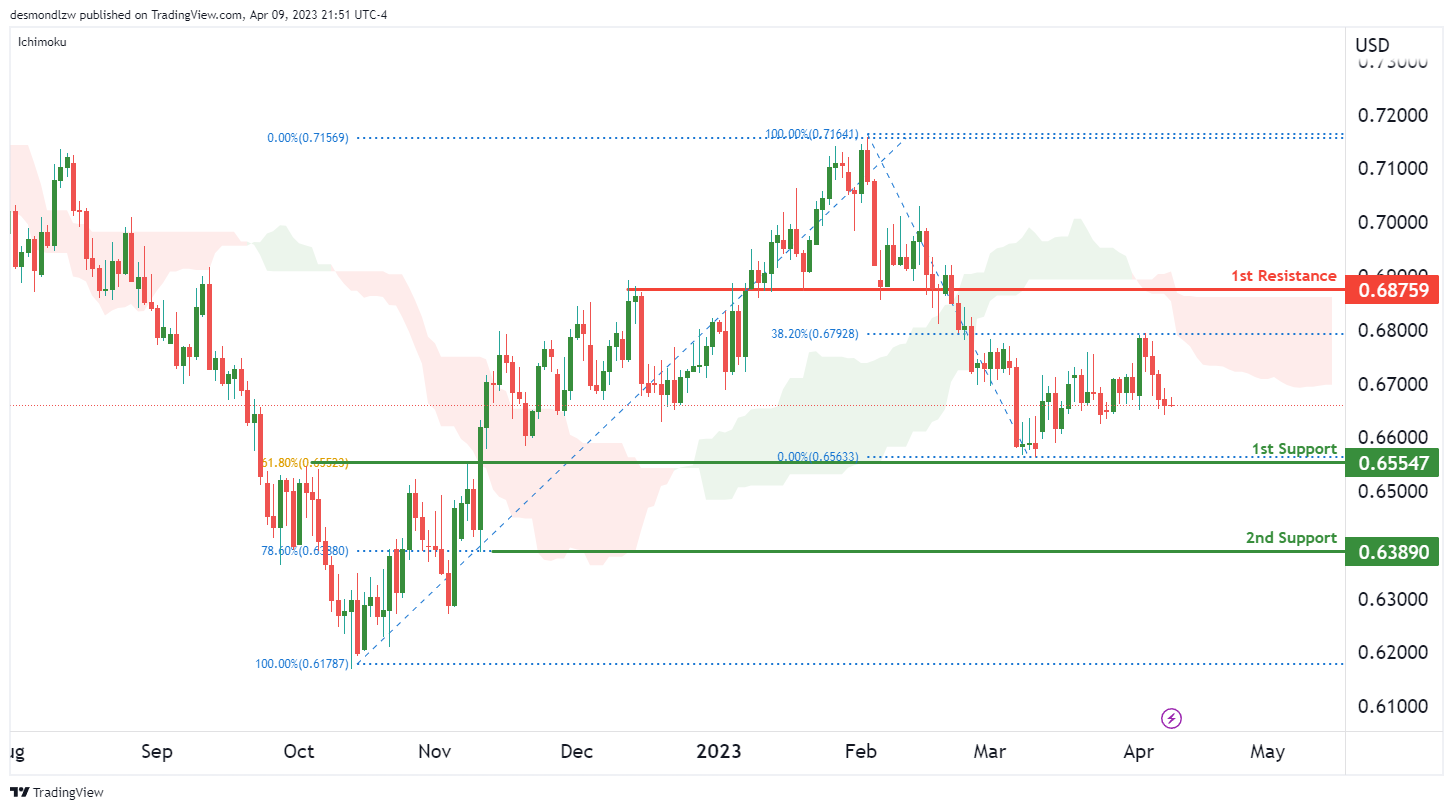
AUD/USD:
The AUD/USD chart is currently showing a bearish momentum, with prices trading below the bearish Ichimoku cloud. This suggests that there might be further downside potential for the currency pair.
Looking at the potential price movements, a bearish continuation towards the first support level at 0.6554 is likely. This level is a strong overlap support and has a 61.80% Fibonacci retracement lining up with it, making it a key level to watch.
If prices break below this level, the next support level it could drop to is the second support at 0.6389. This level is a pullback support and has a 78.60% Fibonacci retracement lining up with it, adding to its significance.
On the resistance side, the first resistance level at 0.6875 is a key level to watch. It’s a pullback resistance, but with no Fibonacci retracements lining up with it, it’s not as significant as the support levels.
Overall, with the bearish momentum and the current positioning below the Ichimoku cloud, it’s likely that the AUD/USD currency pair will continue to see downside pressure.
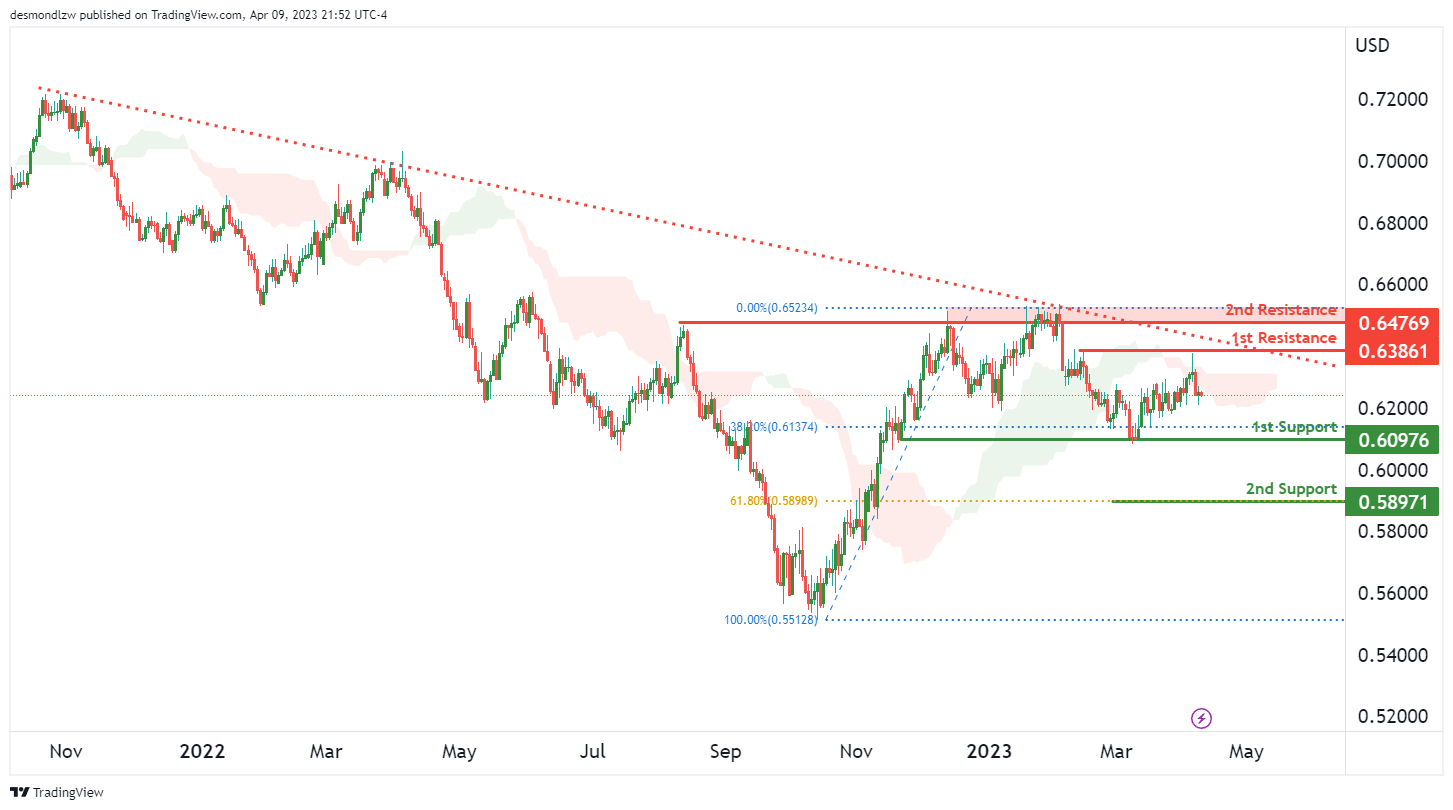
NZD/USD:
The NZD/USD chart currently shows strong bearish momentum, with price trading below the bearish Ichimoku cloud and a major descending trend line. This suggests that the path of least resistance is to the downside, and that we may see further bearish movement in the near future.
Looking at the support and resistance levels, the 1st support is located at 0.6097, which is a pullback support and also lines up with the 38.20% Fibonacci retracement. If price were to break below this level, it could potentially drop towards the 2nd support at 0.5897, which is a swing low support and coincides with the 61.80% Fibonacci retracement.
On the other hand, the 1st resistance is at 0.6386, which is a multi-swing high resistance level. If price were to break above this level, it could potentially rise towards the 2nd resistance at 0.6476, which is also a multi-swing high resistance level.
However, given the bearish momentum and the fact that price is currently below the Ichimoku cloud and the descending trend line, it is more likely that we may see a continuation of the bearish movement towards the 1st support level.
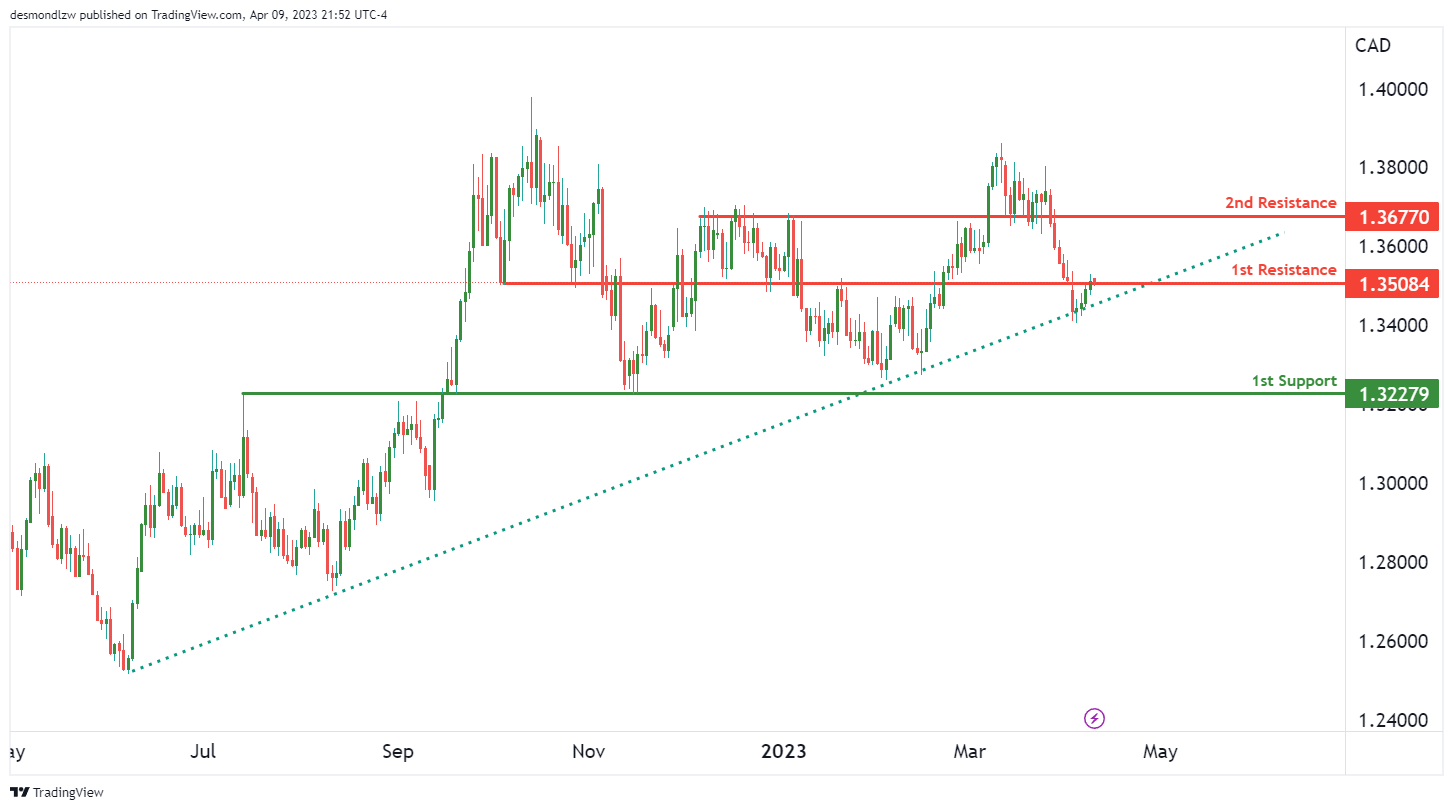
USD/CAD:
The USD/CAD chart is currently showing strong bullish momentum, with price trading above a major ascending trend line. This suggests that we might continue to see further bullish price action.
In terms of potential price movements, price could potentially make a bullish break through our 1st resistance at 1.3508, and rise towards our 2nd resistance at 1.3677.
On the other hand, if price were to fall below our current support level of 1.3227, it could potentially drop towards the next support level at 1.3000, which is a major overlap support.
It’s worth noting that the 1st resistance level at 1.3508 is also an overlap resistance, which makes it a strong level to watch. If price were to break above this resistance level, it could trigger a stronger bullish acceleration towards our 2nd resistance level.
Overall, the current bias of the USD/CAD chart is bullish, with potential for price to continue rising towards our resistance levels. However, a break below our support level could indicate a potential bearish shift in momentum.
DJ30:
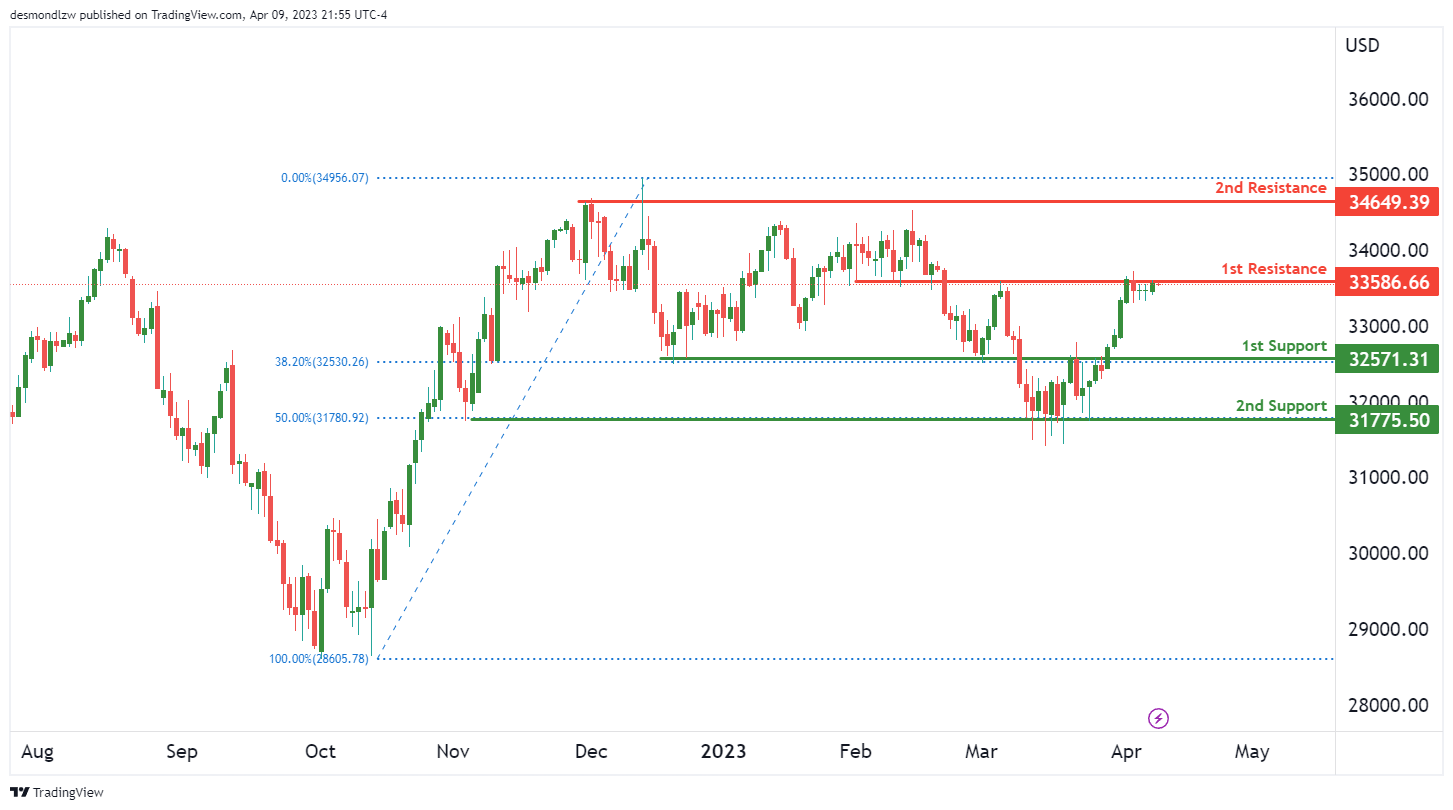
The Dow Jones Industrial Average (DJ30) has been exhibiting a bearish momentum on the chart lately. This is suggested by the fact that the price is currently below a major descending trend line.
Looking at potential price action, there is a possibility of bearish movement if the price reacts off the 1st resistance level and drops to the 1st support.
The 1st support level is located at 32571.31 and is a strong overlap support. It also coincides with the 38.20% Fibonacci retracement level, making it a good candidate for a potential bounce. In the event that the price breaks through this support level, the next support level it could potentially drop to is the 2nd support at 31775.50. This level is also a pullback support and is located at the 50% Fibonacci retracement level.
On the resistance side, the 1st resistance level at 35586.66 is a strong pullback resistance level. If the price were to reach this level, it could trigger a bearish reaction, pushing prices back down towards the support levels. The 2nd resistance level at 34649.39 is also an important multi-swing high resistance level that could potentially provide further resistance for prices.
GER30:
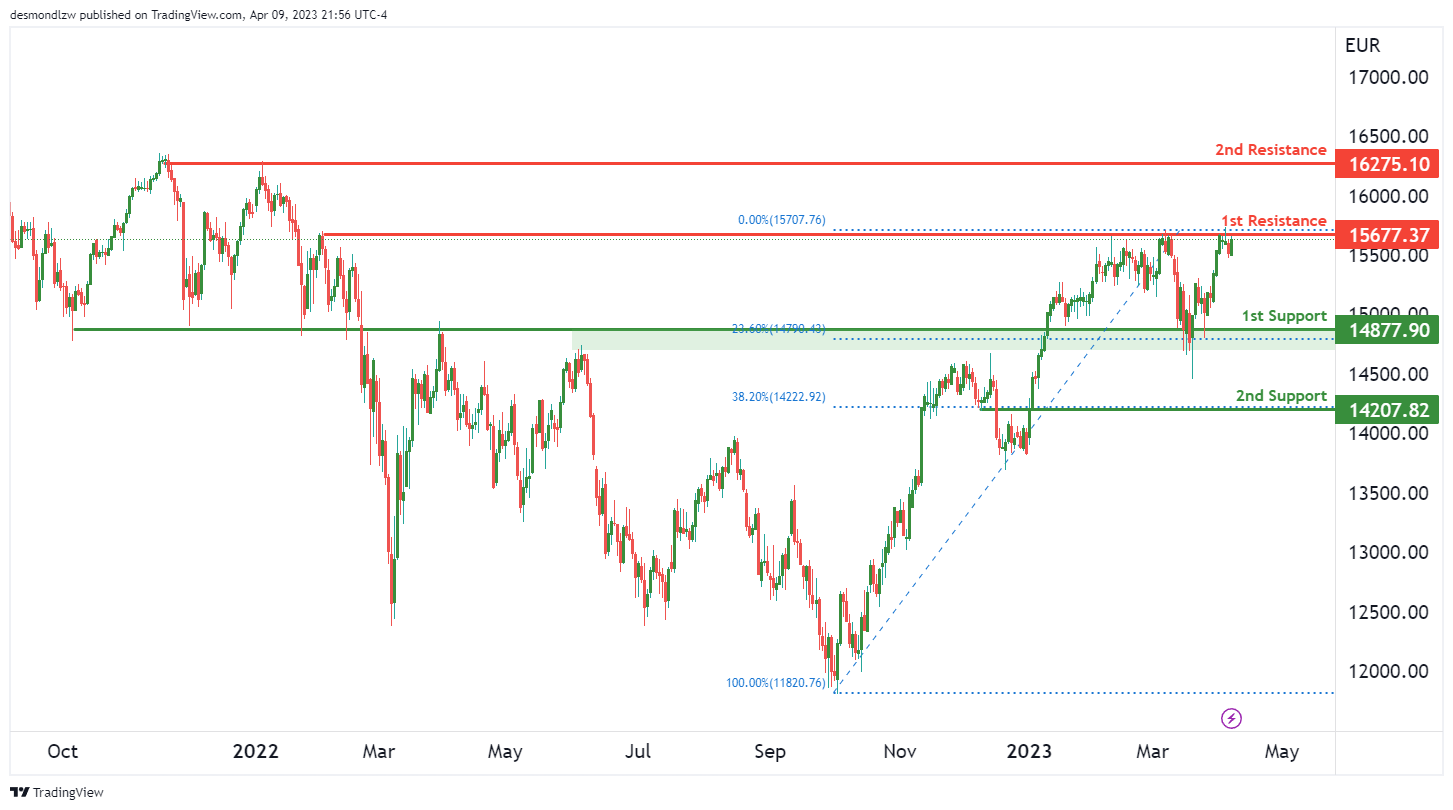
The GER30 chart appears to have a bearish momentum. The 1st resistance level is at 15677.37 and if price were to react bearishly off this level, it could potentially drop towards the 1st support at 14877.90.
The 1st support level at 14877.90 is a strong overlap support with a 23.60% Fibonacci retracement lining up with it, making it a good potential area for price to bounce back up. The 2nd support level at 14207.82 is also a pullback support with a 38.20% Fibonacci retracement lining up with it, adding to its potential strength.
On the other hand, the 1st resistance level at 15677.37 is a pullback resistance that could trigger a bearish reaction in price. If price were to break through this resistance level, it could potentially rise towards the 2nd resistance at 16277.37, which is a multi-swing high resistance level and could pose a significant obstacle to further bullish movement.
BTC/USD:
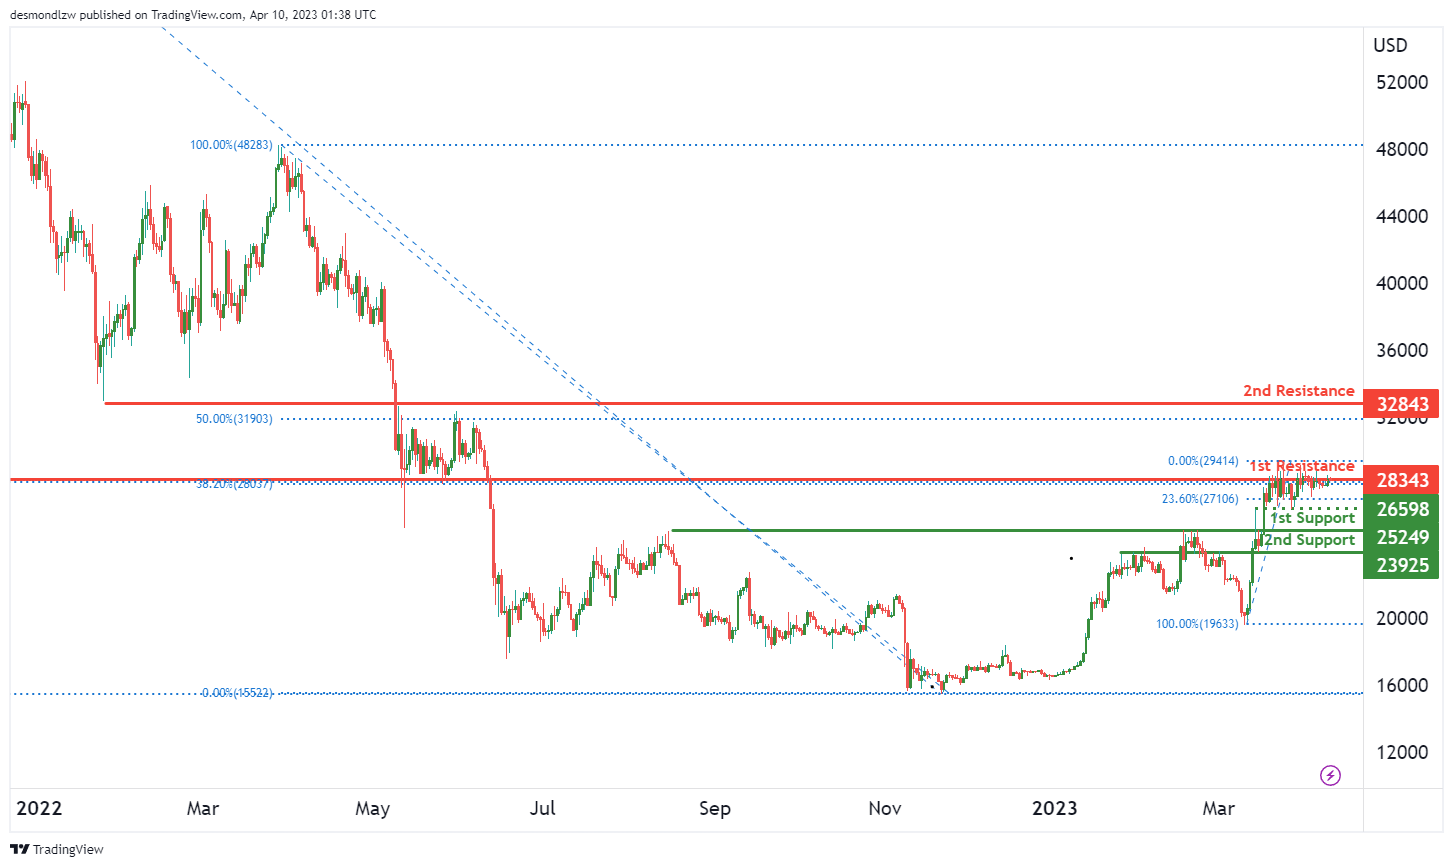
The cryptocurrency market has been experiencing bearish momentum lately, and Bitcoin is no exception. The overall momentum of the BTC/USD chart is currently bearish, indicating that prices are likely to continue to fall in the near term.
According to the chart, the price of Bitcoin could potentially face resistance at the 1st resistance level of 28343. This level is an overlap resistance, which indicates that it has been an important level in the past. If the price of Bitcoin fails to break through this level, we could see a bearish reaction and the price might drop towards the 1st support level of 25249. This level is a pullback support and could potentially act as a strong support for the price of Bitcoin.
If the price of Bitcoin breaks through the 1st resistance level, the next resistance level it could face is the 2nd resistance level of 32843, which is a pullback resistance. On the other hand, if the price of Bitcoin breaks below the 1st support level, the next support level it could drop to is the 2nd support level of 23925. This level is also a pullback support and could potentially act as a strong support for the price of Bitcoin.
It’s worth noting that there is also an intermediate support level at 26598, which is a swing low support and has a 23.60% Fibonacci retracement lining up with it. This level could potentially act as a support for the price of Bitcoin in case it drops towards the 1st support level.
US500
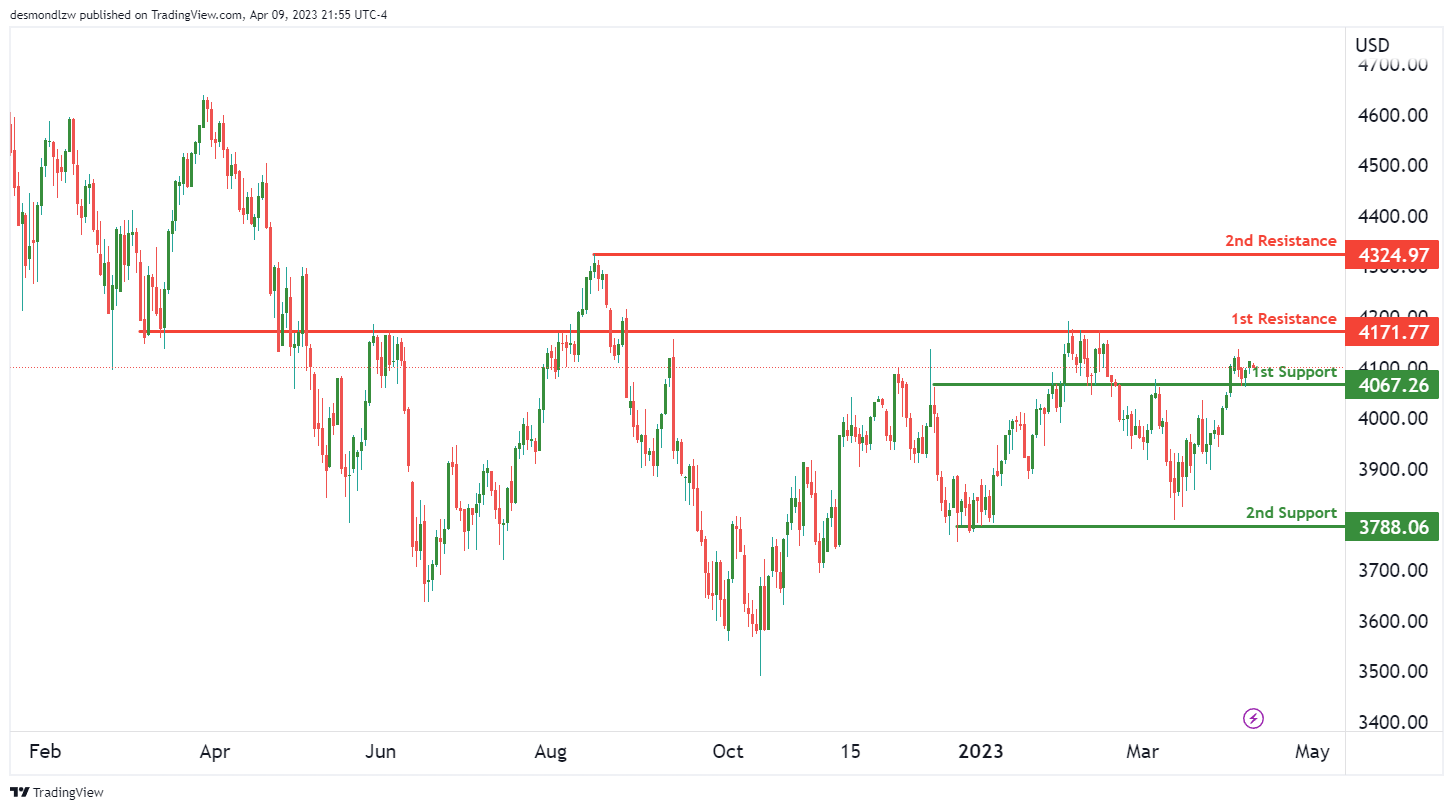
US500 Momentum Bullish, Potential for Continuation to 1st Resistance
The overall momentum of the US500 chart is bullish, suggesting a potential for price to rise further. The current price is above a major ascending trend line, supporting the continuation of the bullish momentum.
Price could potentially make a bullish continuation towards the 1st resistance at 4171.77. Before reaching the 1st resistance, price has to break through the 2nd support at 3788.06, which is a multi-swing low support. If price bounces from the 2nd support, it could rise to the 1st resistance at 4171.77.
The 1st support at 4067.26 is a strong overlap support, which could provide additional support to the bullish momentum. If price were to break the 1st support, it could drop to the 2nd support at 3788.06.
The 2nd resistance at 4324.97 is a swing high resistance that could potentially act as a barrier for price to rise further. However, if price were to break the 1st resistance, it could potentially rise towards the 2nd resistance.
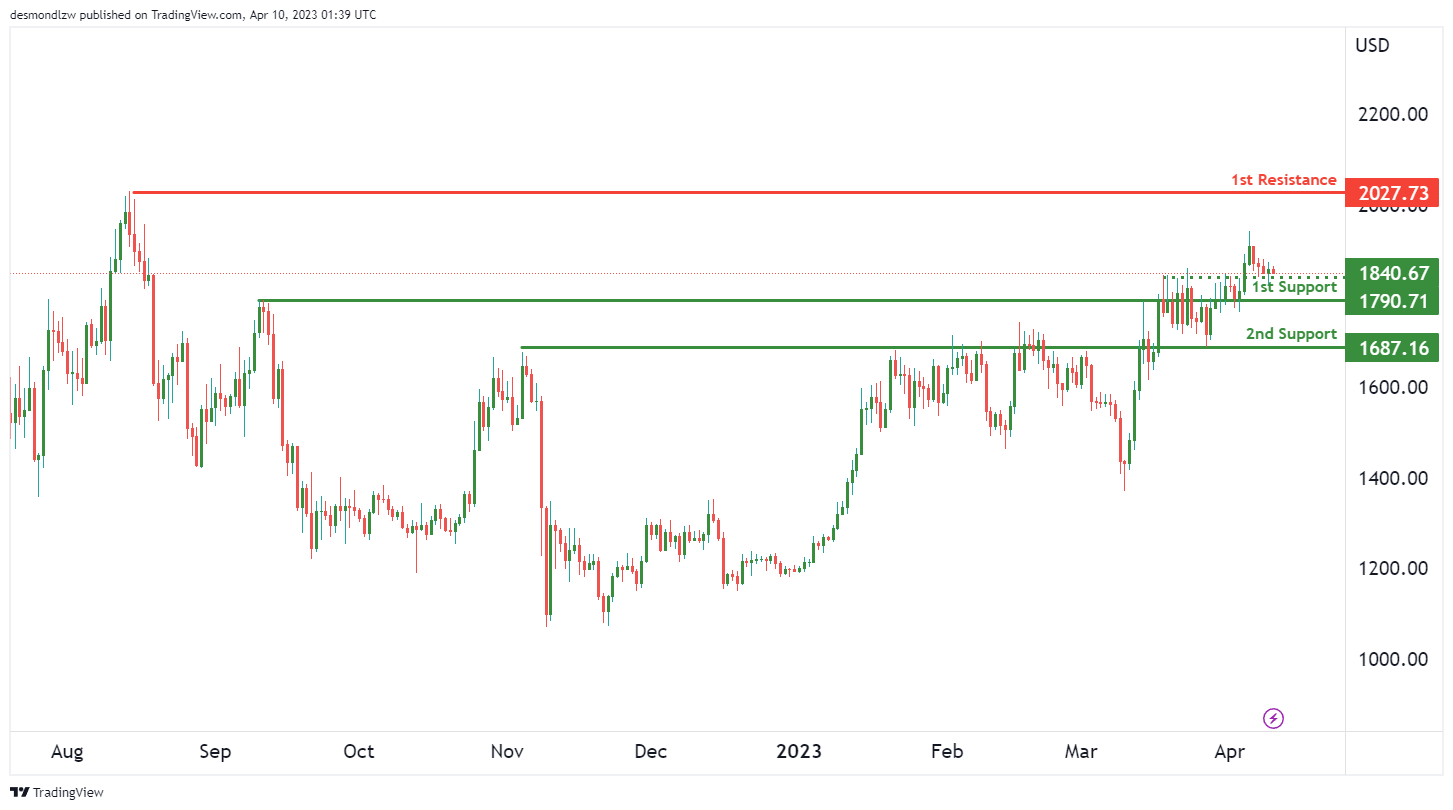
ETH/USD:
ETH/USD continues to see bearish momentum on the chart, as price remains below key resistance levels. A potential bearish continuation towards the 1st support level is expected.
The 1st support level is at 1790.71, and it’s a strong overlap support. In case of a bearish breakout, the 2nd support level at 1687.16 may come into play, as it is also an overlap support. These levels may provide some buying opportunities for traders looking for a reversal in the downtrend.
On the other hand, the 1st resistance level at 2027.73 is a multi-swing high resistance. In case of a bullish breakout, ETH/USD may rise towards this level. However, it’s worth noting that the current bearish momentum may make it difficult for price to break above this level. An intermediate support level at 1840.67 may offer a temporary respite, but traders should remain cautious as the bearish momentum continues.
Overall, the chart suggests a bearish bias for ETH/USD. As always, traders should use proper risk management strategies and closely monitor price movements to identify potential opportunities for profit.
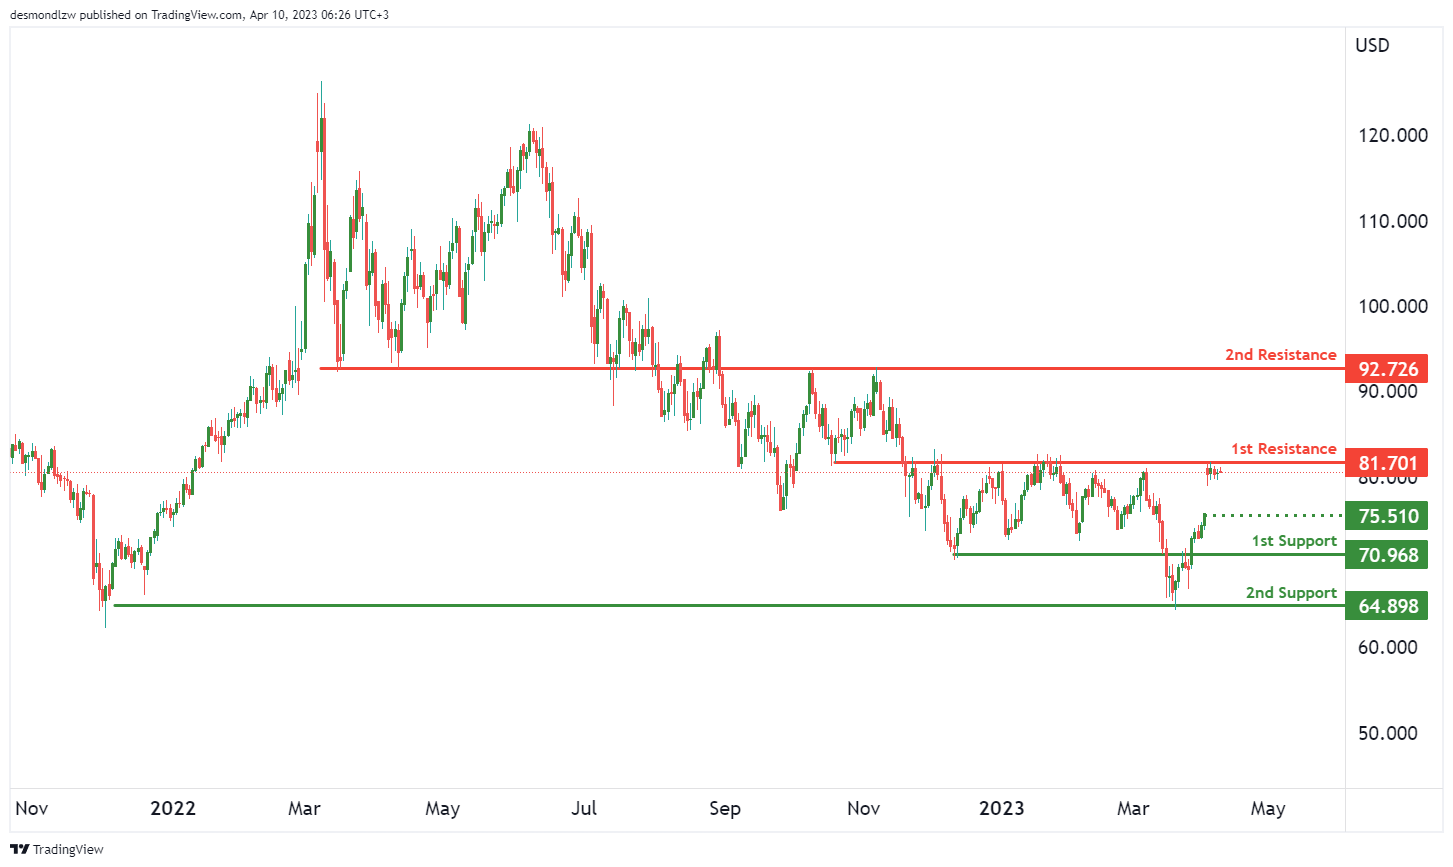
WTI/USD:
WTI Crude Oil Sees Bearish Momentum with Potential Drop to Support
WTI crude oil has been seeing bearish momentum on the chart with the potential for a continuation towards the 1st support level.
Currently trading below the Ichimoku cloud, the overall bias of the chart is bearish. Additionally, there is a long-term descending trend line suggesting that further bearish momentum may be on the cards.
Looking at the levels of support and resistance, the 1st support level is at 70.96, which is a strong overlap support level. If the price were to drop further, the 2nd support level is at 64.89, which is a multi-swing low support level.
On the other hand, the 1st resistance level is at 81.70, which is a pullback resistance level. If the price were to rise, the 2nd resistance level is at 92.72, which is another pullback resistance level.
In addition to these levels, there is an intermediate support level at 75.51, which is a swing low support level.
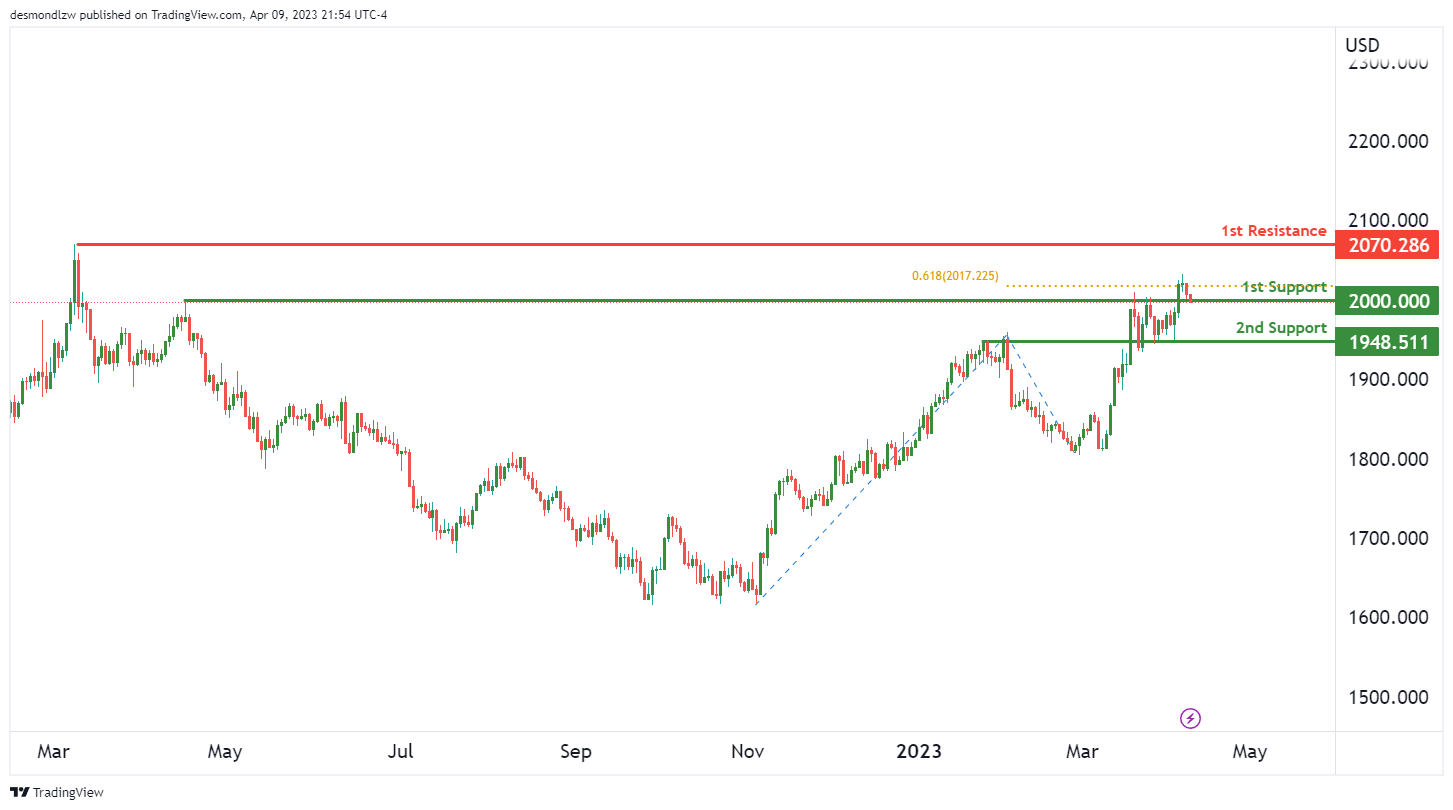
XAU/USD (GOLD):
Gold prices have been experiencing a bullish trend, with the overall momentum of the chart showing a strong uptrend. While there may be some short-term fluctuations, it is likely that the price will continue its upward trajectory.
Looking at the current chart, it appears that the price of gold could potentially bounce off the 1st support level of 2000 and head towards the 1st resistance level of 2070. The 1st support level is a pullback support level, indicating that it could provide a strong foundation for a bullish reversal. The 2nd support level of 1948 is also an overlap support level, providing additional confirmation of potential support at this level.
On the other hand, the 1st resistance level of 2070 is a swing high resistance level, which has historically provided a strong barrier for the price of gold to break through. However, given the strong momentum of the current trend, it is possible that the price could break through this resistance level and continue to rise.


