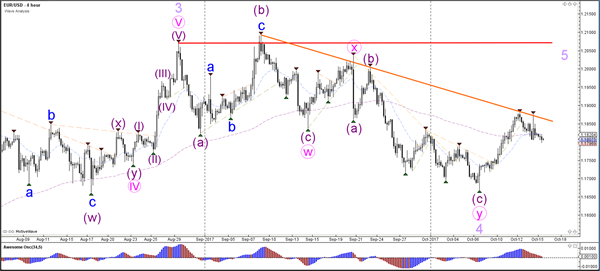
Currency pair EUR/USD
The EUR/USD is challenging a resistance trend line (orange). A bullish breakout could see price challenge the larger resistance (red) but it remains unclear whether price is in a wave 5 or in an expanded wave 4 at the moment. The 1-hour chart however could provide more guidance about that aspect.
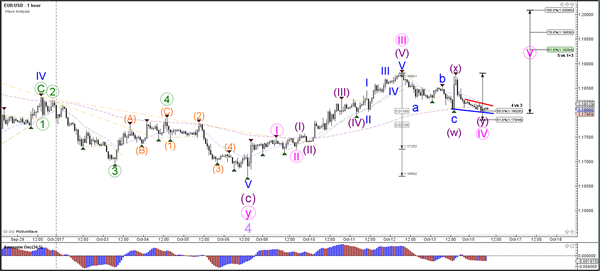
The EUR/USD has retraced back to the 50% Fibonacci level of wave 4 (pink). Price could be ready for a bullish continuation as long as price stays above the 61.8% Fibonacci level. A continuation of the wave 5 would indicate a long-term bullish signal as it completes 5 waves within a larger potential wave 1. A break below 1.18 however could indicate that the wave 4 (purple) is still intact and price could bounce again at the previous bottom around 1.17.
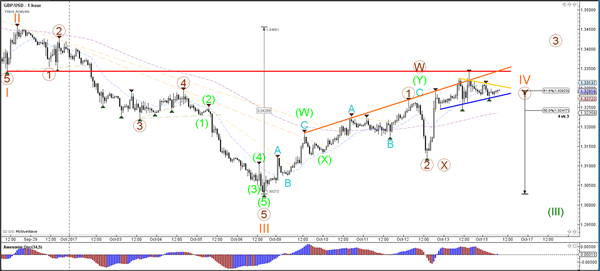
Currency pair GBP/USD
The GBP/USD offers two main scenarios where either a bearish ABC (green) or a wave 123 (green) is taking place. Price invalidates that wave 4 (orange) correction if price breaks above the bottom of wave 1 (red line).
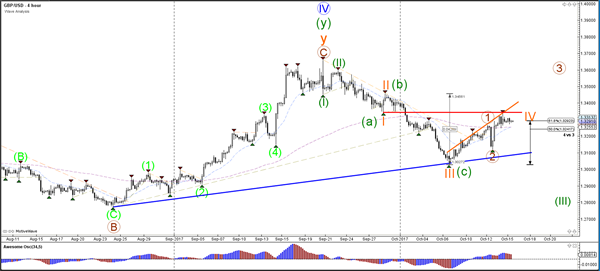
The GBP/USD is building a triangle pattern (orange/blue lines). A bearish break could confirm the completion of wave 4 (orange) whereas a bullish break could invalidate it.
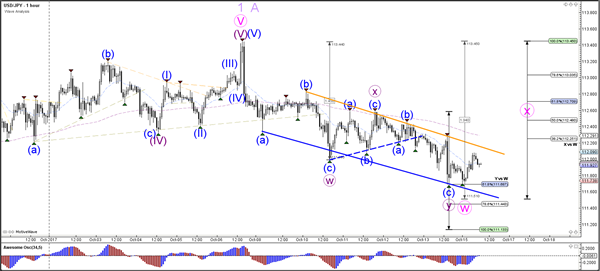
Currency pair USD/JPY
The USD/JPY could be building a larger WXY (pink) correction within wave 2 or B (purple).
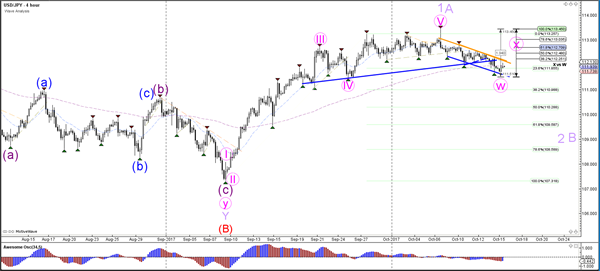
The USD/JPY is in a bearish channel (orange/blue lines) which could be part of a bearish wave Y (purple). A break above the channel could indicate a potential retracement within wave X (pink).