
DXY:
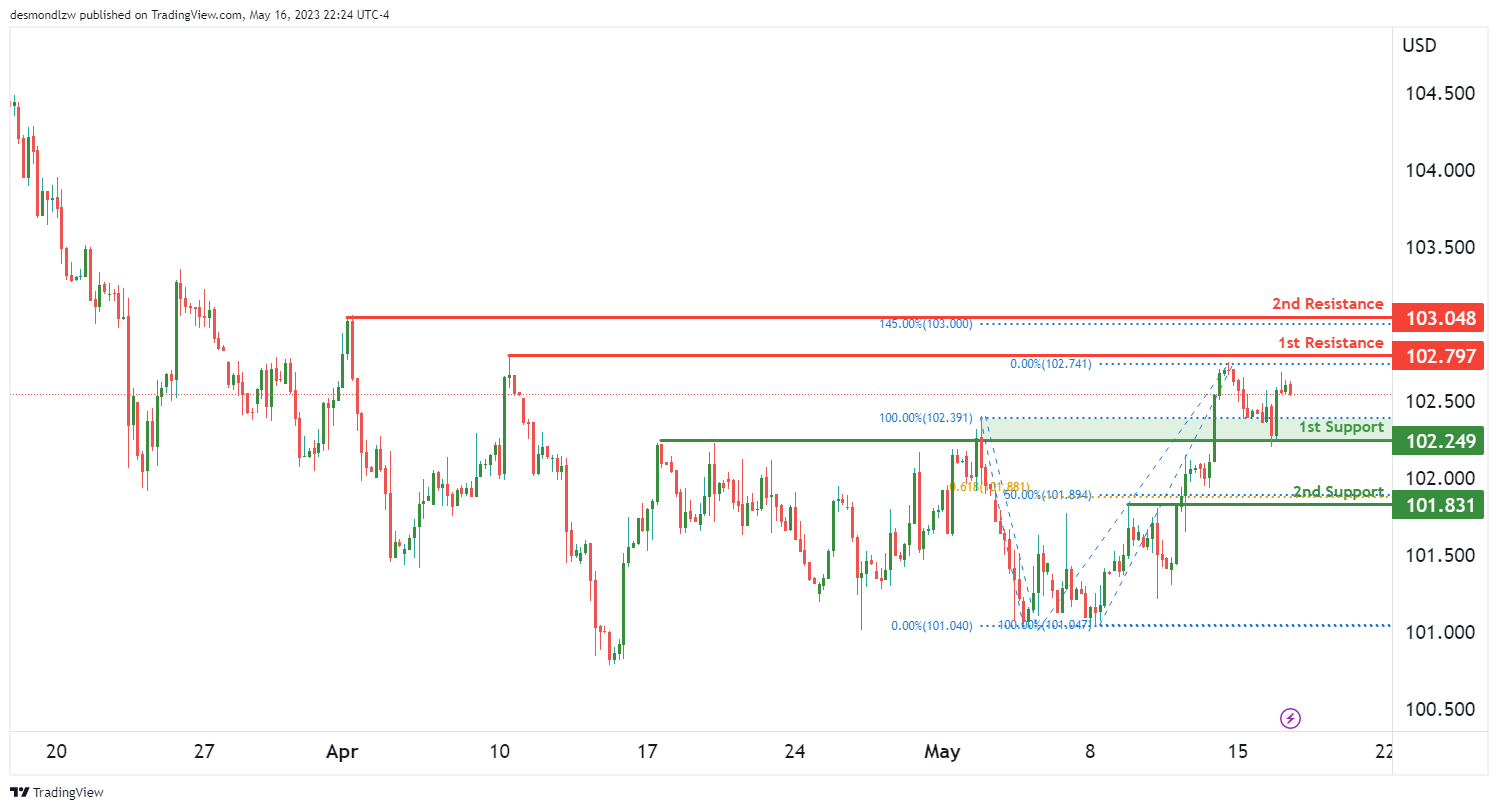
In the context of the DXY, we’re witnessing a weak bullish momentum with low confidence. This suggests a potential bullish continuation towards the 1st resistance, although we should be cautious due to the low confidence in the momentum.
Currently, DXY is being underpinned by a strong 1st support level at 102.24. The strength of this support level comes from it being an overlap support, a phenomenon that often suggests price stability at that level.
Should the price take a downturn, we have our 2nd support firmly established at 101.83. This particular level is characterized as a pullback support, and it aligns with a 61.8% Fibonacci retracement, which often represents a critical inflection point for price movement.
On the upside, if the DXY continues its bullish move, our 1st resistance stands at 102.79. This level is a swing high resistance, hinting that it was a former peak which might present some challenge for the bulls.
In the event of a more substantial bullish breakout, the DXY could potentially ascend towards our 2nd resistance up at 103.04. This is another swing high resistance point and happens to line up with a 145% Fibonacci extension, which may add to the resistance level’s robustness.
Despite the overall weak bullish momentum, it’s essential to consider the potential for price fluctuations. If DXY were to break the 1st resistance, it could trigger a bullish continuation towards the 2nd resistance. However, if DXY falls below the 1st support, it might find its next base at the 2nd support.
EUR/USD:
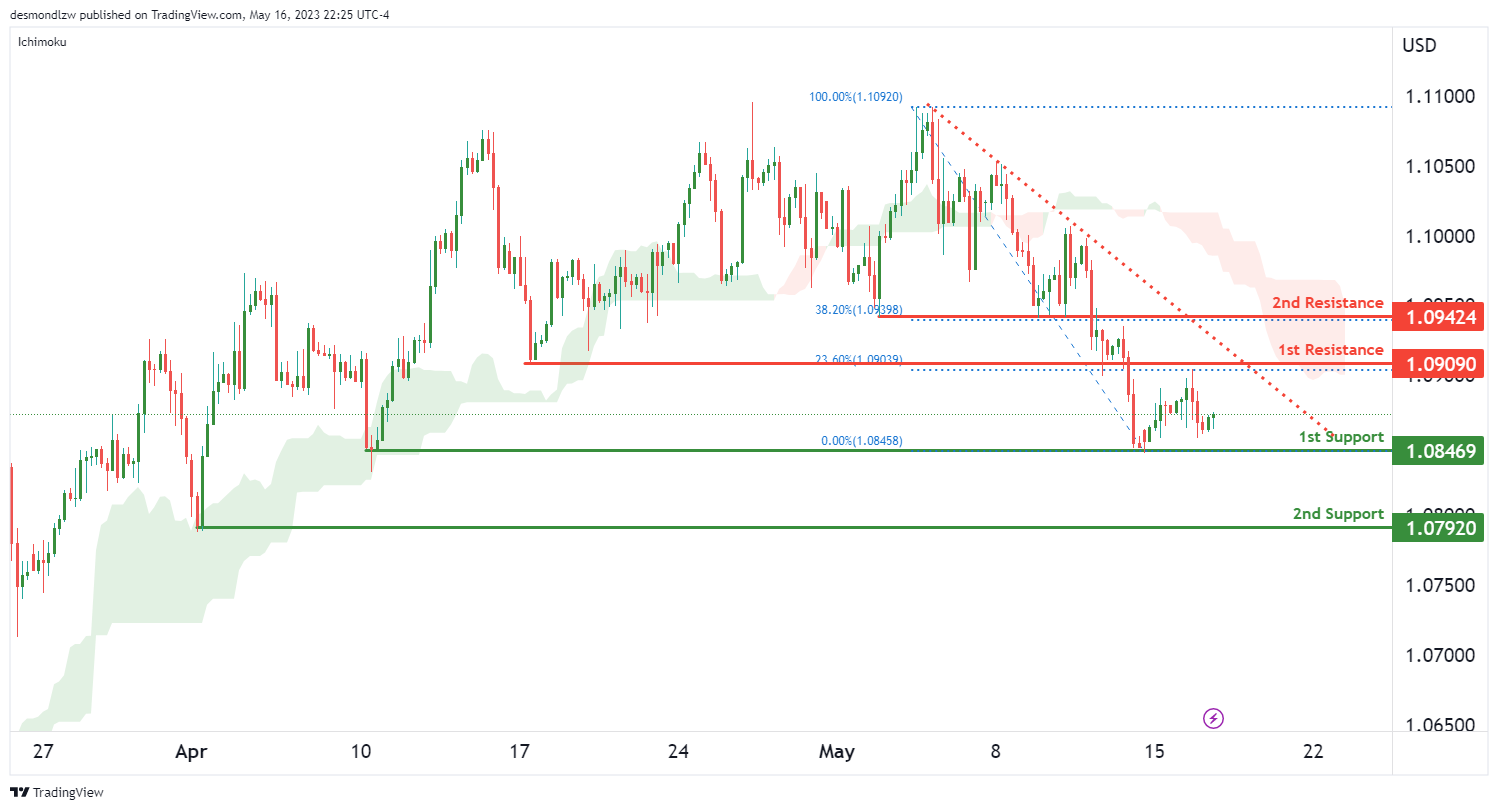
For the EUR/USD, we are currently witnessing a bearish momentum. Notably, the price is below a major descending trend line, suggesting that further bearish momentum may be in the cards. Moreover, the price is also positioned below the bearish Ichimoku cloud, reinforcing the overall bearish bias.
As such, there could potentially be a bearish reaction off the 1st resistance, leading to a drop down to the 1st support level.
Our 1st support is standing at 1.0846. This level acts as a multi-swing low support, often indicating a robust defensive line for the bears. Should the price continue to drop, we have our 2nd support at 1.0792, which is a swing low support point, suggesting that it has previously been a level where the price has found support.
On the flip side, if the EUR/USD attempts a rebound, it will meet our 1st resistance at 1.0909. This level is an overlap resistance and also lines up with a 23.6% Fibonacci retracement, indicating a potentially challenging barrier for the bulls.
In the event of a more pronounced bullish reversal, the EUR/USD could potentially rise towards our 2nd resistance at 1.0942. This level is another overlap resistance point and lines up with a 38.2% Fibonacci retracement, which could add to the resistance level’s strength.
GBP/USD:
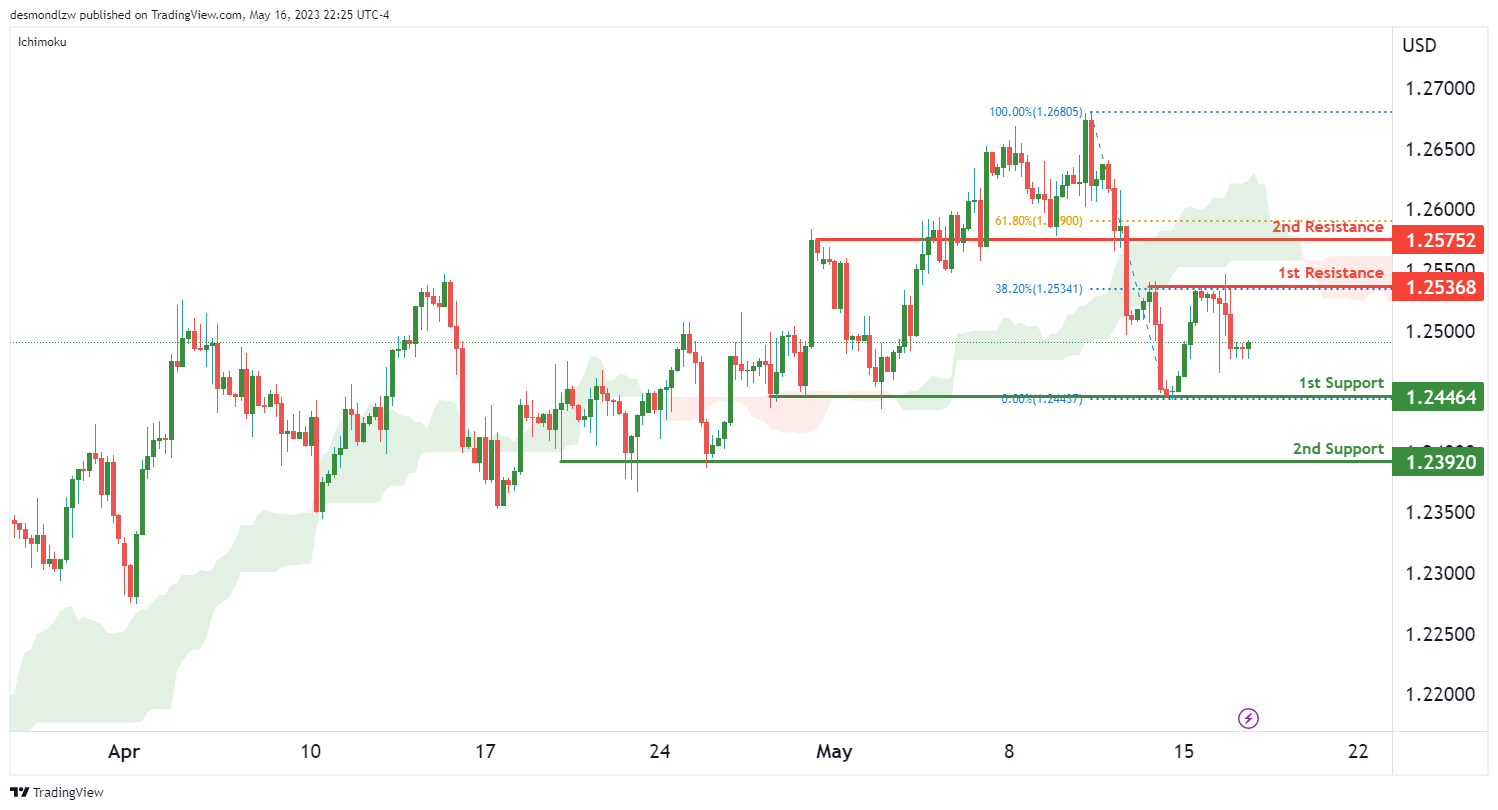
Presently, the GBP/USD is exhibiting a bearish momentum. The price is positioned below a significant descending trend line, which signals that bearish momentum might be in the offing. Furthermore, the price is lodged beneath the bearish Ichimoku cloud, solidifying the overall bearish outlook.
Given this context, there’s a likelihood for a bearish continuation towards the 1st support.
Our 1st support stands firmly at 1.2446. This level serves as a multi-swing low support, indicating it’s been a point of rebound multiple times in the past. In the event of a deeper bearish push, we have a second line of defense in our 2nd support at 1.2392, another multi-swing low support point that could prove to be a robust barrier for the bears.
In contrast, if the GBP/USD attempts a recovery, it will encounter our 1st resistance at 1.2536. This resistance is a multi-swing high resistance and aligns with a 38.2% Fibonacci retracement, suggesting a potential challenge for the bulls.
Should there be a more significant bullish reversal, the GBP/USD could potentially climb towards our 2nd resistance at 1.2575. This resistance point is characterized as a pullback resistance and is in line with a 61.8% Fibonacci retracement, which might add to the resistance level’s strength.
USD/CHF:
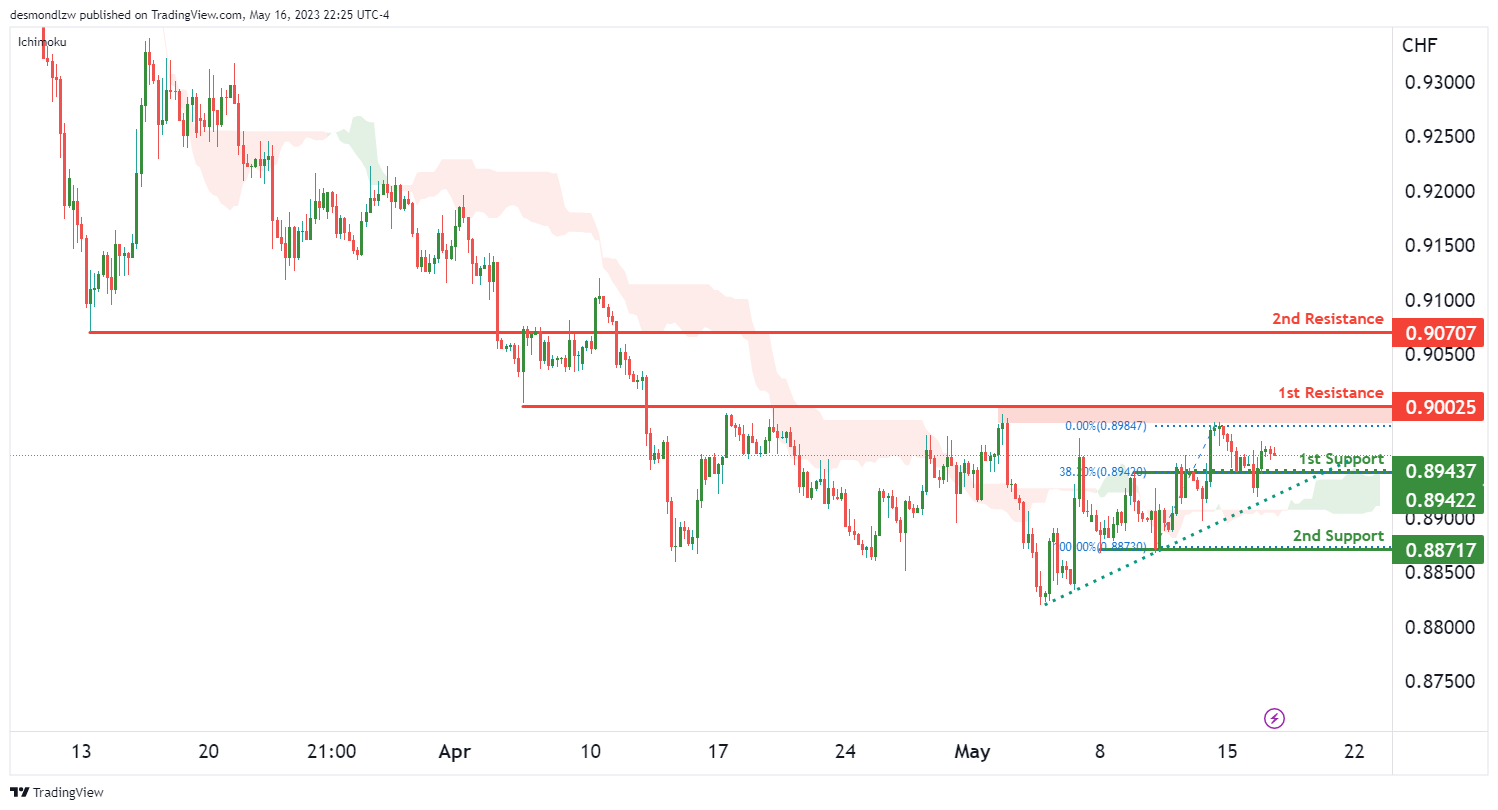
For the USD/CHF, we are currently seeing a bullish momentum. The price is positioned above a significant ascending trend line, suggesting that further bullish momentum might be on the horizon. Additionally, the price is perched above the bullish Ichimoku cloud, which strengthens the overall bullish bias.
With this in mind, there’s potential for a bullish bounce off the 1st support, propelling the price towards the 1st resistance.
Our 1st support stands robustly at 0.8943. This level is characterized as an overlap support and lines up with a 38.2% Fibonacci retracement, often indicating a key level for price reaction. Should the price dip lower, we have our 2nd support at 0.8871, a multi-swing low support point, suggesting that it has previously been a level where price found support.
Conversely, if the USD/CHF continues its upward trajectory, it will encounter our 1st resistance at 0.9002. This level is an overlap resistance, hinting that it could pose a challenge for the bulls.
If there’s a more substantial bullish breakout, the USD/CHF could potentially surge towards our 2nd resistance at 0.9070. This level is another overlap resistance point, which could add to the resistance level’s robustness.
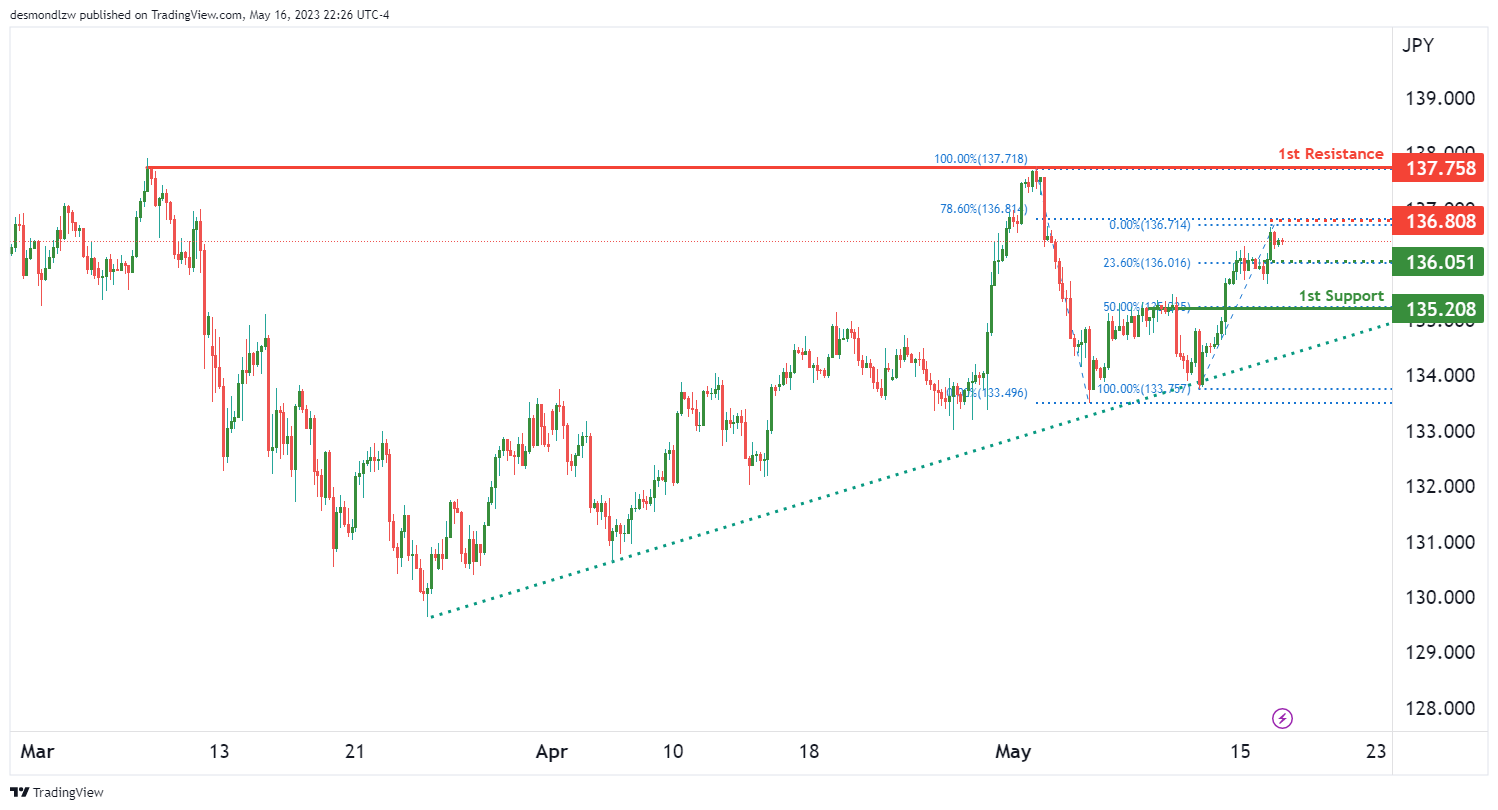
USD/JPY:
The USD/JPY is currently exhibiting bullish momentum. The price is positioned above a significant ascending trend line, suggesting that further bullish momentum might be on the cards.
Given this context, there’s a likelihood for a bullish continuation towards the 1st resistance.
Our 1st support stands firmly at 135.20. This level serves as a pullback support, aligning with a 50% Fibonacci retracement, indicating it’s a key level for price reaction. Between the current price and our 1st support, we have an intermediate support at 136.05, which is a pullback support that lines up with a 23.6% Fibonacci retracement.
In contrast, if the USD/JPY continues its bullish journey, it will encounter our 1st resistance at 137.75. This resistance is a multi-swing high resistance, suggesting a potential challenge for the bulls. Before reaching the 1st resistance, the price might face an intermediate resistance at 136.80, which is a swing high resistance and aligns with a 78.6% Fibonacci retracement.
Given the overall bullish momentum, it’s important to anticipate potential price movements. If the USD/JPY continues its bullish momentum, it could touch the 1st resistance. However, if the USD/JPY falls below the intermediate support, it could potentially drop to the 1st support.
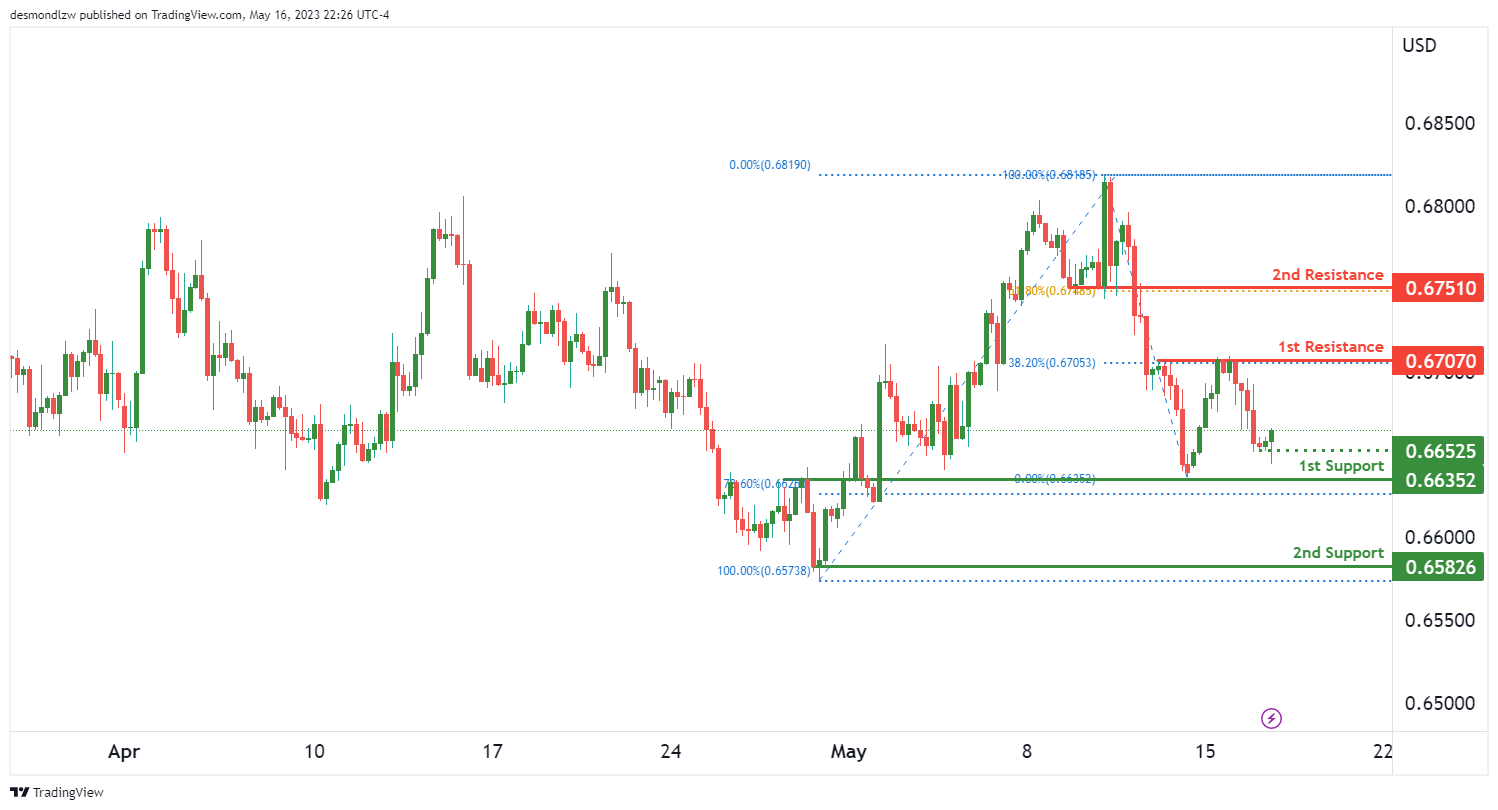
AUD/USD:
Given this context, there’s potential for a bearish break off the 1st support, leading the price to drop towards the 2nd support.
Our 1st support stands robustly at 0.6635. This level is an overlap support that aligns with a 78.6% Fibonacci retracement, indicating it’s a key level for price reaction. If the price were to break below this level, we have our 2nd support at 0.6582. This level is a multi-swing low support point that coincides with a 23.6% Fibonacci retracement, further validating its significance.
Conversely, if the AUD/USD were to rebound, it will encounter our 1st resistance at 0.6707. This level is a multi-swing high resistance, which aligns with a 38.2% Fibonacci retracement, suggesting a potential challenge for the bulls.
Should there be a substantial bullish reversal, the AUD/USD could potentially surge towards our 2nd resistance at 0.6751. This level is a swing high resistance point that coincides with a 61.8% Fibonacci retracement.
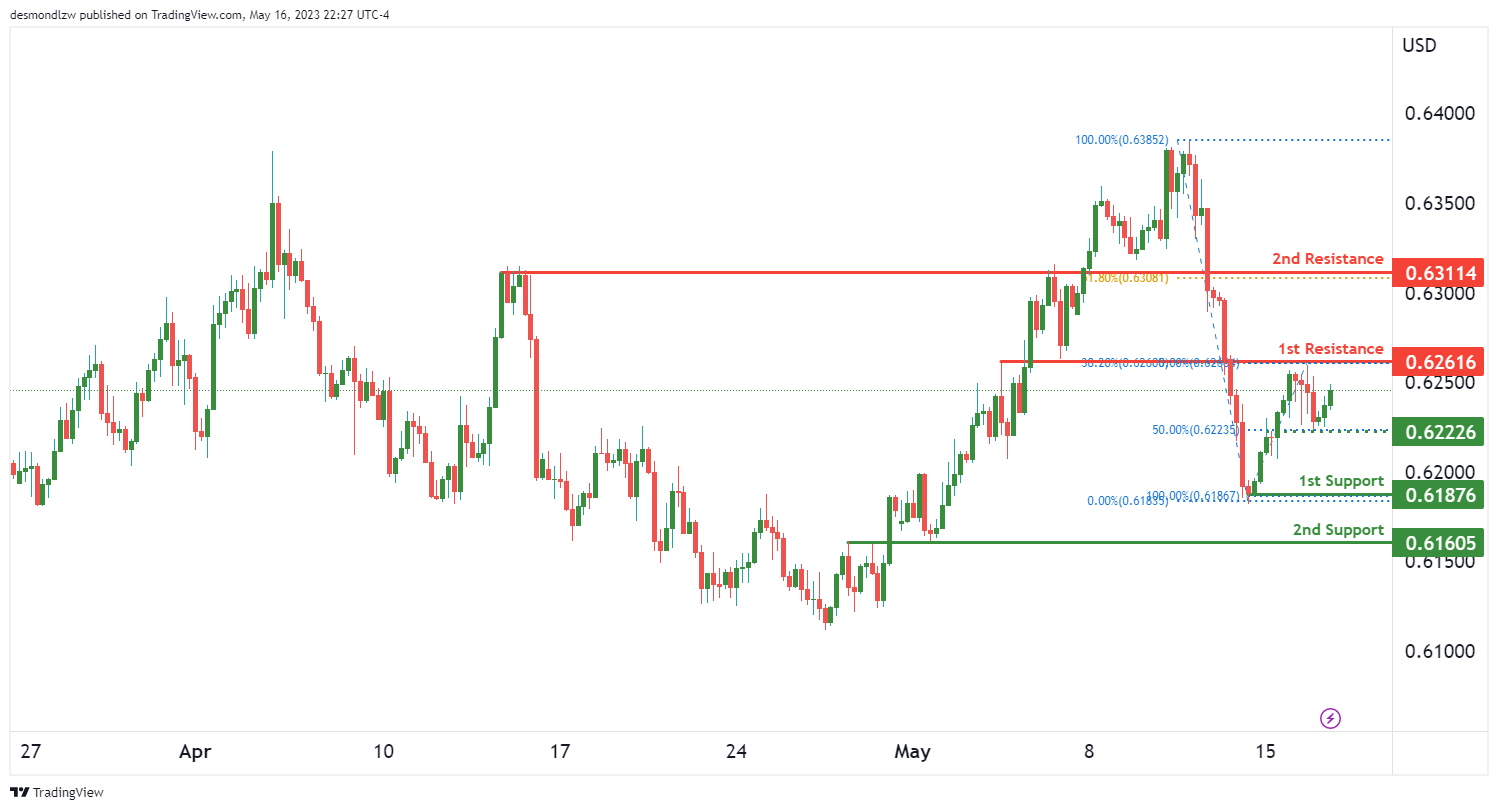
NZD/USD
The NZD/USD chart is currently displaying weak bearish momentum with low confidence. In this context, there’s a potential for a bearish continuation towards the 1st support.
Our 1st support stands solid at 0.6187. This level is a swing low support and could be a key area for price reaction. If the price were to breach this level, we have our 2nd support at 0.6160. This level serves as an overlap support, giving it further significance.
However, an intermediate support at 0.6222, which is an overlap support coinciding with a 50% Fibonacci retracement, lies between the current price and our 1st support. A break of this intermediate support could trigger a bearish acceleration towards our 1st support.
On the upside, if NZD/USD were to bounce back, it will encounter our 1st resistance at 0.6261. This level is an overlap resistance, which coincides with a 38.2% Fibonacci retracement, suggesting a potential obstacle for the bulls.
In the event of a significant bullish reversal, the NZD/USD could potentially rise towards our 2nd resistance at 0.6311. This level serves as a pullback resistance and lines up with a 61.8% Fibonacci retracement.
Given the overall weak bearish momentum, it’s crucial to anticipate potential price movements. If the NZD/USD were to break below the 1st support, it could trigger a bearish movement towards the 2nd support. However, if NZD/USD rebounds from the 1st support, it could potentially rise to the 1st resistance.
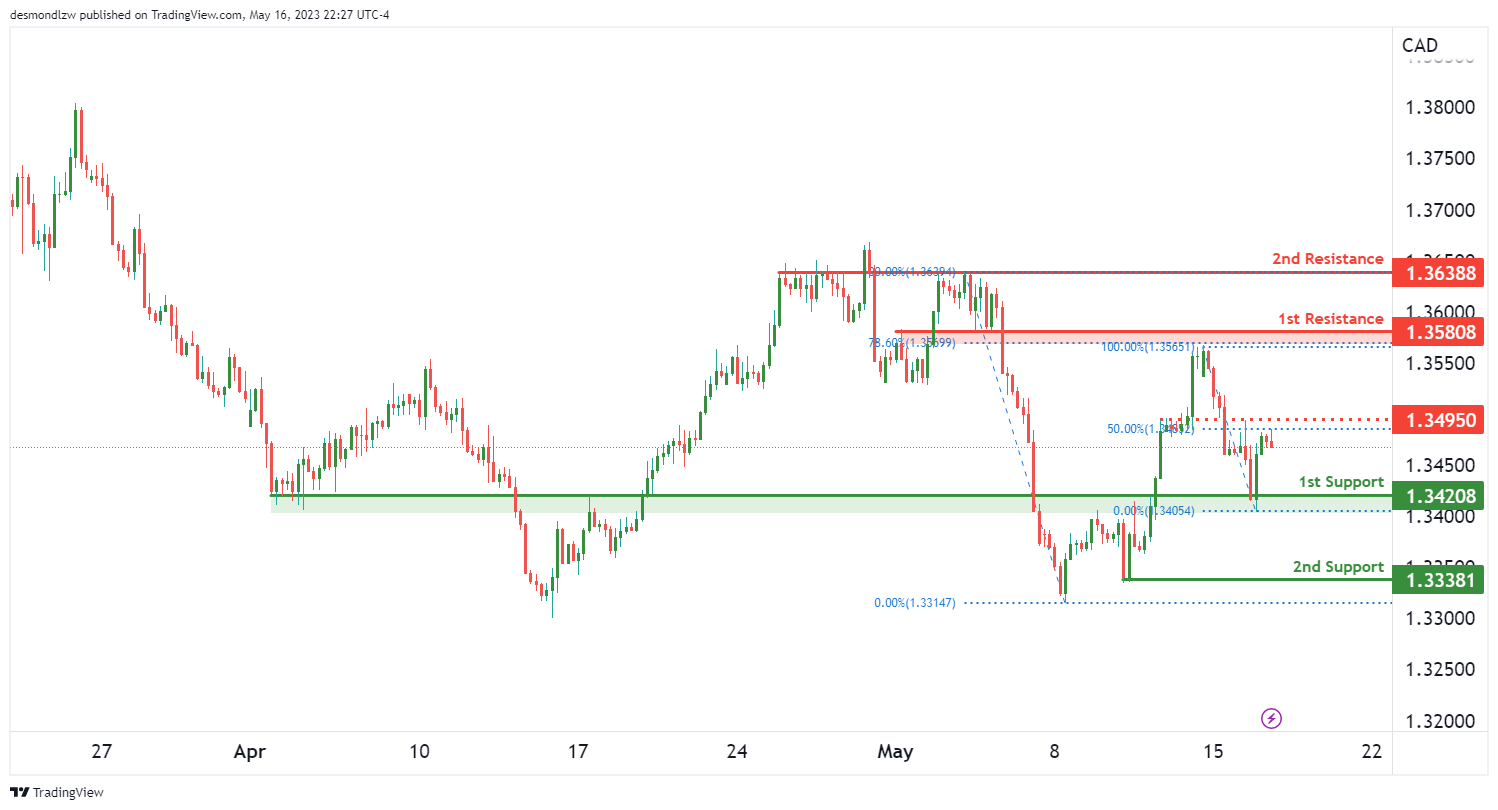
USD/CAD:
Currently, the USD/CAD chart is showing a bearish momentum. This suggests there’s a potential for a bearish continuation towards the 1st support.
Our 1st support is found at 1.3420. This level presents an overlap support, making it an area of interest for potential price reactions. If the price were to break through this level, we could see a drop towards the 2nd support at 1.3338, a level which has acted as a multi-swing low support in the past.
However, there’s an intermediate resistance at 1.3495 that could play a significant role. This overlap resistance aligns with a 50% Fibonacci retracement, making it a notable barrier for the price. If the price were to break this intermediate resistance, it might trigger a bullish acceleration towards our 1st resistance.
On the bullish side, if the USD/CAD were to reverse and bounce back, it could run into our 1st resistance at 1.3580. This level serves as an overlap resistance and coincides with a 78.6% Fibonacci retracement, suggesting a potential hurdle for the bulls.
If the price were to break through our 1st resistance, it could potentially rise towards our 2nd resistance at 1.3638. This level also serves as an overlap resistance, adding to its significance.
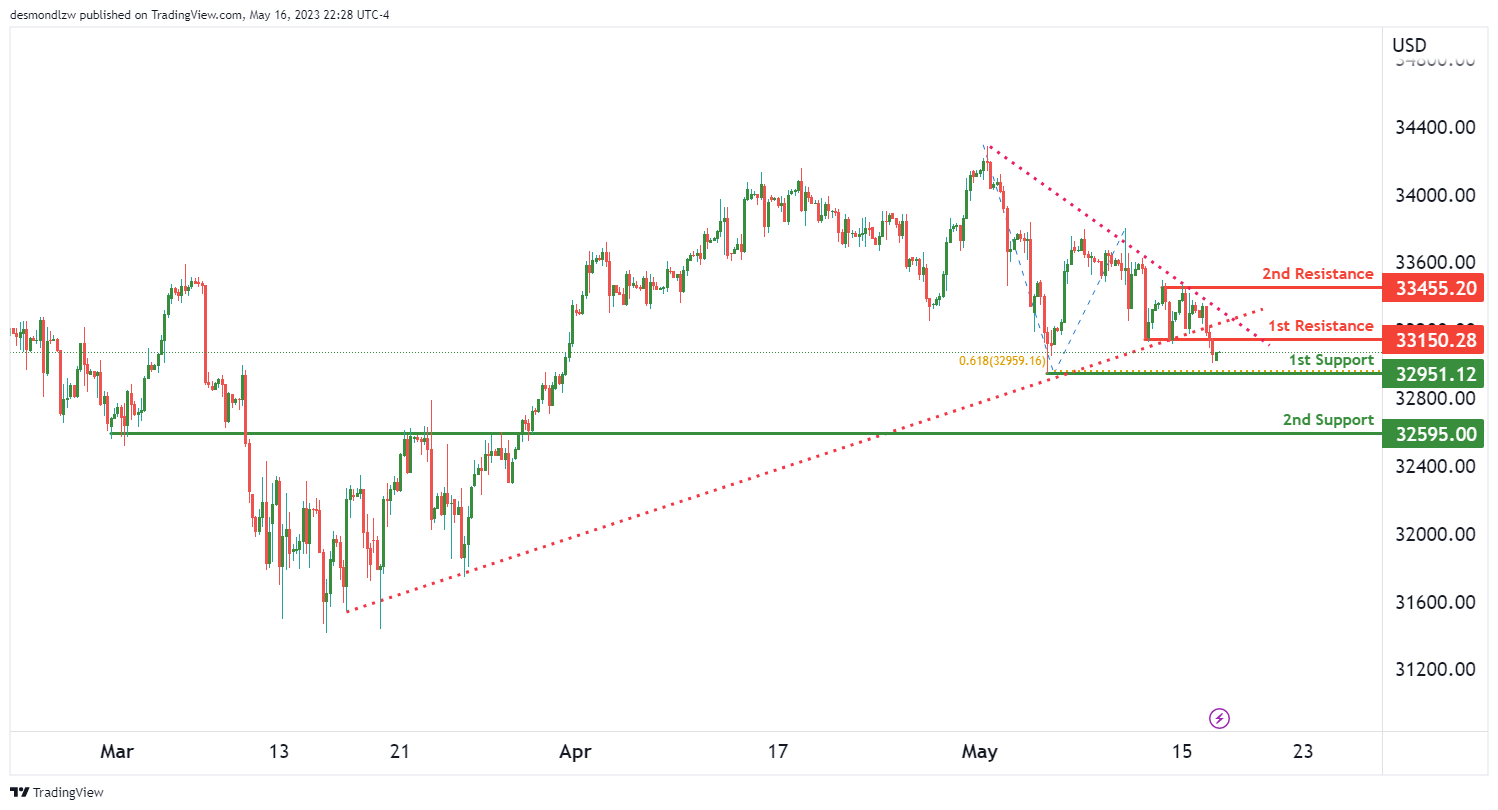
DJ30:
THe DJ30 is exhibiting a bearish momentum. This suggests a potential for a bearish break off the 1st support and a subsequent drop towards the 2nd support.
The 1st support is situated at 32951.12. This level acts as a swing low support and coincides with a 61.8% Fibonacci projection, indicating a significant area for possible price reactions. If the price were to breach this level, it could fall towards the 2nd support at 32595.00, which has previously acted as an overlap support.
On the flip side, if the USD/CAD were to reverse its course and rally, it might encounter our 1st resistance at 33150.28. This level acts as a pullback resistance and could pose a challenge for the bulls.
Should the price break above our 1st resistance, it could potentially ascend towards our 2nd resistance at 33455.20. This level serves as a multi-swing high resistance, further reinforcing its significance.
Given the overall bearish momentum and the presence of a bearish symmetrical triangle, which is a bearish continuation chart pattern, it’s crucial to anticipate potential price movements. If the USD/CAD were to break below the 1st support, it could prompt a bearish move towards the 2nd support. However, if the USD/CAD rebounds from the 1st support, it could potentially climb to the 1st resistance.
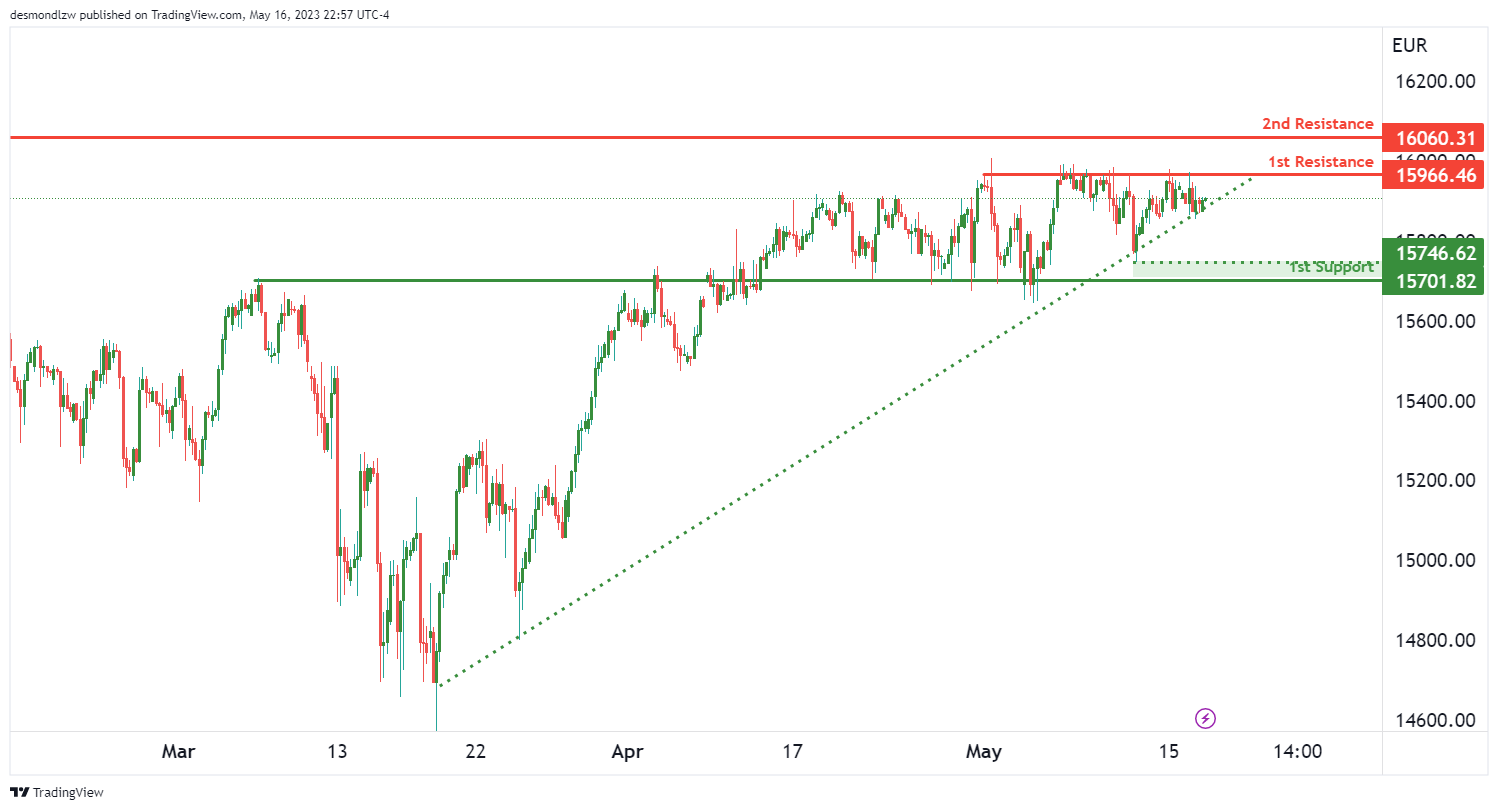
GER30:
Currently, the GER30, or the German DAX index, is showcasing a bullish trend. This upward momentum is supported by the fact that the price is situated above a major ascending trend line, suggesting that further bullish momentum is on the horizon.
The potential for the GER30 is a bullish breakthrough of the first resistance level, leading to a rise towards the second resistance.
In the event of a market correction, the first line of support lies at 15701.82. This level has shown to be a reliable overlap support, providing a solid foundation for potential price rebounds.
Closer to the current price action, an intermediate support level is located at 15746.62. This level has previously acted as a swing low support, providing an additional layer of protection against bearish fluctuations.
On the other hand, if the bullish momentum persists, traders should watch out for the first resistance level at 15966.46. This multi-swing high resistance has the potential to hinder further upward movement.
If the market can overcome this first resistance, the next level to watch out for is the second resistance at 16060.31. This swing high resistance could present the next challenge for the bullish trend.
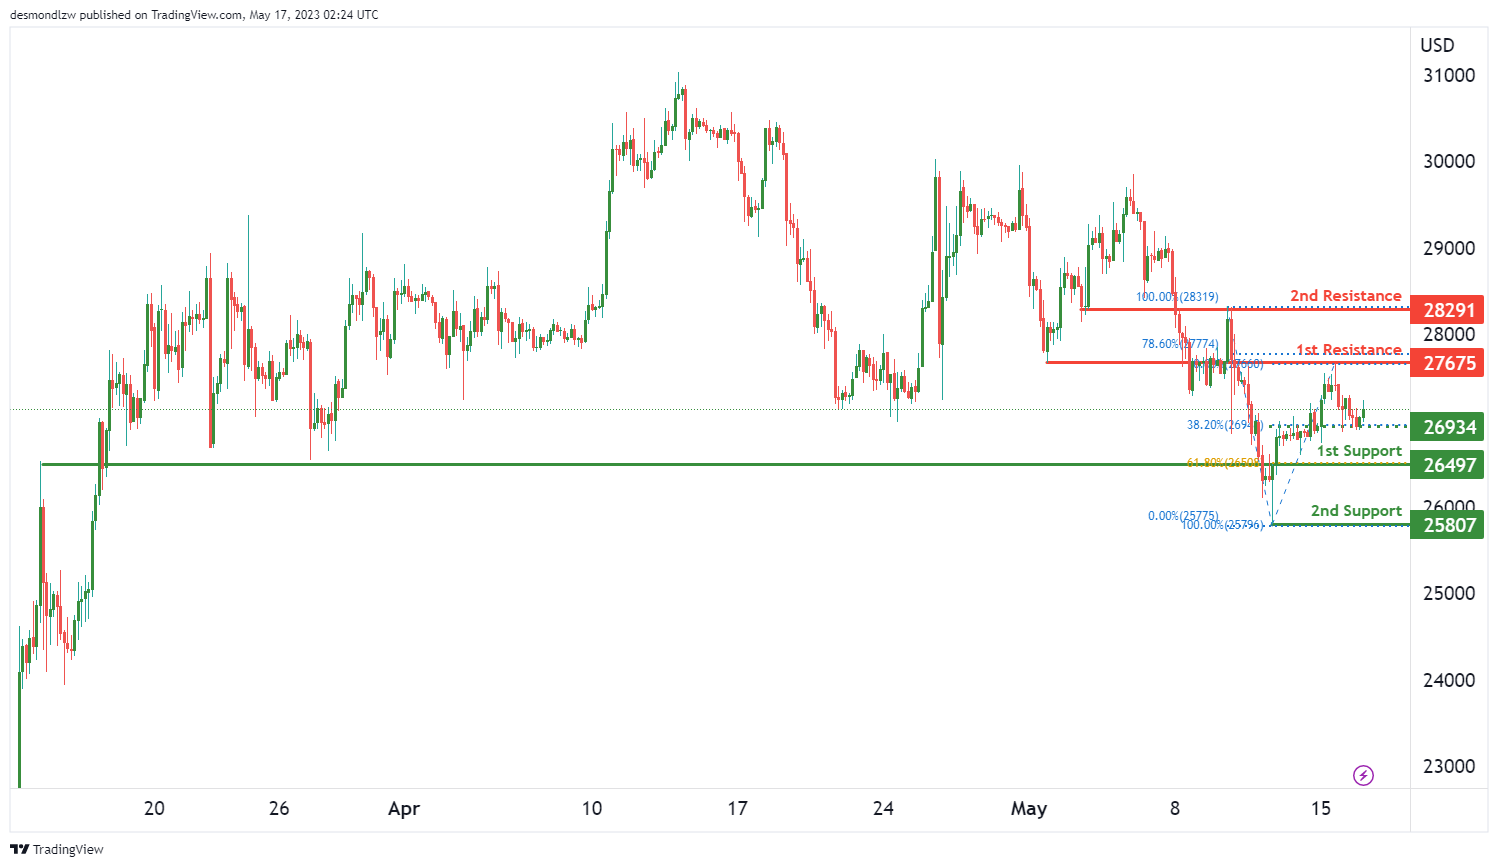
BTC/USD:
The Bitcoin (BTC) to US Dollar (USD) pair currently exhibits a bearish trend, with a potential for the price to continue moving towards the first support level.
At the moment, the first line of support for BTC/USD is at 26497. This level serves as a notable overlap support, and it aligns with the 61.80% Fibonacci retracement level, suggesting that it could be a significant area for potential price rebounds.
An intermediate support level is found at 26934. This level also functions as an overlap support and corresponds to the 38.20% Fibonacci retracement level, adding an extra layer of potential support closer to the current price action.
If the bearish momentum persists, the price could potentially drop to the second support level at 25807, which has previously acted as a swing low support.
On the upside, if a reversal occurs, the first resistance level to watch is at 27675. This overlap resistance coincides with the 78.60% Fibonacci retracement level, which could serve as a substantial barrier to bullish movements.
Beyond that, the second resistance level is located at 28291, and it also acts as an overlap resistance, presenting another potential hurdle for any bullish resurgence.
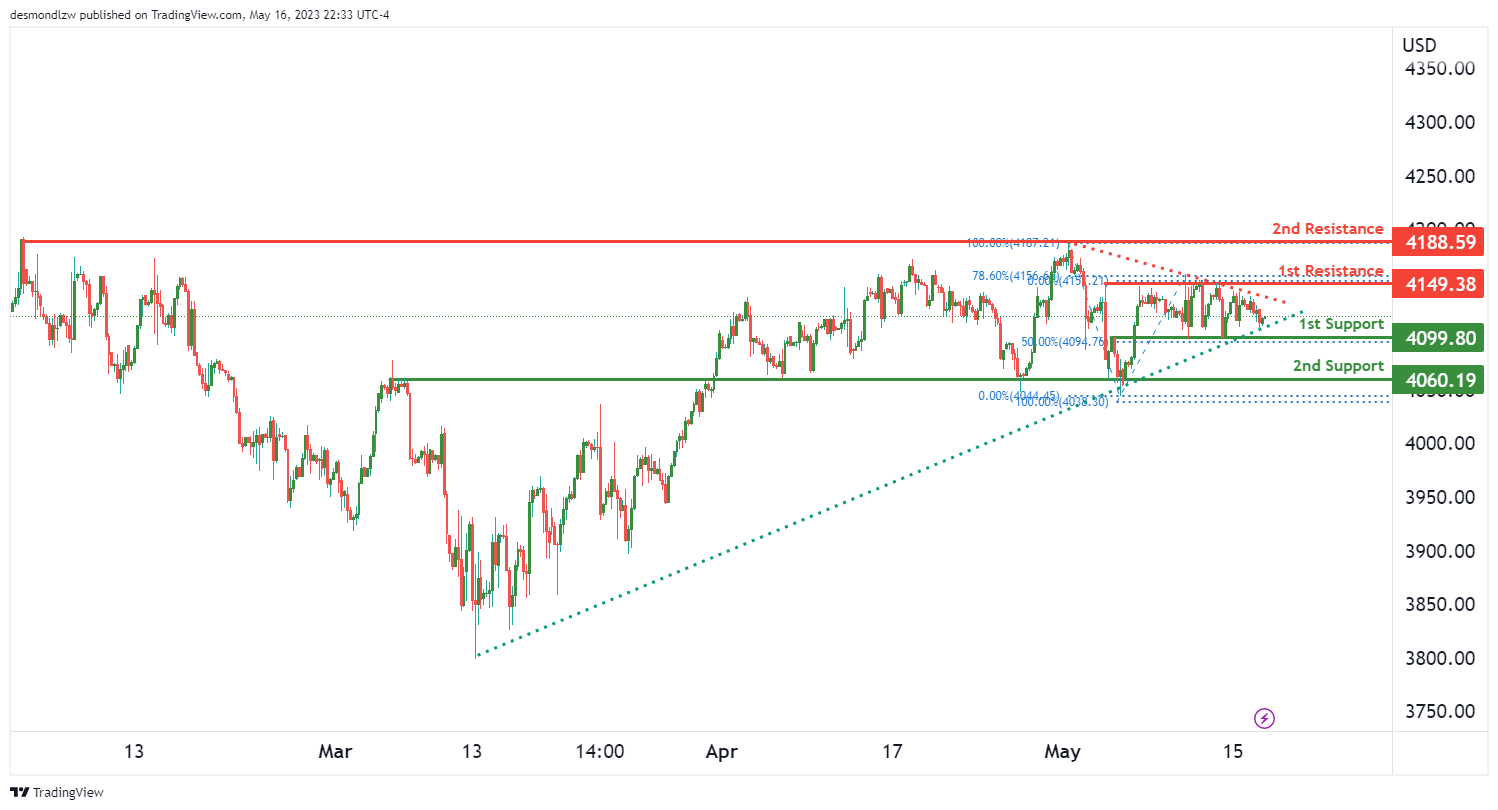
US500
The US500, also known as the S&P 500 Index, is currently demonstrating a neutral momentum, suggesting that the price could potentially fluctuate between the first support and resistance levels.
The first line of support for the US500 is located at 4099.80, acting as an overlap support. This level could serve as a strong foundation for the price if a downward movement occurs.
Further below, the second support level stands at 4060.19. This level also functions as an overlap support, offering an additional layer of defense against a potential bearish turn.
On the upside, the first resistance level is found at 4149.38. This level, which has served as a multi-swing high resistance, could present a significant barrier to any bullish attempts.
Above that, the second resistance level is situated at 4188.59. This level has also acted as a multi-swing high resistance, and it could further impede upward movements.
Notably, the US500 is currently exhibiting a symmetrical triangle chart pattern. This pattern typically represents a period of consolidation before the price is forced to breakout or breakdown. A break above the upper trendline of the pattern could signal a bullish breakout, while a break below the lower trendline might indicate a bearish breakdown.
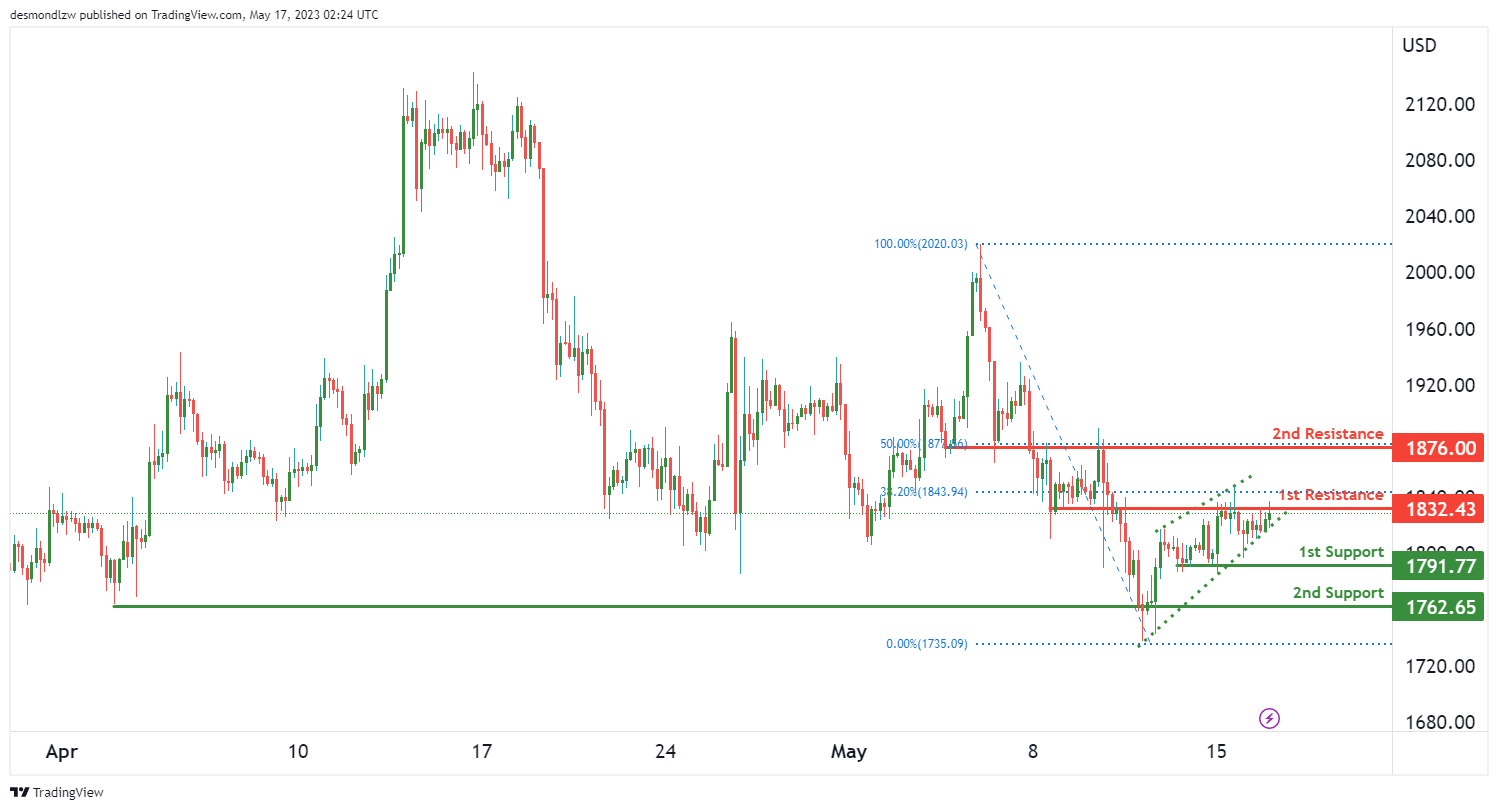
ETH/USD:
The ETH/USD pair is currently showing bearish momentum, suggesting that the price could potentially react off the first resistance level and drop to the first support level.
The first line of support for the ETH/USD is located at 1791.77. This level is serving as a multi-swing low support, which could offer a strong support if a downward price movement occurs.
The second support level is found slightly lower at 1762.65. This is another multi-swing low support level, offering an additional layer of defense against a potential bearish move.
On the upside, the first resistance level is set at 1832.43. This overlap resistance, further reinforced by a 38.20% Fibonacci retracement level, could be a significant hurdle for any bullish attempts.
Above that, the second resistance level is set at 1876.00. This level, also acting as an overlap resistance and accompanied by a 50% Fibonacci retracement level, could further challenge upward movements.
It’s noteworthy to mention that the pair is forming a bearish rising wedge pattern. This type of pattern typically signals that the price is likely to drop and move in the downward direction soon.
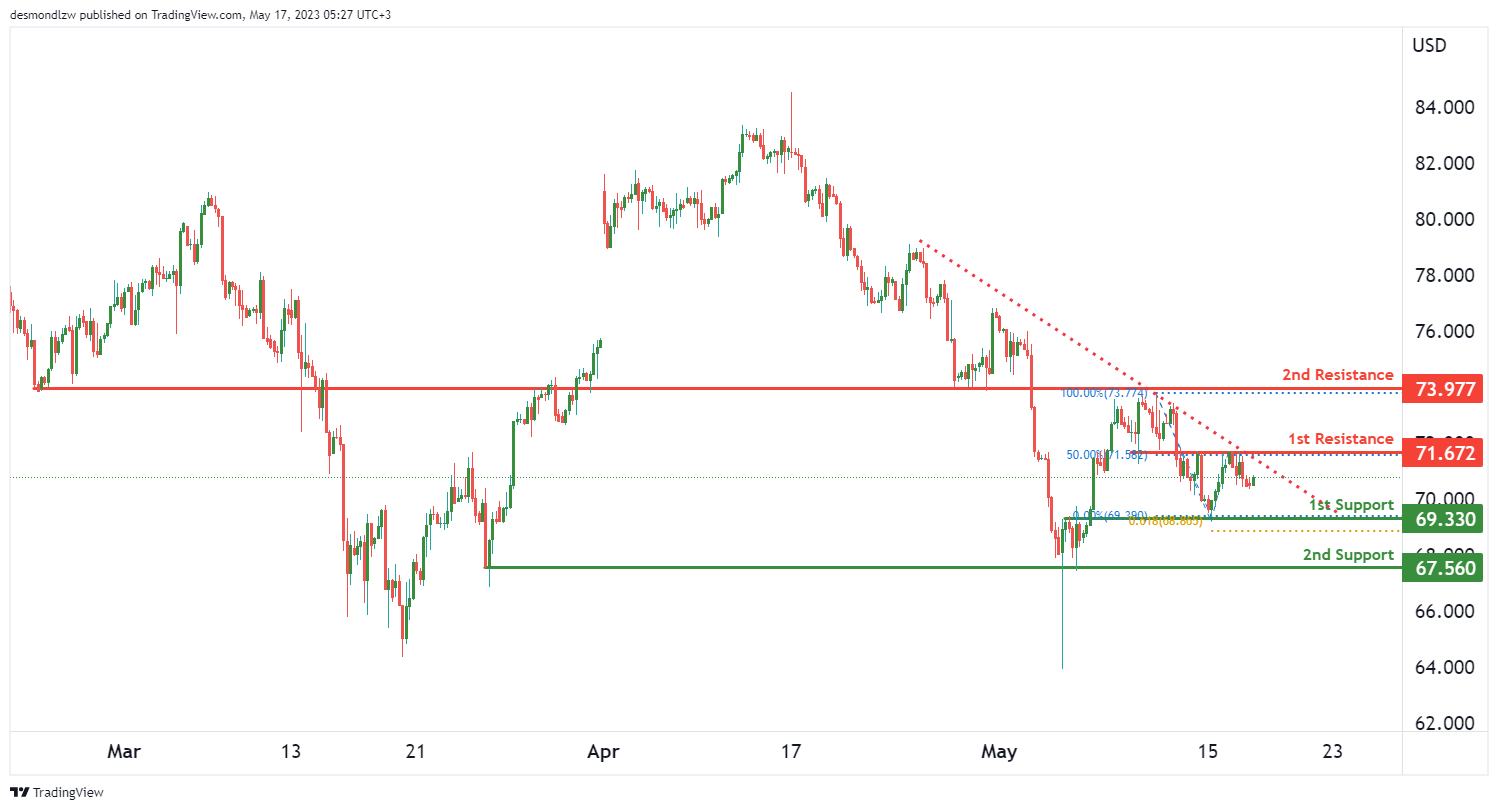
WTI/USD:
The WTI instrument is currently on a bearish momentum, suggested by the price being below a major descending trend line.
The first line of support for WTI is located at 69.33. This level is acting as an overlap support, further reinforced by a 61.80% Fibonacci projection level. This could offer a strong hold against further bearish movements.
The second support level is found slightly lower at 67.56. This is a multi-swing low support level, offering an additional layer of protection against a potential downward price move.
On the upside, the first resistance level is set at 71.67. This overlap resistance, accompanied by a 50% Fibonacci retracement level, could be a significant hurdle for any bullish attempts.
Above that, the second resistance level is set at 73.97. This level, also acting as an overlap resistance, could further challenge upward movements.
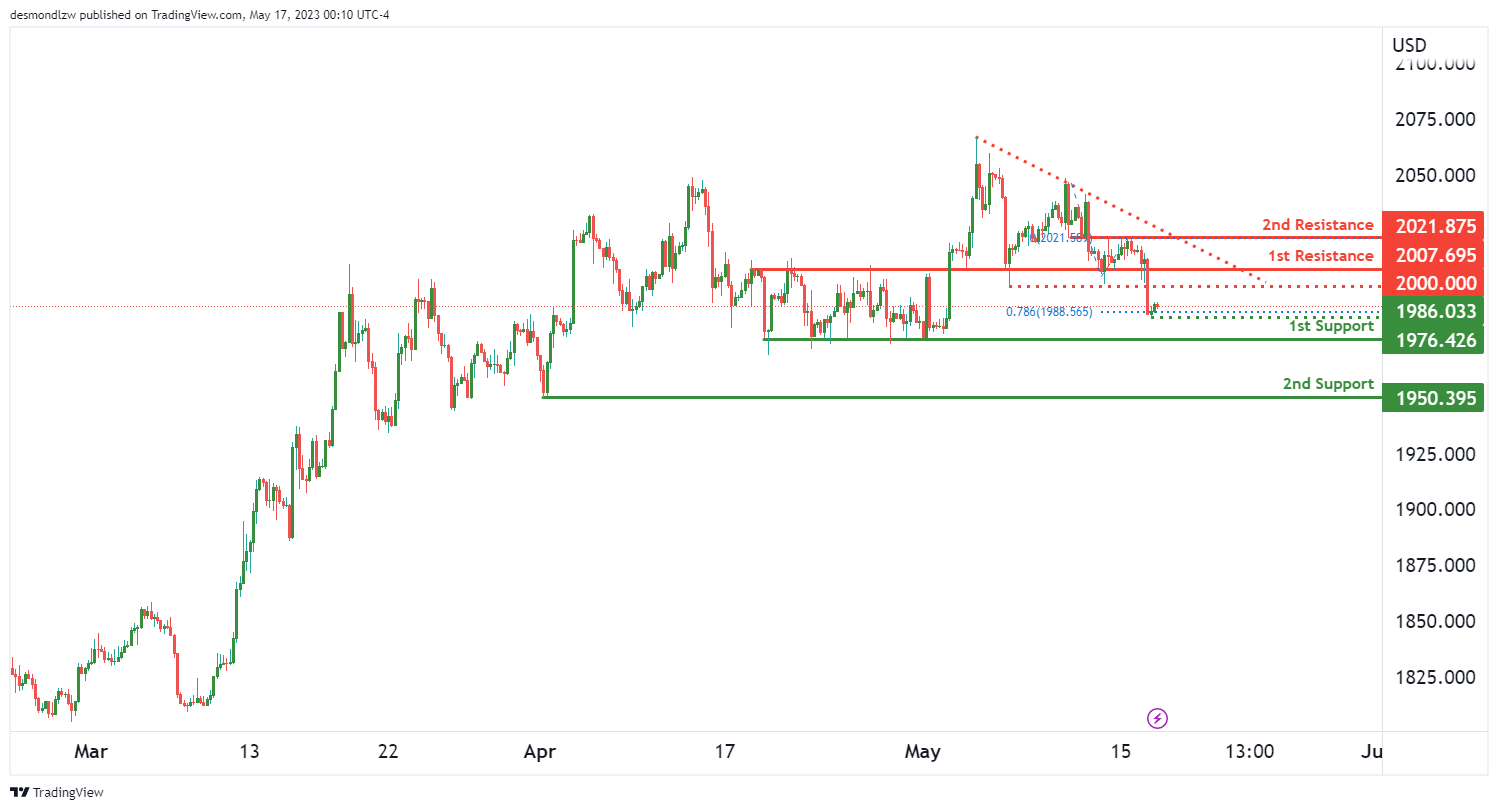
XAU/USD (GOLD):
The XAU/USD pair is currently showing a bearish momentum as the price is below a major descending trend line, suggesting that further bearish momentum could be on the cards.
The first line of support for XAU/USD is located at 1976.42. This level is acting as a multi-swing low support and could offer a strong hold against further bearish movements.
The second support level is found slightly lower at 1950.39. This is also a multi-swing low support level, offering an additional layer of protection against a potential downward price move.
On the upside, the first resistance level is set at 2007.69. This pullback resistance could be a significant hurdle for any bullish attempts.
Above that, the second resistance level is set at 2021.87. This level, acting as an overlap resistance, could further challenge upward movements.
In between these levels, there’s an intermediate resistance point at 1986.03. This point, acting as a swing low support, is also aligned with the 78.60% Fibonacci projection, which could cause some price reactions.


