
- 4-week of decline has almost reached 31,530 key medium-term support
- Oversold condition with the formation of hourly bullish “Hammer” Japanese candlestick
- Key intermediate resistances will be at 32,730 and 33,200
This is a follow-up analysis of our prior report, “Nikkei 225 Technical: Minor corrective decline in progress” published on 6 July 2023.
The price actions of the Japan 225 Index (a proxy of the Nikkei 225 futures) have extended its minor corrective decline within its medium-term uptrend phase and almost met the 31,530 support as per defined in our earlier report. It printed a current intraday low of 31,769 in today, 12 July Asian session at this time of the writing.
Interestingly, several positive elements have emerged that advocate for a potential bullish reversal in price actions at least in the short-term horizon.
The drop in price actions has reached the medium-term ascending channel support
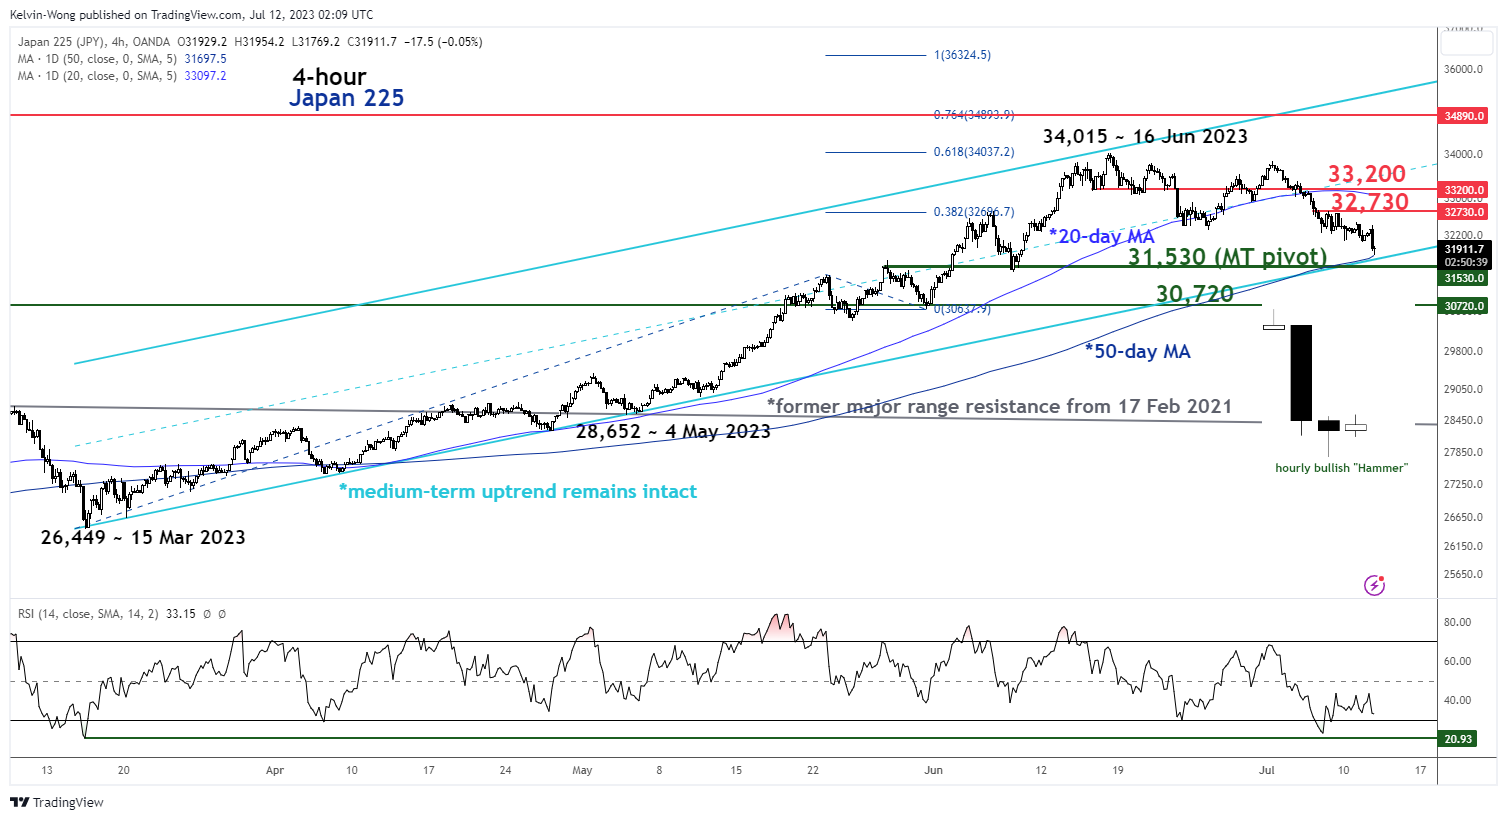
Fig 1: Japan 225 short-term & medium-term trends as of 12 Jul 2023 (Source: TradingView, click to enlarge chart)
The four weeks decline of -6.6% from its 16 June 2023 high of 34,015 has almost reached the lower boundary of the medium-term ascending channel in place since the 15 March 2023 low of 26,449 that is now acting as a support at 31,530.
The aforementioned 31,530 support also confluences closely with the 23.6% Fibonacci retracement of the medium-term uptrend from the 15 March 2023 low to the 16 June 2023 high and the 1.236 Fibonacci extension of the minor decline from the 16 June 2023 high to the 27 June 2023 low projected from 3 July 2023 high.
Oversold condition with bullish Japanese candlestick
The four weeks decline in the price actions has led the 4-hour RSI oscillator into an extremely oversold level of 23.3 level on 6 July 2023 which was the lowest oversold reading since the 15 March 2023 level of 20.9 that coincided with the start of the current medium-term uptrend phase of the Index.
Secondly, the current intraday price actions have also formed an hourly bullish “Hammer” Japanese candlestick pattern which suggests a potential change in sentiment from negative to positive on the short-term horizon.
These two elements (oversold reading in the 4-hour RSI coupled with hourly bullish “Hammer” Japanese candlestick) have taken shape right above the medium-term ascending channel support of 31,530 and the upward-sloping 50-day moving average.
Watch the 31,530 key medium-term pivotal support to maintain a potential bullish reversal with the next resistances coming in at 32,730 and 33,200 (also the 20-day moving average).
However, a break below 31,530 invalidates the bullish tone to expose the next support at 30,720.


 have extended its minor corrective decline within its medium-term uptrend phase and almost met the 31,530 support as per defined in our earlier report. It printed a current intraday low of 31,769 in today, 12 July Asian session at this time of the writing.)