
DXY:
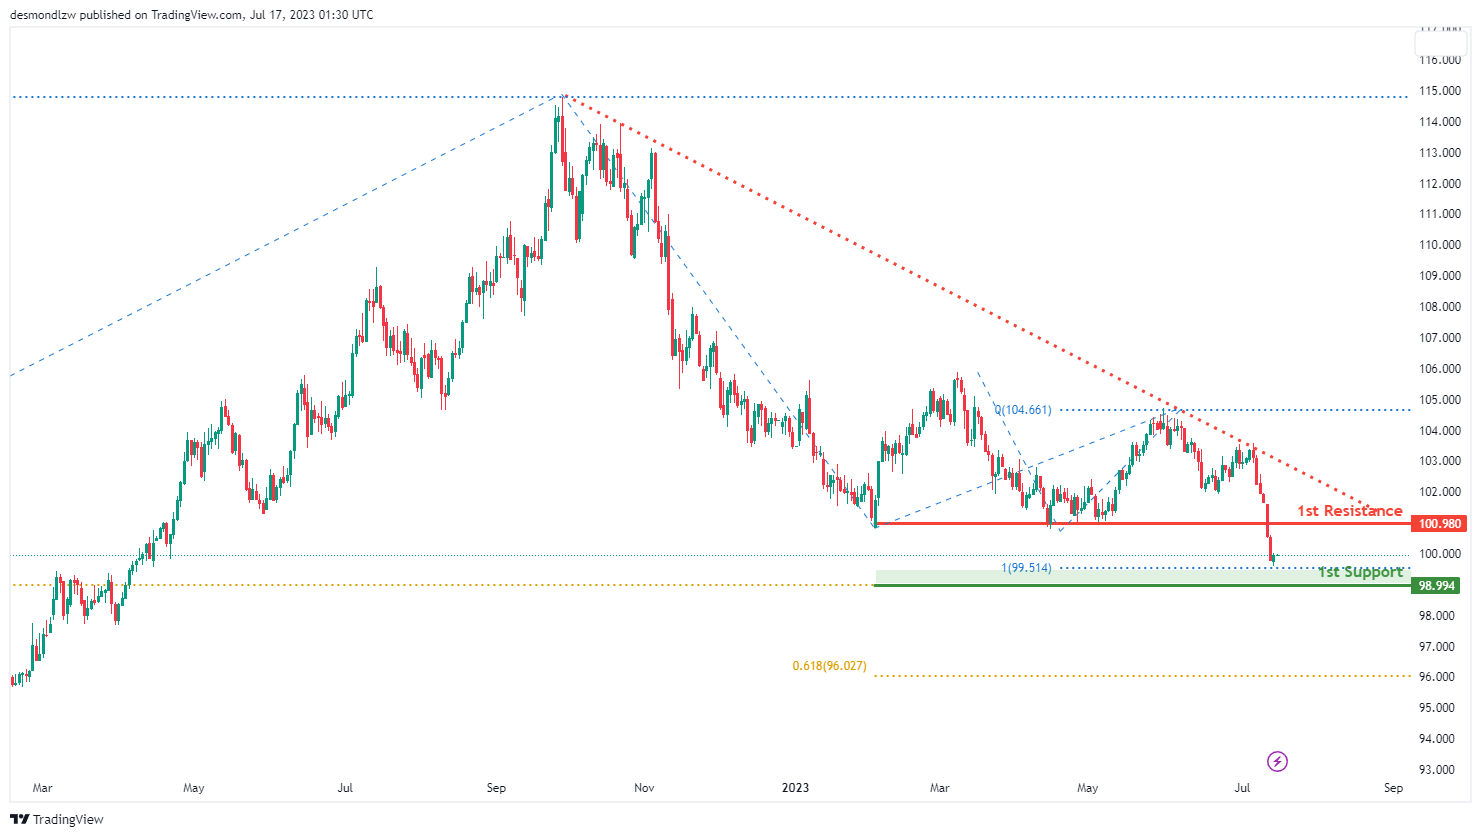
The DXY (US Dollar Index) chart is currently showing a bearish momentum. However, the market could potentially make a bullish bounce off the 1st support and move towards the 1st resistance.
The 1st support level is at 99.42. This is an overlap support and also a 100% Fibonacci Projection level. This suggests that the market has found buying interest at this price in the past, which could potentially cause a bounce upwards.
The 2nd support level is at 97.72. This is another overlap support, indicating a price level where historically buying interest has been strong. If the price drops further, this could be an area where buyers step in.
The 1st resistance level is at 100.84. This is known as a pullback resistance, meaning the price could face selling pressure and potentially reverse its direction when it reaches this level.
The 2nd resistance level is at 101.94. This is an overlap resistance level, signaling a price point where the market has previously encountered significant selling pressure. If the price rises to this level, it could attract sellers who may push prices down.
EUR/USD:
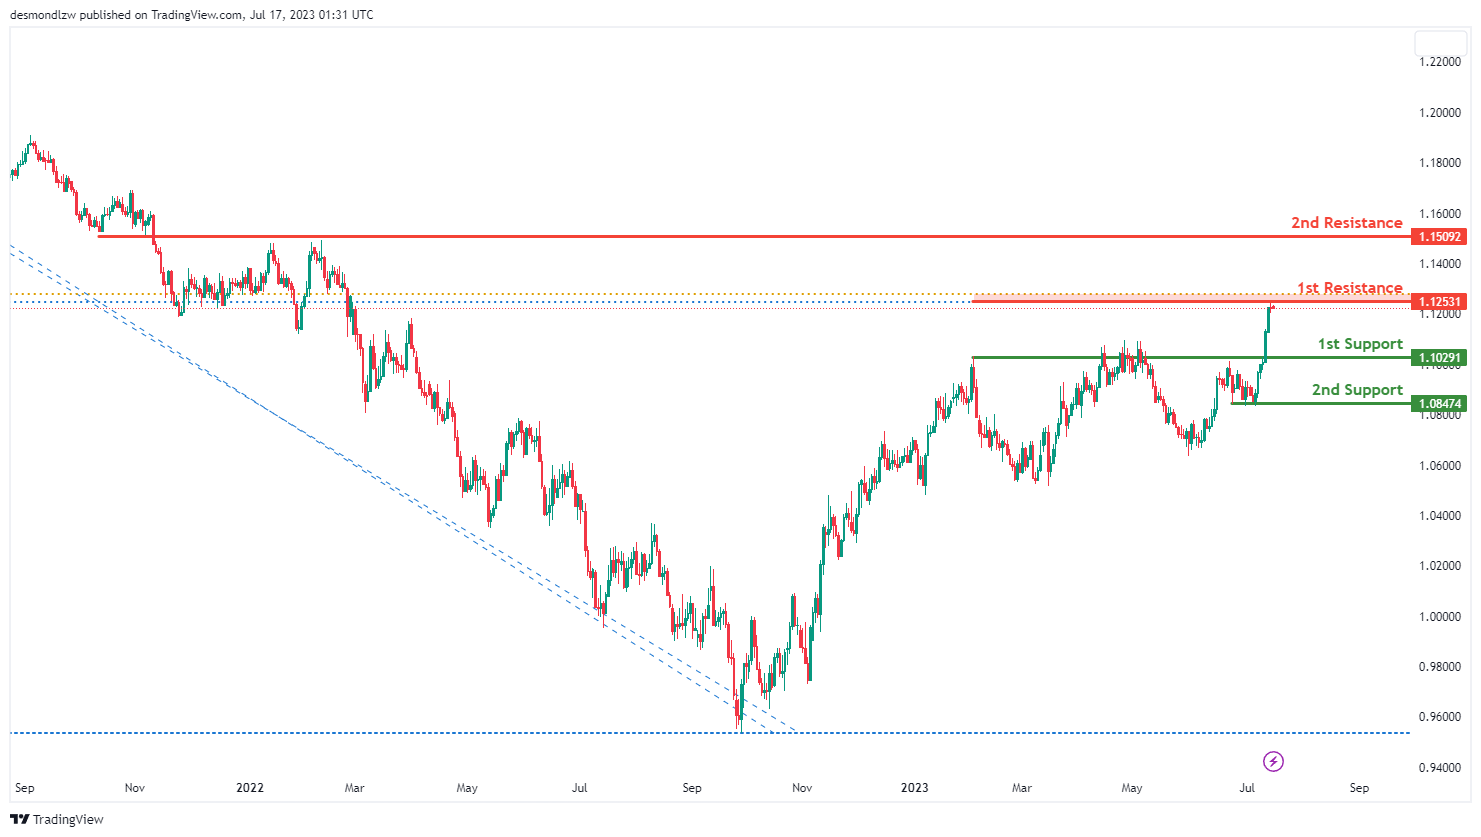
The EUR/USD pair is currently exhibiting a bearish momentum. The potential course for the price could be a bearish reaction off the 1st resistance level, leading to a drop towards the 1st support level.
The 1st support level is at 1.1029, characterized as a pullback support, offering a degree of stability for the price. Furthermore, the 2nd support level is found at 1.0847, serving as a multi-swing low support, which can provide a substantial barrier against further price decline.
In terms of resistance, the 1st resistance level is located at 1.1253. It’s recognized as a pullback resistance and coincides with a 61.80% Fibonacci retracement and a 100% Fibonacci projection level, which can present a considerable challenge to any potential bullish movement. If the price manages to overcome this, the 2nd resistance level at 1.1509, acting as an overlap resistance, could be the next significant obstacle.
EUR/JPY:
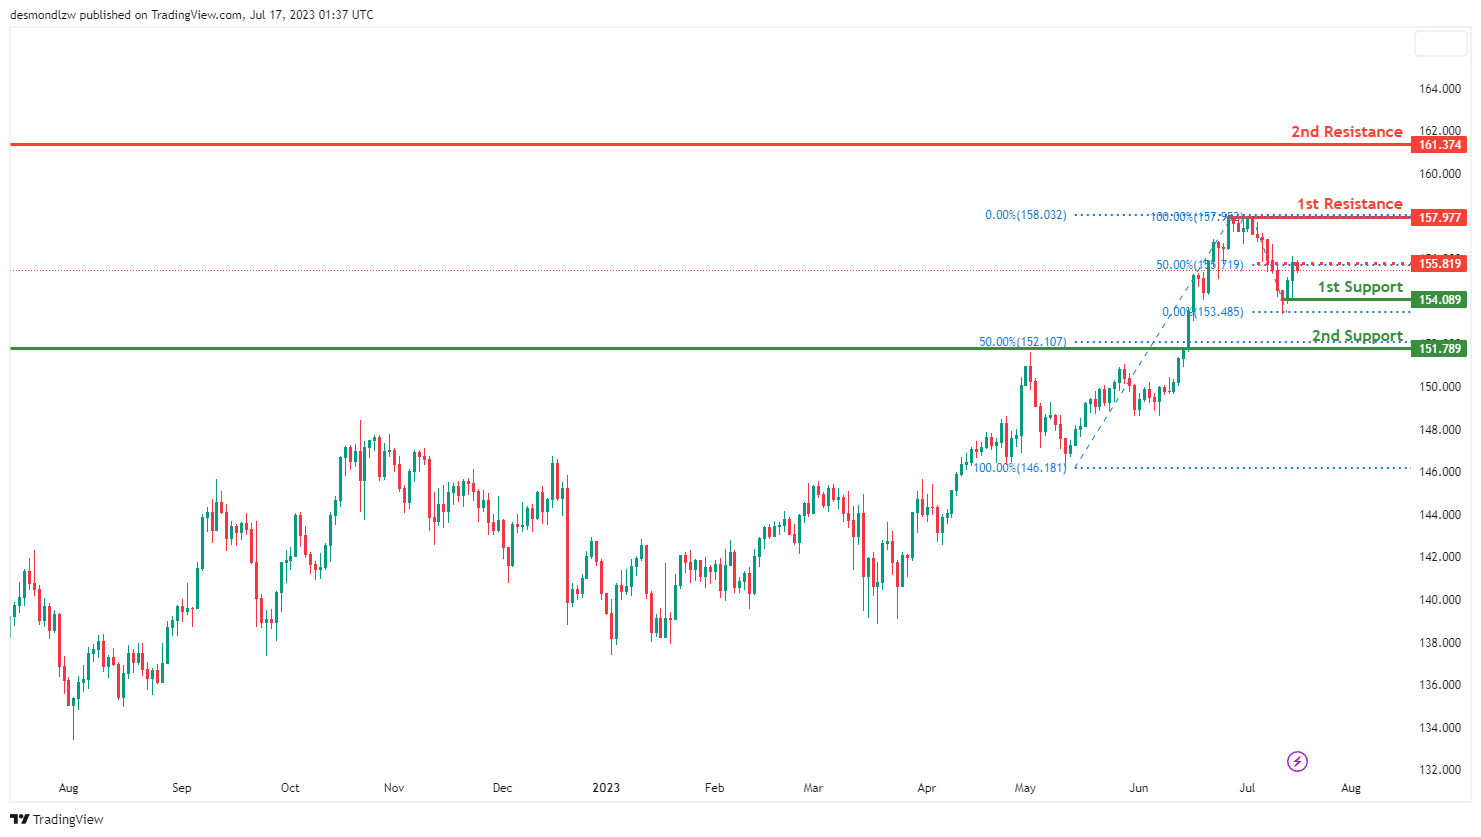
The EUR/JPY pair is presently showing a bearish trend, suggesting a potential continuation of this trend towards the 1st support level.
The 1st support level is at 154.08, serving as a swing low support, which can provide some stability for the price. Further down, the 2nd support level is at 151.78, acting as a pullback support. This level also coincides with a 50% Fibonacci retracement, reinforcing its significance.
On the flip side, the 1st resistance level is at 157.97, characterized as a multi-swing high resistance, which could pose a considerable challenge for any bullish momentum. If the price manages to break this level, the 2nd resistance at 161.37, recognized as a swing high resistance, could be the next significant obstacle.
Additionally, an intermediate resistance level is situated at 155.81. This overlap resistance coincides with a 50% Fibonacci retracement, suggesting that it might provide a meaningful hurdle for further price ascents.
EUR/GBP:
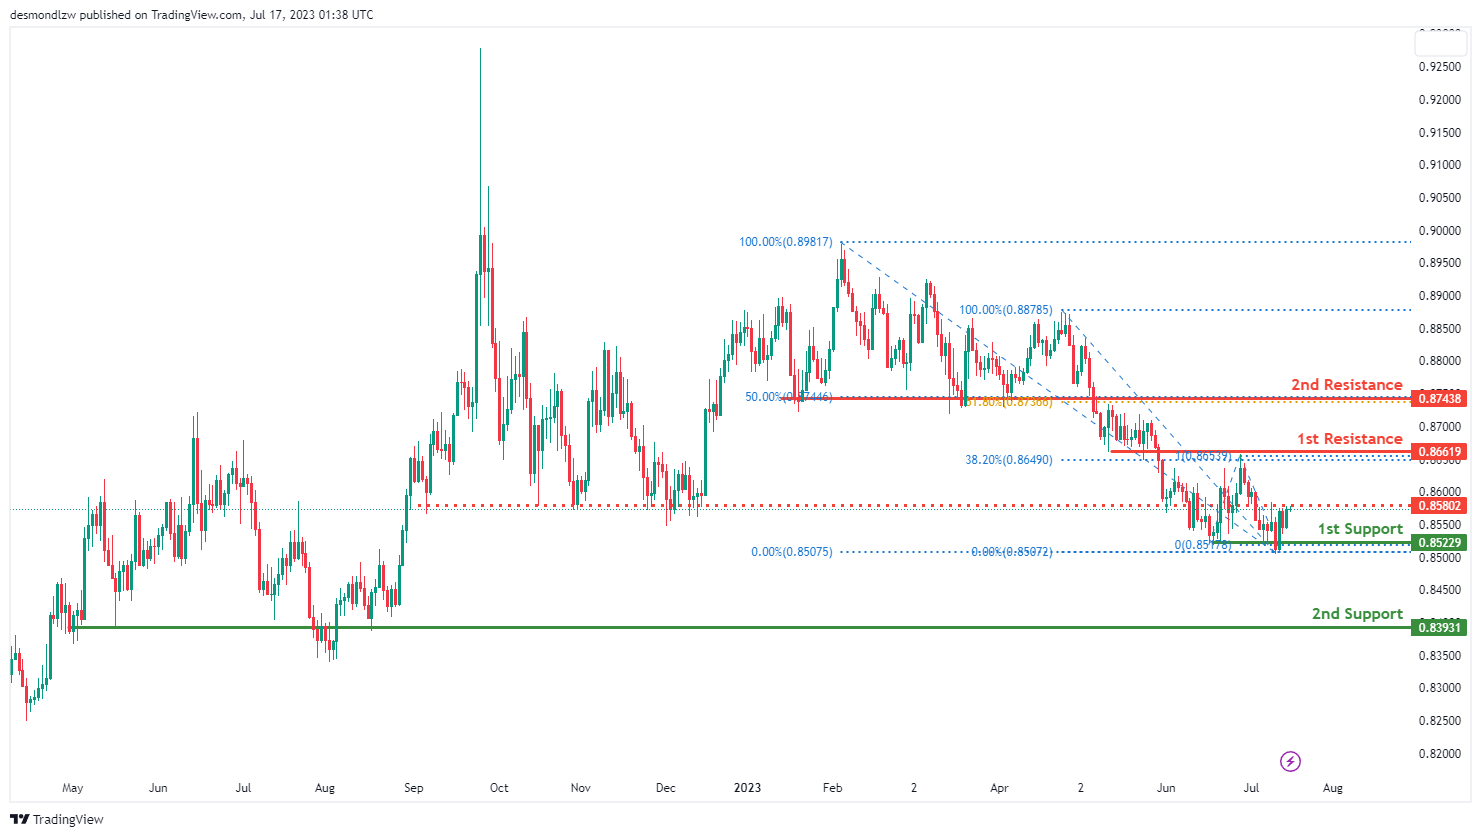
The EUR/GBP pair is currently showing weak bullish momentum with low confidence, suggesting a potential continuation of this trend towards the 1st resistance level.
The 1st support level is at 0.8522, acting as a multi-swing low support, providing a potential cushion for the price. The 2nd support level is at 0.8393, identified as an overlap support, offering additional stability in the event of a price dip.
On the upside, the 1st resistance level is at 0.8661. This overlap resistance also aligns with a 38.20% Fibonacci retracement, strengthening its role as a potential barrier for price increases. If the price breaks through this level, the 2nd resistance at 0.8743, another overlap resistance, could pose the next challenge. This level coincides with both 50% and 61.80% Fibonacci retracement levels, suggesting a significant Fibonacci confluence.
In addition, an intermediate resistance level is identified at 0.8580, which is another overlap resistance that could provide a noteworthy hurdle for further price ascents.
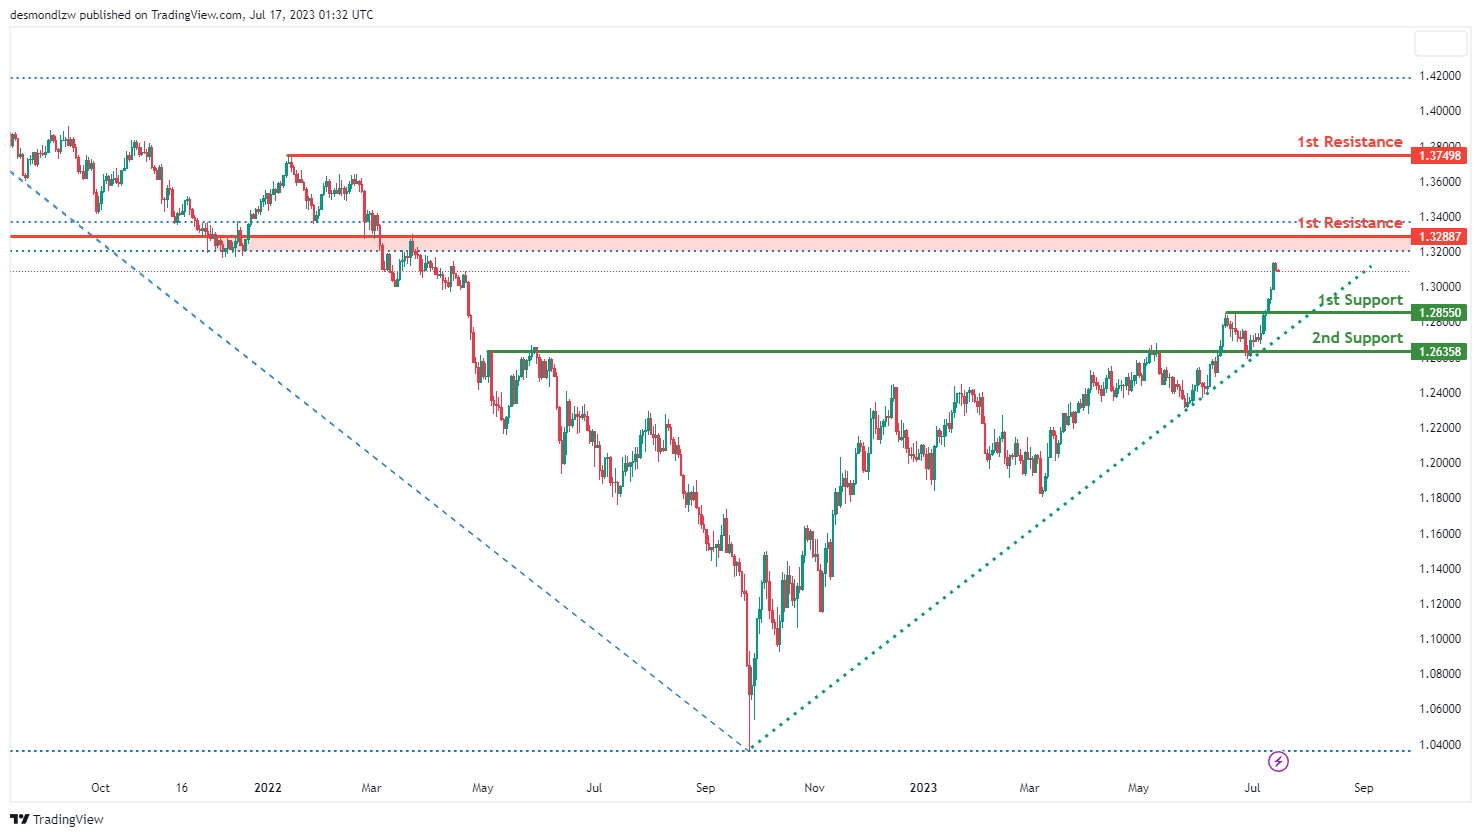
GBP/USD:
The GBP/USD pair currently demonstrates a bullish momentum, supported by the fact that the price is above a major ascending trend line, which implies potential further bullish activity.
However, a bearish reaction off the 1st resistance could lead to a drop towards the 1st support level. The 1st support is located at 1.2855, acting as a pullback support that could help stabilize price levels. If the price breaches this level, the 2nd support is at 1.2635, which serves as an overlap support, providing further assurance in case of a downward price move.
On the flip side, the 1st resistance is found at 1.3288. This overlap resistance also aligns with a 100% Fibonacci projection, adding to its significance as a potential obstacle to price ascension. If the price can surpass this level, the 2nd resistance at 1.3749 could present the next hurdle. This level acts as a swing high resistance, potentially challenging further upward price movements.
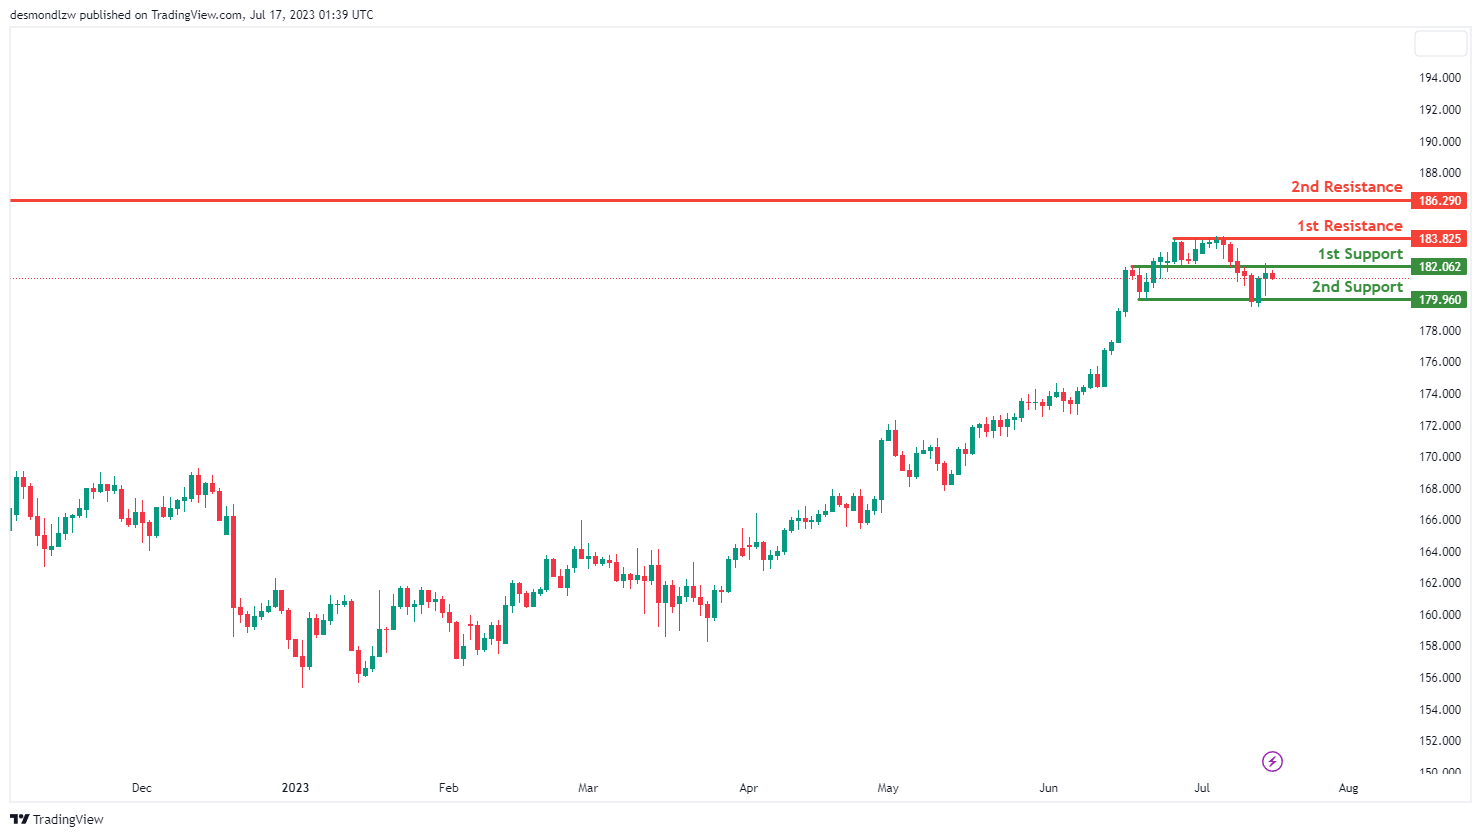
GBP/JPY:
The GBP/JPY pair is currently showing a bearish momentum, and the price could potentially continue to decline towards the 1st support level.
The 1st support level at 182.06 serves as an overlap support, which could provide a significant buffer to downward price movements. If the price breaks through this level, it could fall to the 2nd support level at 179.96, which is a multi-swing low support, providing further assurance against a bearish trajectory.
In the event of a price reversal, the 1st resistance level to challenge the price would be at 183.82, a multi-swing high resistance that might provide a significant challenge to upward price movements. If the price successfully breaks through this level, it could encounter the 2nd resistance level at 186.29, a swing high resistance, potentially posing an obstacle for further price ascension.
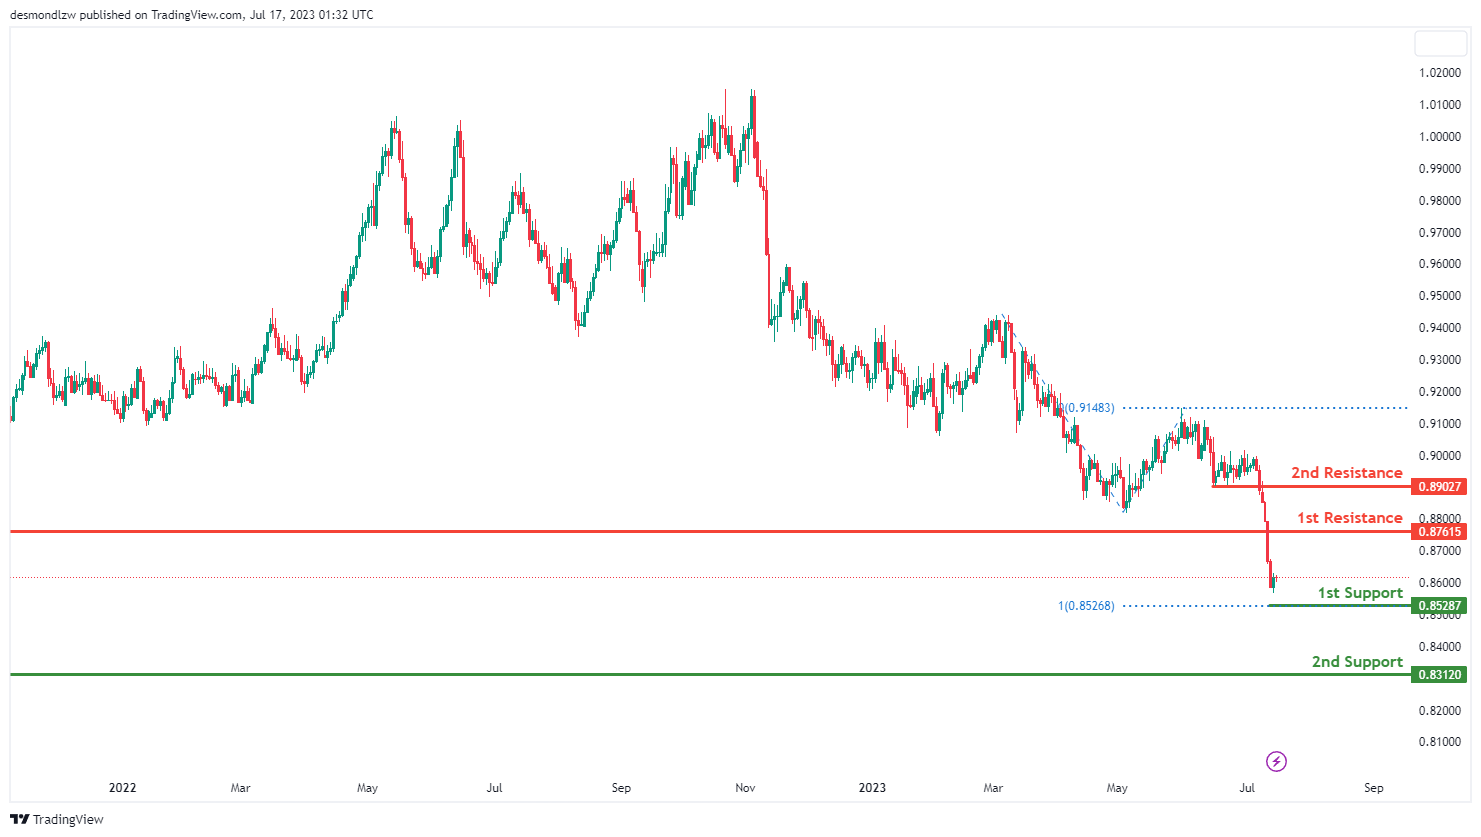
USD/CHF:
The USD/CHF pair is presently showing a bearish momentum, with the expectation of a continuation towards the 1st support level.
The 1st support level, situated at 0.8528, is reinforced by a 100% Fibonacci Projection, making it a significant level for the downward movement of the price. If the price breaches this level, it could fall to the 2nd support level at 0.8312, which is a swing low support and could provide additional support to prevent further price drops.
On the contrary, if the price begins to climb, the 1st resistance at 0.8761, which acts as a pullback resistance, could present a substantial challenge to the price’s upward movement. If the price surpasses this level, the 2nd resistance level at 0.8902, another pullback resistance, could further resist upward price movements.
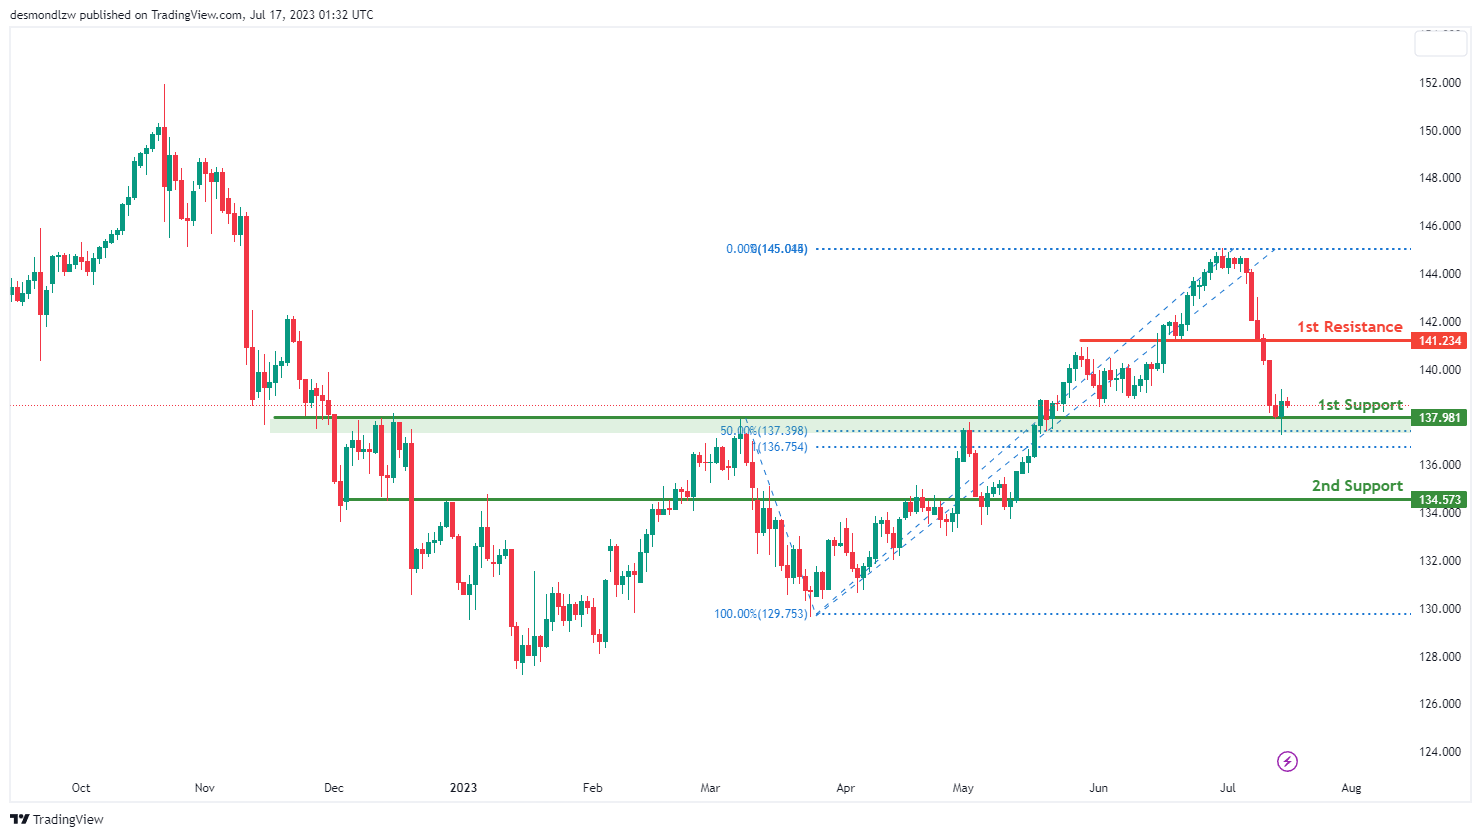
USD/JPY:
The USD/JPY pair is currently showing a bullish momentum, suggesting the possibility of a bounce off the 1st support level and moving towards the 1st resistance.
The 1st support level at 137.98 is underpinned by an overlap support and a 50% Fibonacci Retracement level, offering a strong base for the price’s upward movement. If the price drops below this level, it could find additional support at the 2nd support level of 134.57, which also serves as an overlap support.
On the upward side, the 1st resistance level at 141.23, acting as a pullback resistance, could challenge the price’s upward movement. Should the price successfully breach this level, it would reinforce the existing bullish trend and could pave the way for further gains.
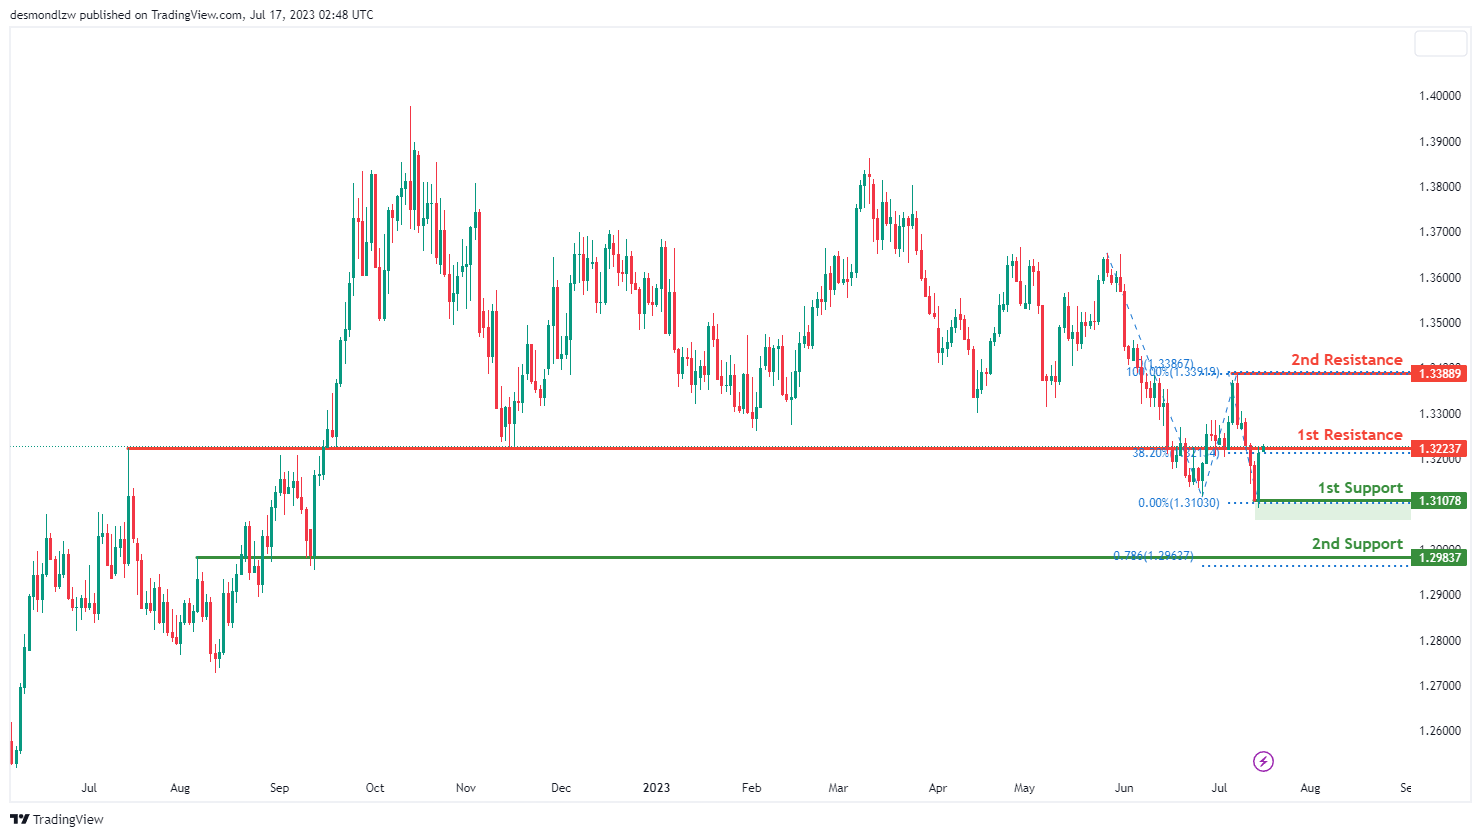
USD/CAD:
The USD/CAD pair is demonstrating a bearish momentum, suggesting the potential for a bearish reaction off the 1st resistance level and a subsequent drop to the 1st support.
The 1st support level at 1.3107, backed by a swing low support, is likely to provide a solid base for the price. Should the price break this level, the 2nd support at 1.2983, strengthened by an overlap support and a 78.60% Fibonacci projection, is likely to provide further support.
In terms of resistance, the 1st level at 1.3223, justified by overlap resistance and a 38.20% Fibonacci retracement, may pose a challenge to the upward movement of the price. If the price surpasses this resistance, it might meet the 2nd resistance level at 1.3388, which is a swing high resistance. This resistance level might be significant in defining the future trend of the pair.
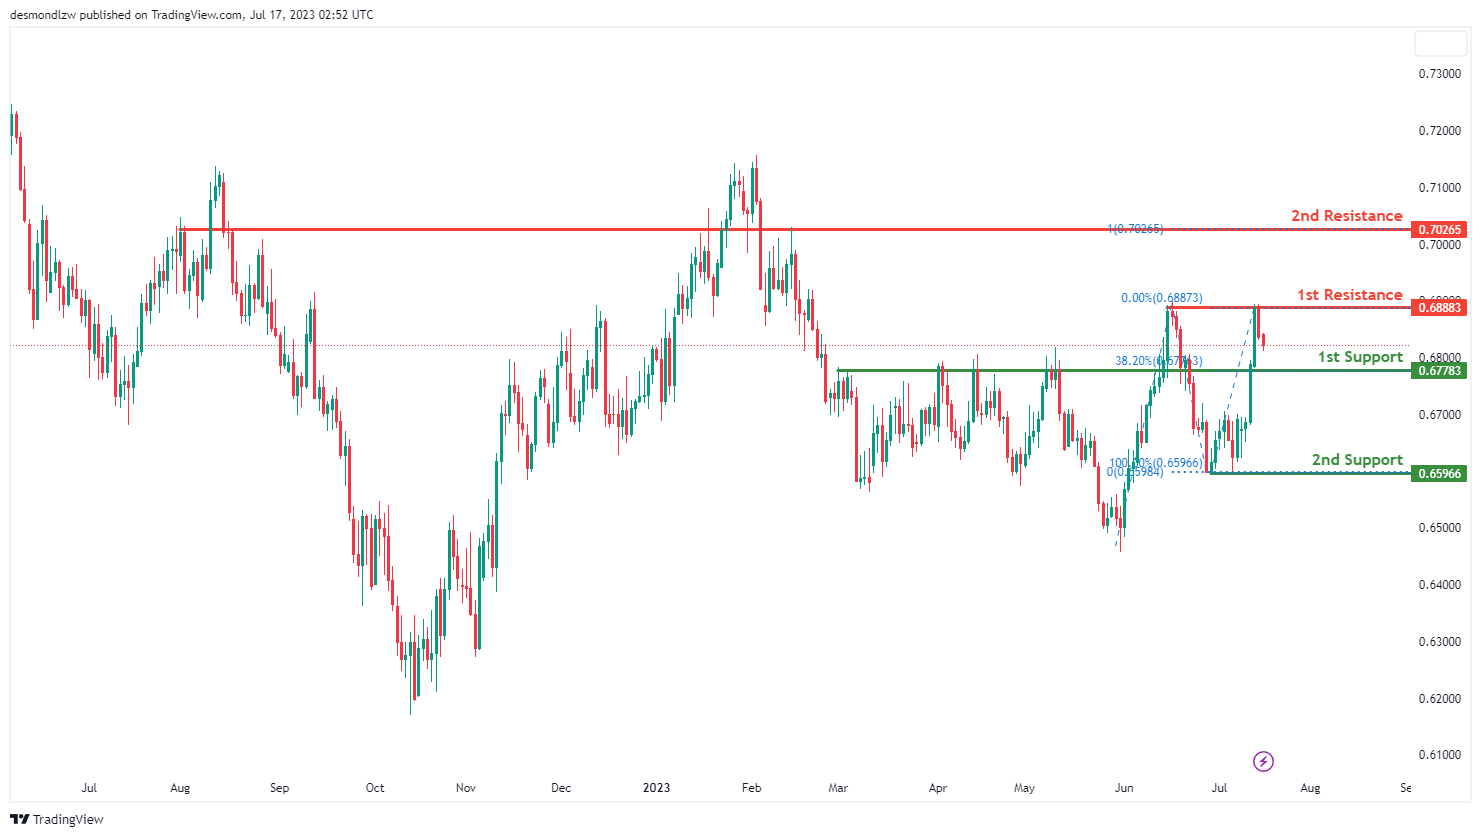
AUD/USD:
The AUD/USD pair is currently demonstrating bearish momentum, which indicates a potential bearish continuation towards the 1st support level.
The 1st support level is at 0.6778, backed by a pullback support and a 38.20% Fibonacci retracement level, which could provide a considerable hold for the price. In case the price breaks below this level, the 2nd support is at 0.6596, which is a multi-swing low support, and may provide further protection against a downward trend.
In terms of resistance, the 1st level at 0.6888 could be a hurdle for any upward price movement. This level is identified by a swing high resistance. Should the price surpass this resistance level, it will encounter the 2nd resistance at 0.7026, defined by an overlap resistance and a 100% Fibonacci projection. This level could significantly affect the future direction of the pair.
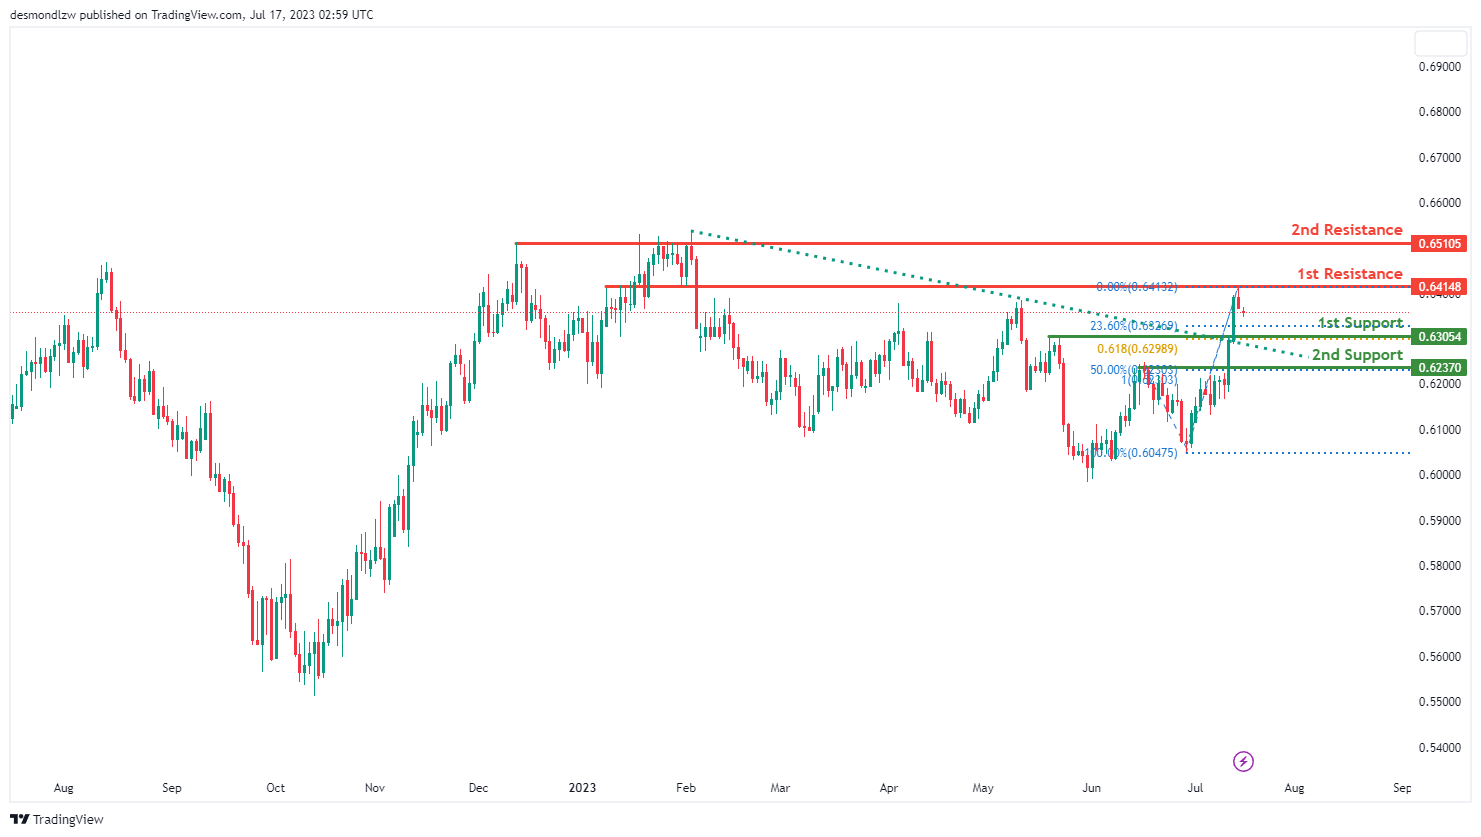
NZD/USD
The NZD/USD pair is currently showing bullish momentum, which might be due to the price breaking above a descending resistance line, indicating a potential bullish move.
Even though the overall trend is bullish, the price could drop to the 1st support level in the short term before bouncing back up and moving towards the 1st resistance. The 1st support at 0.6305 is backed by a pullback support, 23.60% Fibonacci retracement, and a 61.80% Fibonacci projection, indicating a significant Fibonacci confluence. If the price drops below this level, the 2nd support at 0.6237 could provide further protection. This level is also a pullback support and shows a Fibonacci confluence with a 50% Fibonacci retracement and a 100% Fibonacci extension.
If the price bounces back from these support levels, it could encounter resistance at 0.6414, characterized by overlap resistance. Should the price surpass this level, the next resistance at 0.6510 could pose a challenge. This level represents a multi-swing high resistance and could significantly influence the future direction of the pair.
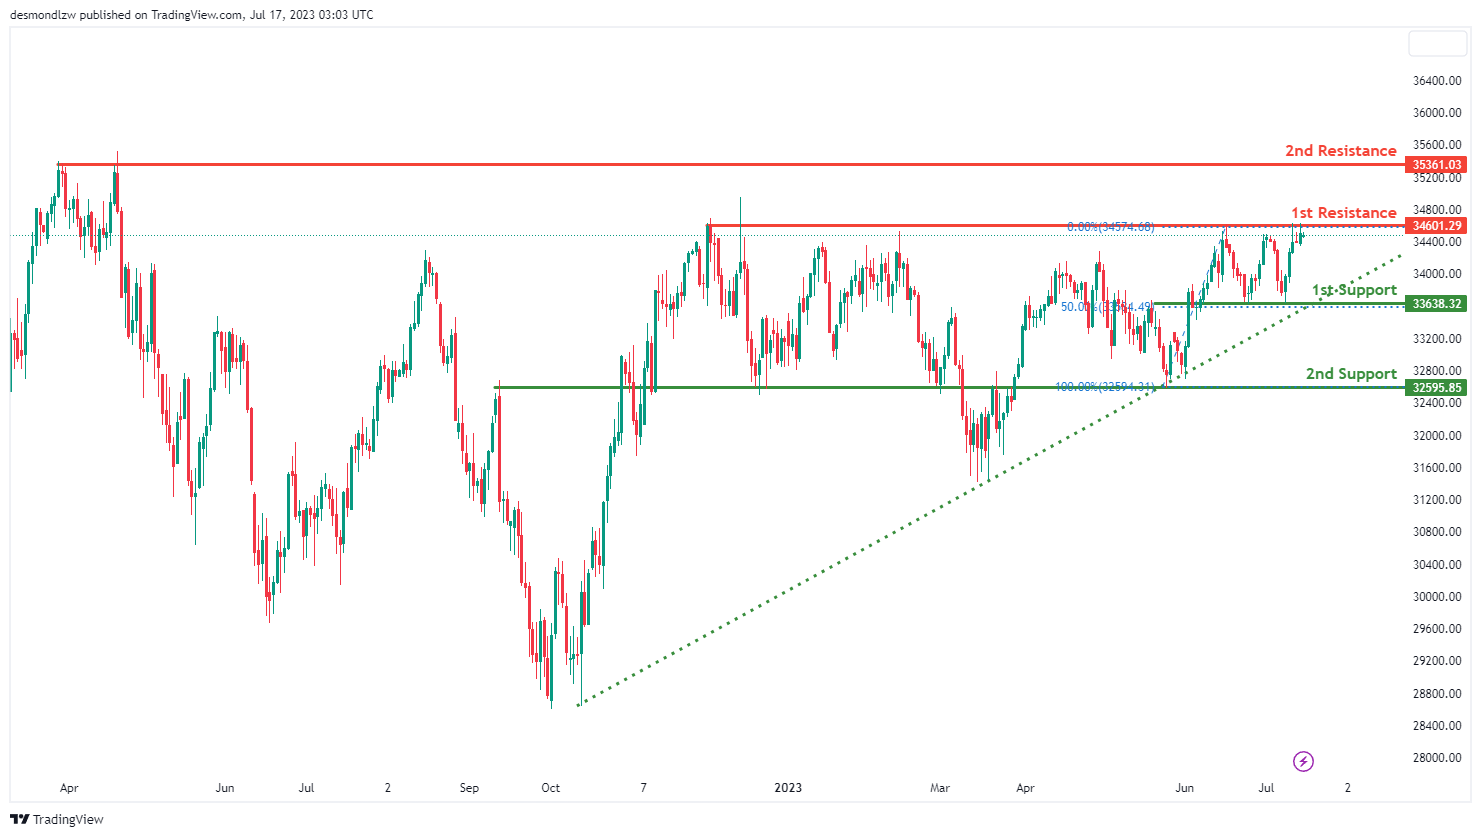
DJ30:
The DJ30, or Dow Jones Industrial Average, is currently showing bullish momentum. The price is above a significant ascending trend line, suggesting that further bullish momentum could be in the cards.
However, the price could potentially make a bearish reaction off the 1st resistance and drop to the 1st support. The 1st support level at 33638.32 is solidified by an overlap support and a 50% Fibonacci retracement. Should the price dip below this level, the 2nd support at 32595.85, backed by overlap support, could offer additional safeguard.
On the upside, the 1st resistance is at 34601.29, characterized by a multi-swing high resistance. If the price manages to break this level, it could encounter resistance at 35361.03, another multi-swing high resistance. These resistance levels could play a crucial role in determining the future trajectory of the DJ30.
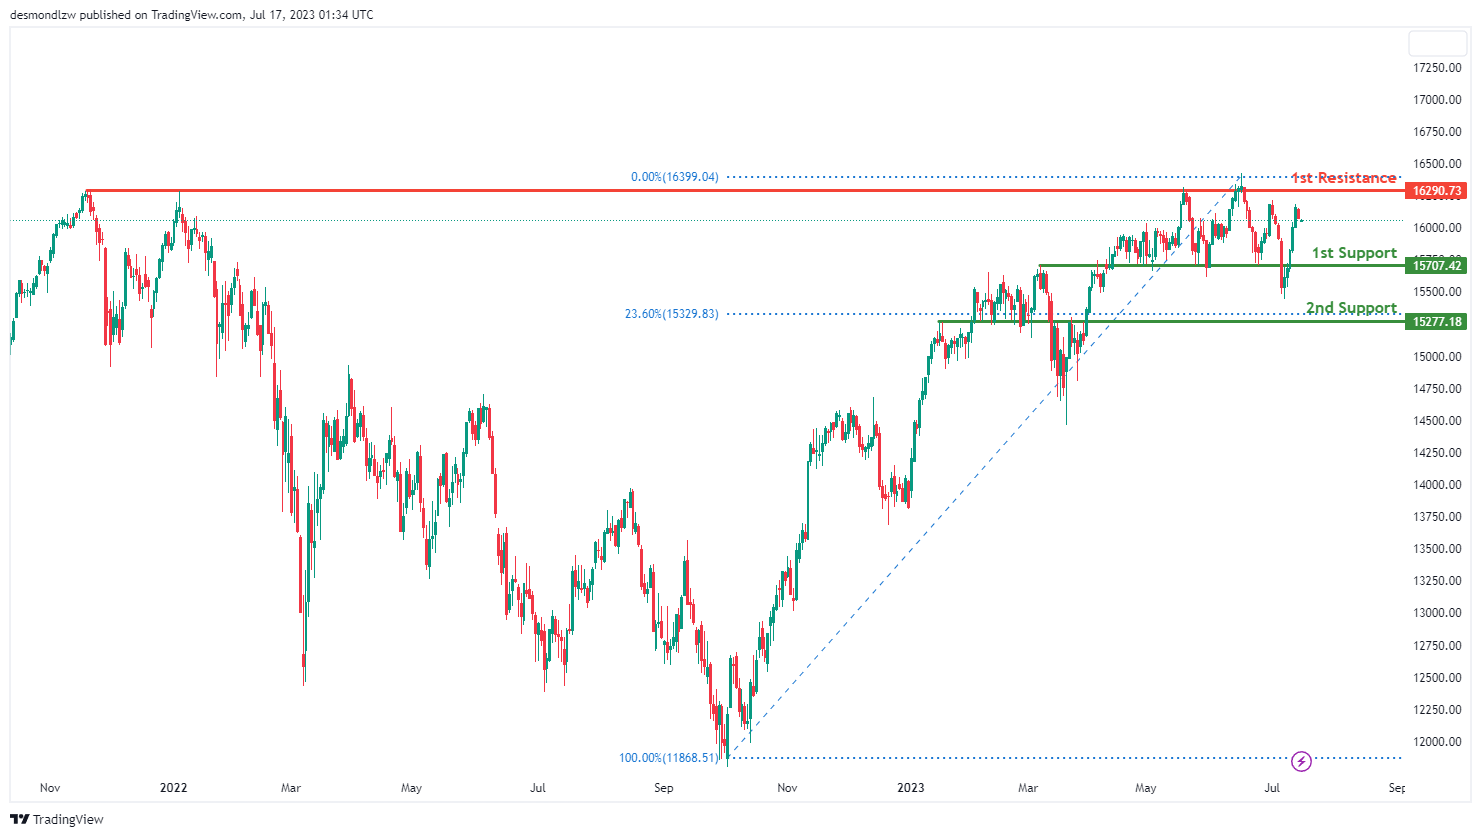
GER30:
The GER30, or DAX 30, currently displays a bearish momentum. The price could potentially continue its bearish trend towards the 1st support level.
The 1st support level is at 15707.42, which has been established as a pullback support. If this level fails to hold, the price could fall towards the 2nd support level at 15277.18, backed by pullback support and a 23.60% Fibonacci retracement. These two support levels could provide key areas of interest for potential rebounds.
On the other hand, if the price reverses its bearish course, it could face resistance at the 16290.73 level, defined by multi-swing high resistance. This level may act as a critical point for the future trajectory of GER30. Should the price break above this resistance, it could suggest a potential change in the current bearish trend.
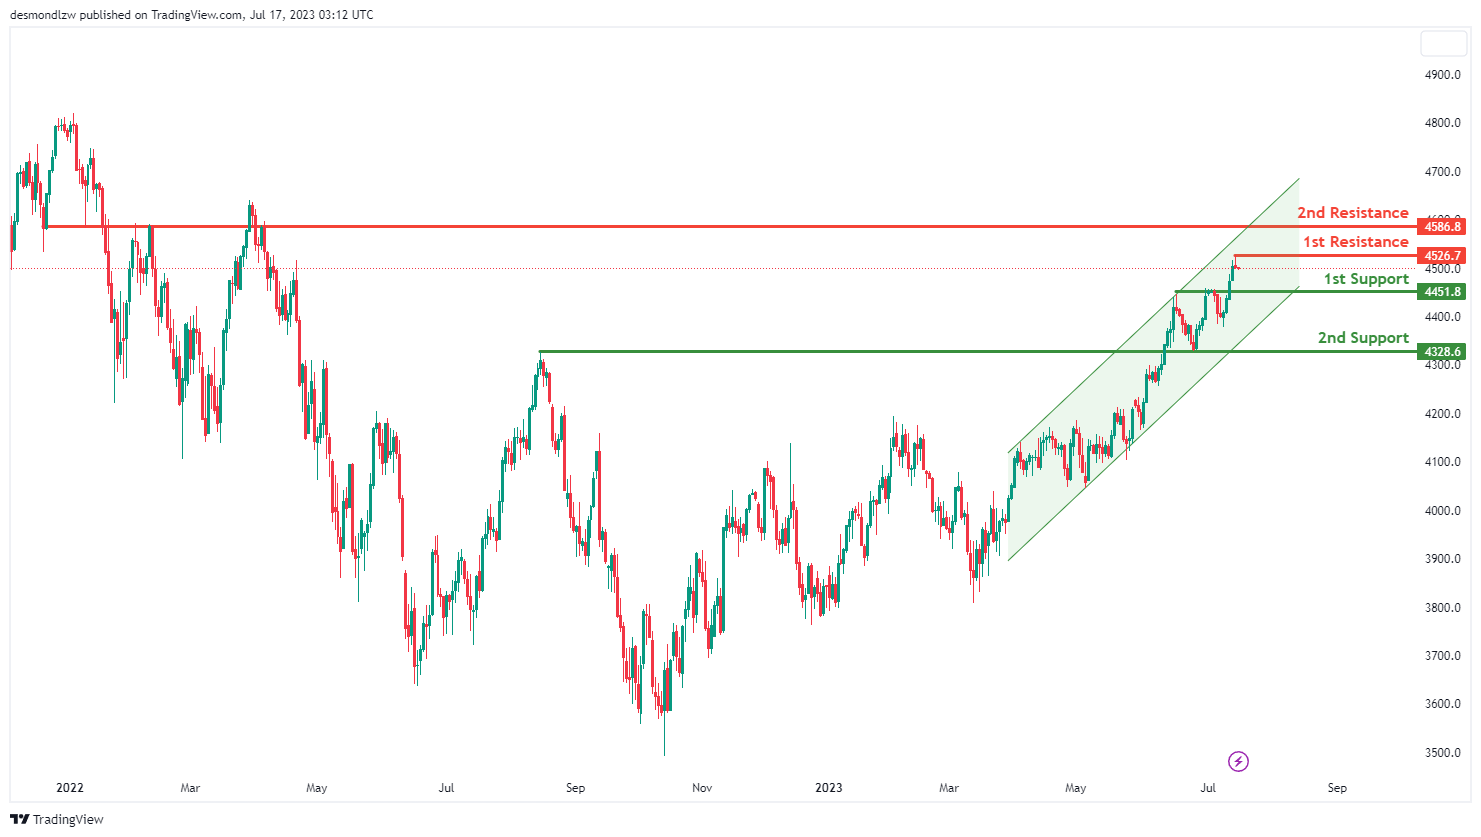
US500
The US500, also known as the S&P 500, is currently showing bearish momentum despite being in a bullish ascending channel. This suggests that the price could experience a bearish reaction at the 1st resistance level and drop to the 1st support level, before bouncing off this support level to continue the bullish trend.
The 1st support level is at 4451.80 and is recognized as a pullback support. If the price fails to hold at this level, it could fall towards the 2nd support level at 4328.60, which is backed by overlap support. These support levels represent critical zones where buying interest could potentially outweigh selling interest, leading to a possible rebound in the price.
Conversely, if the price reverses its bearish course, it could face resistance at 4526.70, a level identified as a swing high resistance. If it continues to rise, it could face further resistance at 4586.80, which is also considered an overlap resistance. These resistance levels may act as barriers to price progress and could trigger a selling response.
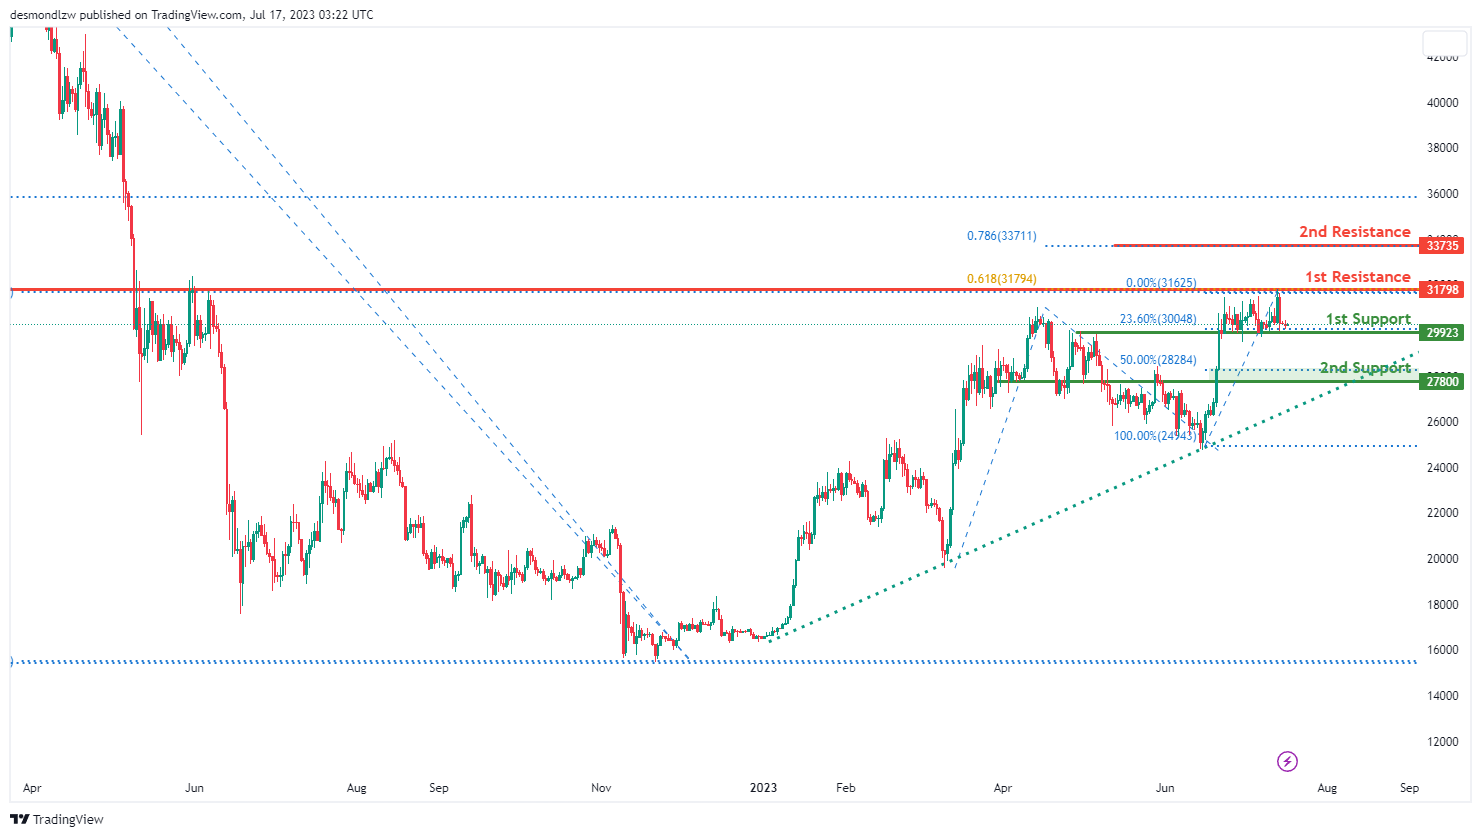
BTC/USD:
For the BTC/USD instrument, the overall momentum of the chart is currently neutral, which suggests that the price could potentially fluctuate between the 1st resistance and 1st support level.
The 1st support level is at 29923, identified by overlap support and a 23.60% Fibonacci retracement. If this support level fails to hold, the price could potentially drop to the 2nd support level at 27800, which is recognized as a pullback support and is also at the 50% Fibonacci retracement level. These support levels are critical areas where buying interest could outweigh selling pressure and lead to a price rebound.
On the other hand, if the price starts to rise, it could face resistance at 31798. This level is identified as an overlap resistance and a 61.80% Fibonacci projection. Further above, the 2nd resistance level is at 33735, which could also act as a strong barrier for upward price movement and potentially trigger a selling response.
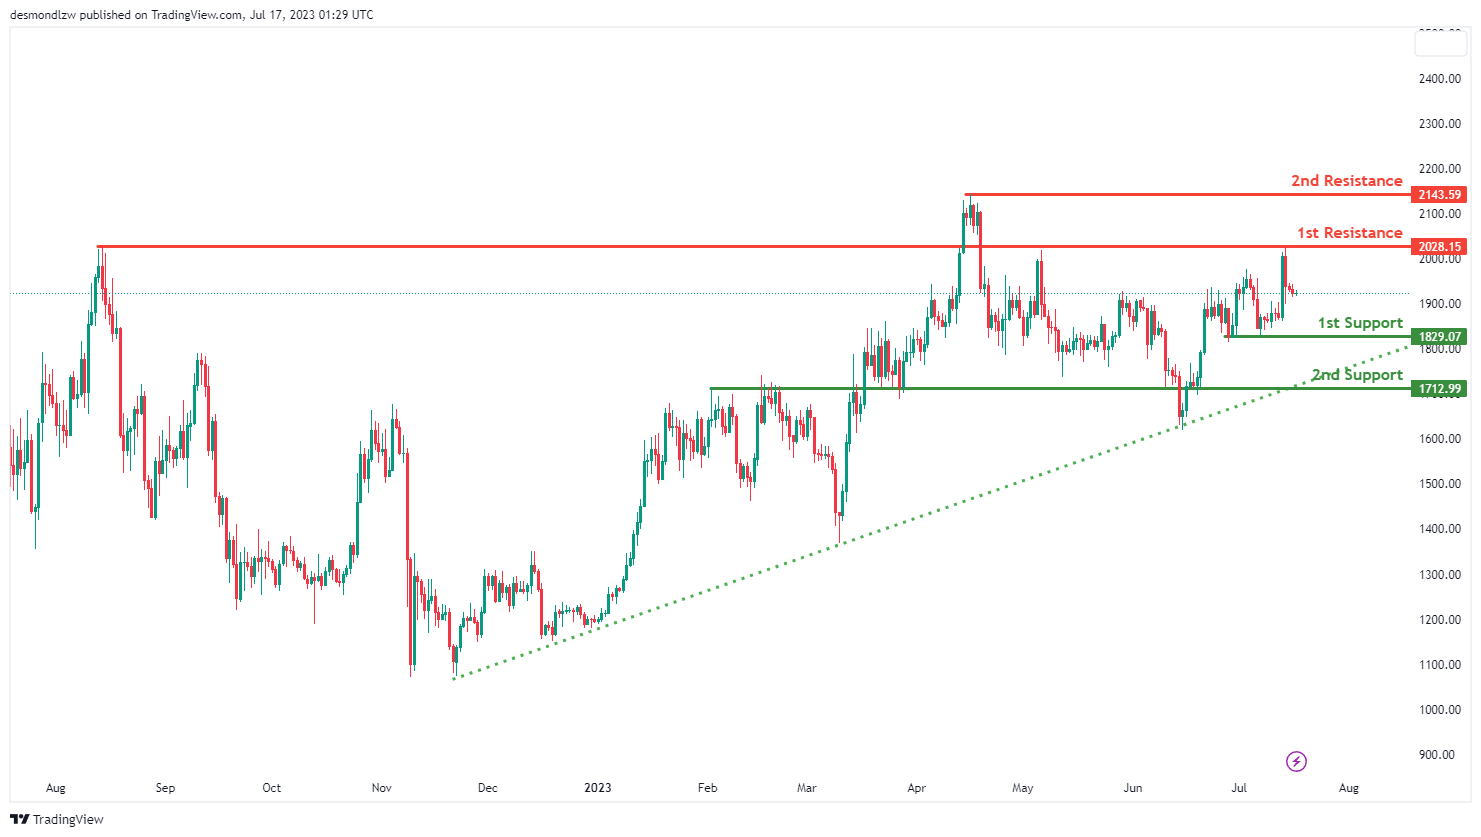
ETH/USD:
For the ETH/USD instrument, the overall momentum of the chart is currently neutral, which suggests that the price could potentially fluctuate between the 1st resistance and the 1st support level.
The 1st support level is at 1829.07, identified by a multi-swing low support. If this support level fails to hold, the price could potentially drop to the 2nd support level at 1712.99, which is recognized as an overlap support. These support levels are critical areas where buying interest could outweigh selling pressure and lead to a price rebound.
On the other hand, if the price starts to rise, it could face resistance at 2028.15. This level is identified as an overlap resistance. Further above, the 2nd resistance level is at 2143.59, which could also act as a strong barrier for upward price movement and potentially trigger a selling response.
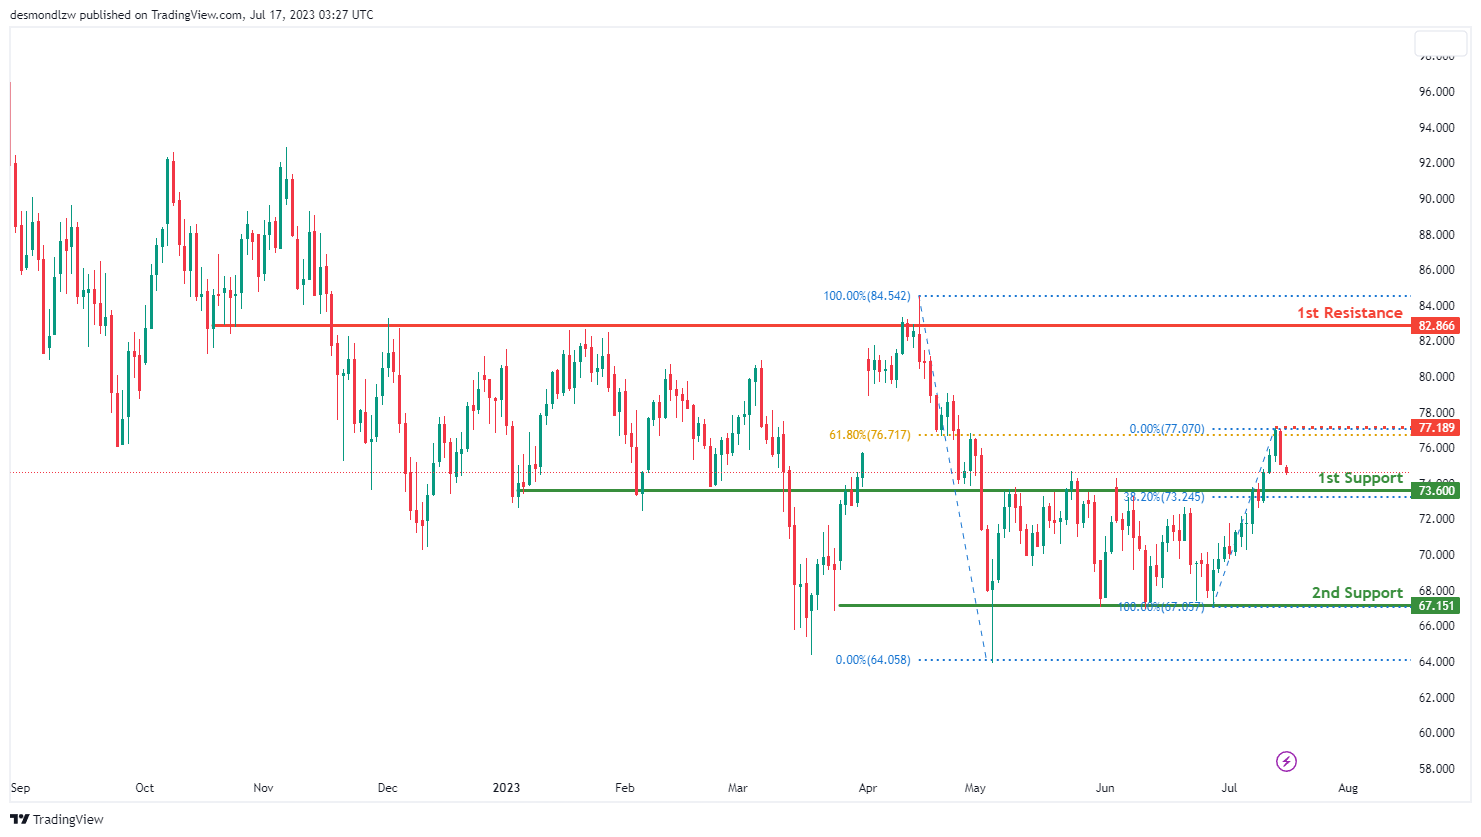
WTI/USD:
For the WTI instrument, the overall momentum of the chart is bearish. This suggests that the price could potentially continue its downward trend towards the 1st support level.
The 1st support level is located at 73.60, which is identified as a pullback support and aligns with the 38.20% Fibonacci retracement level. If the price fails to maintain this level, it could further descend to the 2nd support level at 67.15, characterized by a multi-swing low support. These support levels mark crucial zones where the buying interest might potentially overcome the selling pressure, leading to a possible price reversal.
On the contrary, if the price starts to climb, it could face resistance at 82.86, an overlap resistance. Furthermore, there’s an intermediate resistance level at 77.18, identified as a swing high resistance and corresponding to the 61.80% Fibonacci retracement level. These resistance levels could act as significant barriers for upward price movement and might instigate a selling response.
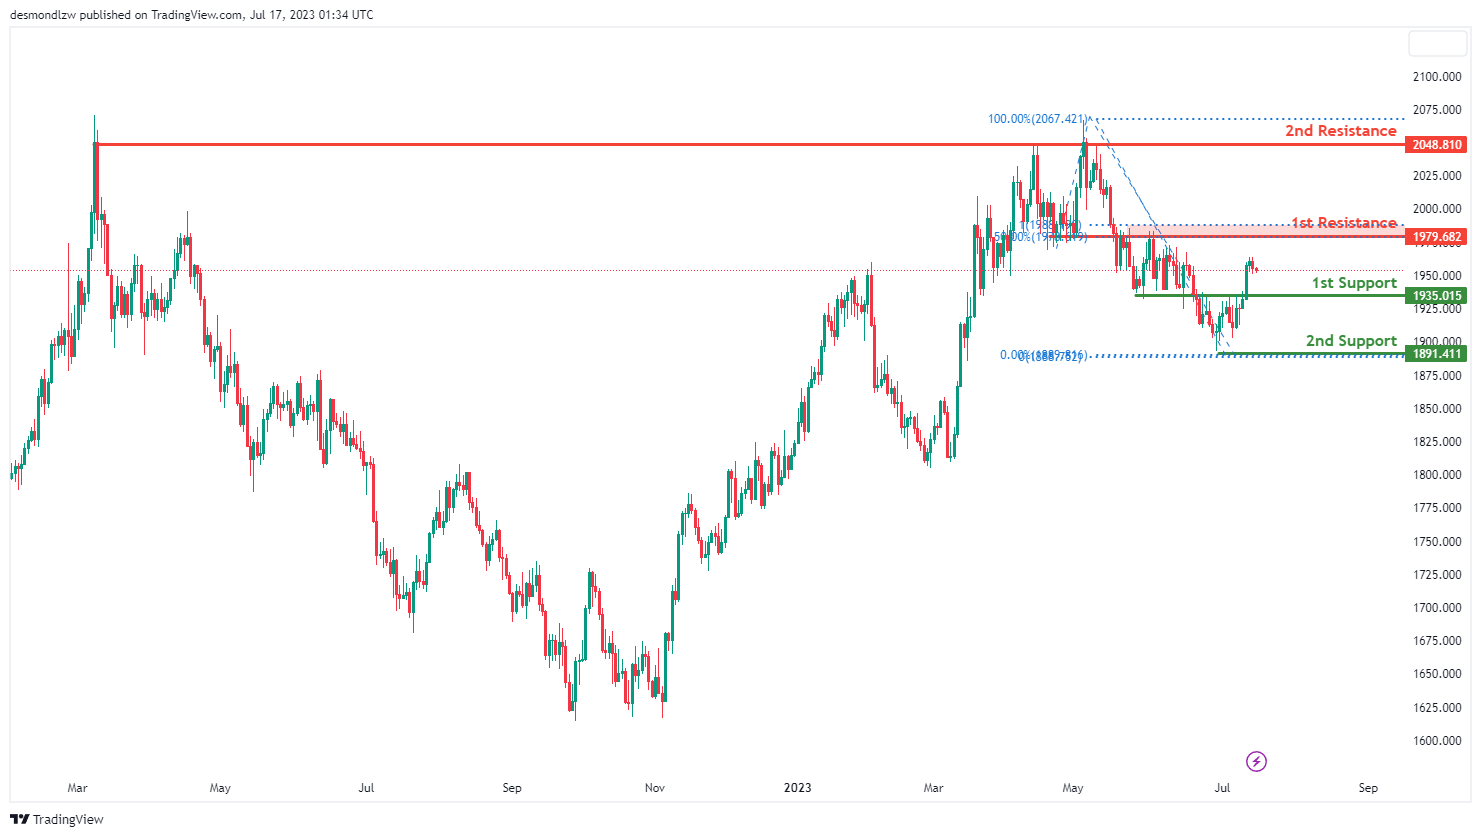
XAU/USD (GOLD):
For the XAUUSD instrument, the overall momentum of the chart is bearish. This suggests that the price could potentially continue its downward trend towards the 1st support level.
The 1st support level is situated at 1935.01, defined as a pullback support. If the price breaks this level, it could further descend to the 2nd support level at 1891.41, which is characterized by a swing low support. These support levels mark significant zones where buying interest might potentially outweigh the selling pressure, leading to a potential price rebound.
On the other hand, if the price begins to ascend, it could face resistance at 1979.68, identified as an overlap resistance. This resistance level corresponds to the 50% Fibonacci retracement level and 100% Fibonacci projection, indicating Fibonacci confluence. Further above, the 2nd resistance level is at 2048.81, defined by a multi-swing high resistance. These resistance levels might act as significant barriers for upward price movement and could trigger a selling response.


