
DXY:
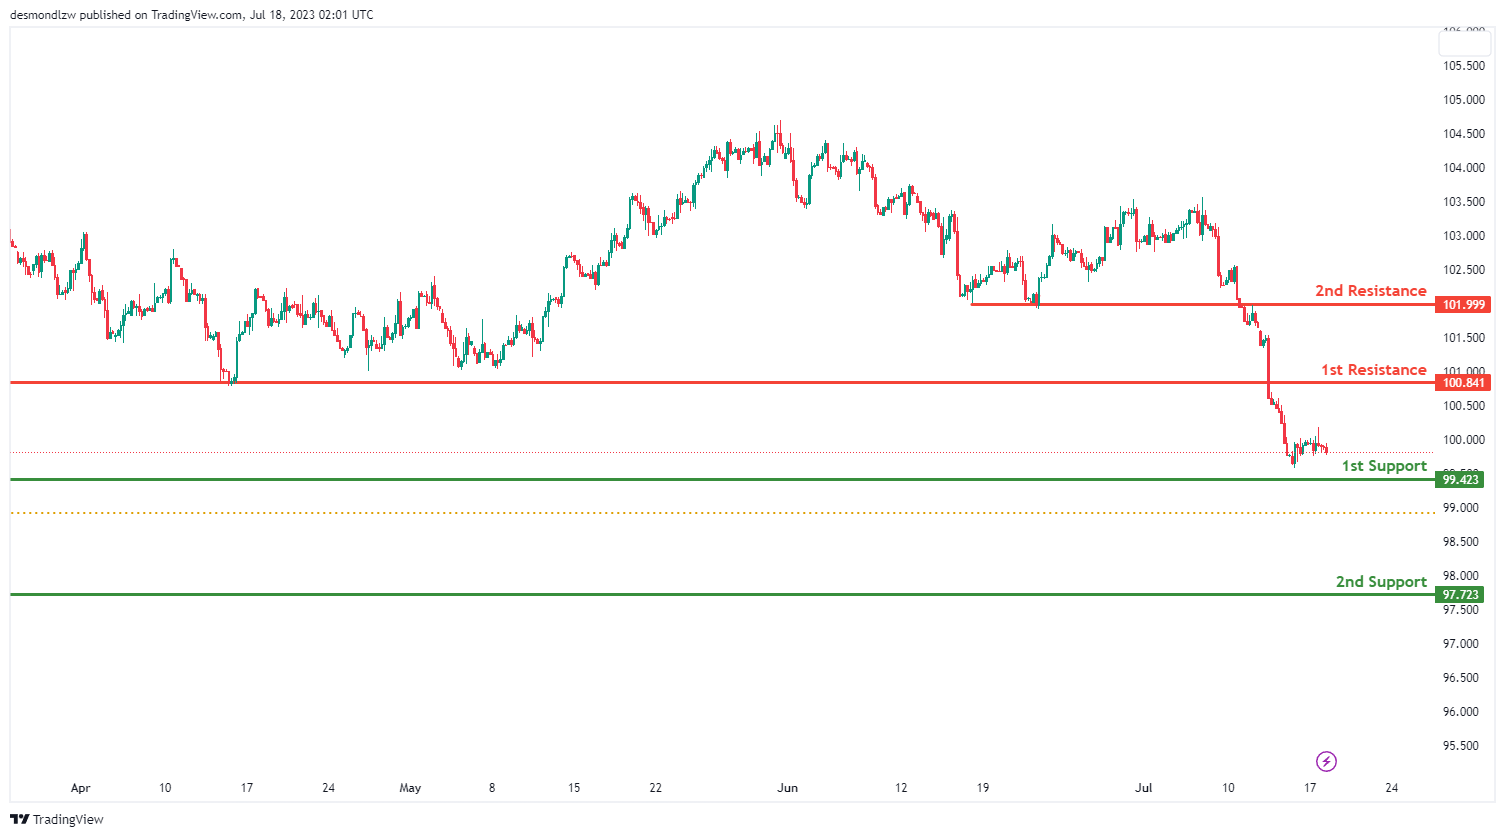
The DXY (US Dollar Index) chart is currently showing a bearish momentum This suggests that the price could potentially continue to descend towards the 1st support level.
The 1st support level is found at 99.42, which is recognized as an overlap support. Should the price break this level, it could continue its bearish trajectory towards the 2nd support level at 97.72, also characterized as an overlap support. These support levels mark important areas where buying interest might outweigh selling pressure, leading to a potential price rebound.
On the other hand, if the price begins to rise, it could face resistance at 100.84, identified as pullback resistance. Further above, the 2nd resistance level is at 101.99, also recognized as an overlap resistance. These resistance levels might act as obstacles to upward price movements and could stimulate a selling response.
EUR/USD:
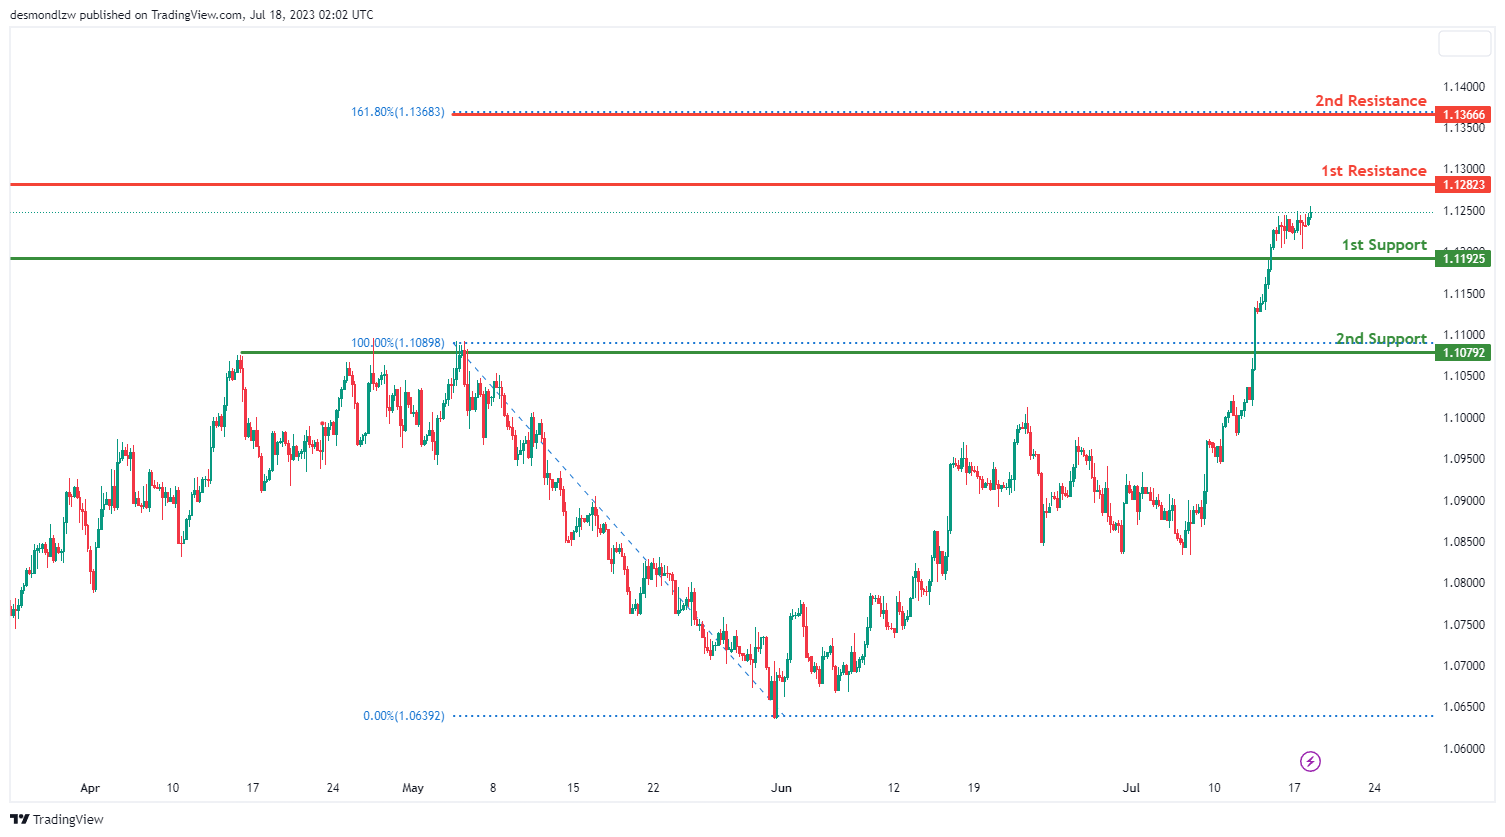
For the EUR/USD instrument, the overall momentum of the chart is bullish. This suggests that the price could potentially continue its upward movement towards the 1st resistance level.
The 1st support level is identified at 1.1192, characterized as a pullback support. If the price retreats, this level could provide a bounce back point. A further drop could lead the price towards the 2nd support level at 1.1079, also classified as pullback support. These support levels mark critical areas where buying interest may outstrip selling pressure, leading to a potential rise in price.
On the other hand, if the price continues its bullish trajectory, it could meet resistance at 1.1282, identified as an overlap resistance. If the price breaks this level, the next hurdle could be the 2nd resistance level at 1.1366. This level corresponds to the 161.80% Fibonacci extension, making it a significant potential turning point. These resistance levels might act as barriers to the price’s upward movement and could stimulate a selling response.
EUR/JPY:
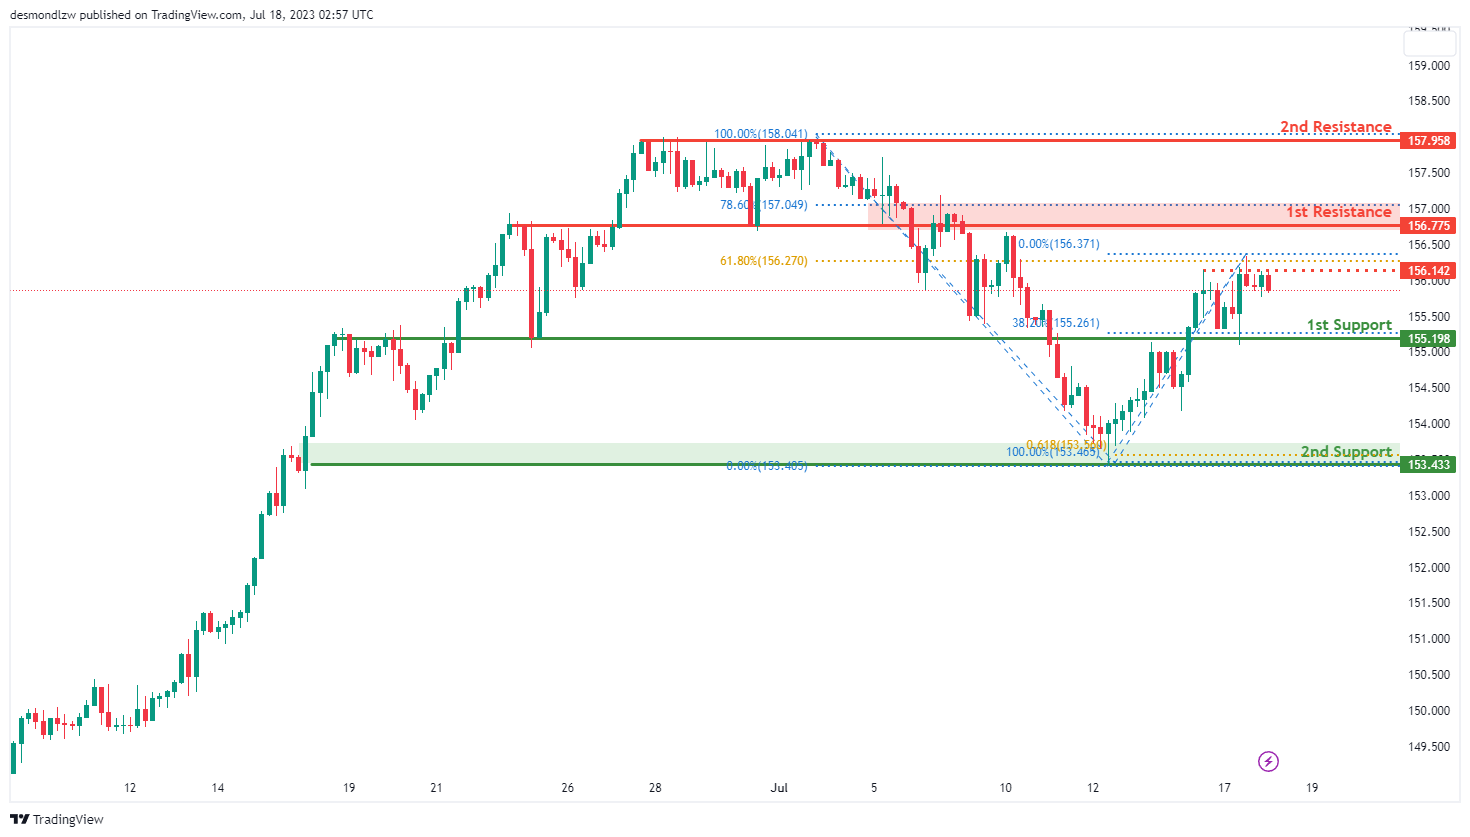
The EUR/JPY instrument is currently showing a bullish overall momentum. Based on the chart analysis, there is a potential for the price to drop further to the first support level in the short term before bouncing from there and rising towards the first resistance.
The first support level at 155.19 is considered good as it provides pullback support and coincides with the 38.20% Fibonacci retracement level. Additionally, the second support at 153.43 is identified as swing low support and aligns with the 61.80% Fibonacci projection level.
On the upside, the first resistance level at 156.77 is seen as an overlap resistance and corresponds to the 78.60% Fibonacci retracement level. The second resistance at 157.95 is identified as a multi-swing high resistance.
Furthermore, an intermediate resistance level at 156.14 is noteworthy as it aligns with the 61.80% Fibonacci retracement level.
EUR/GBP:
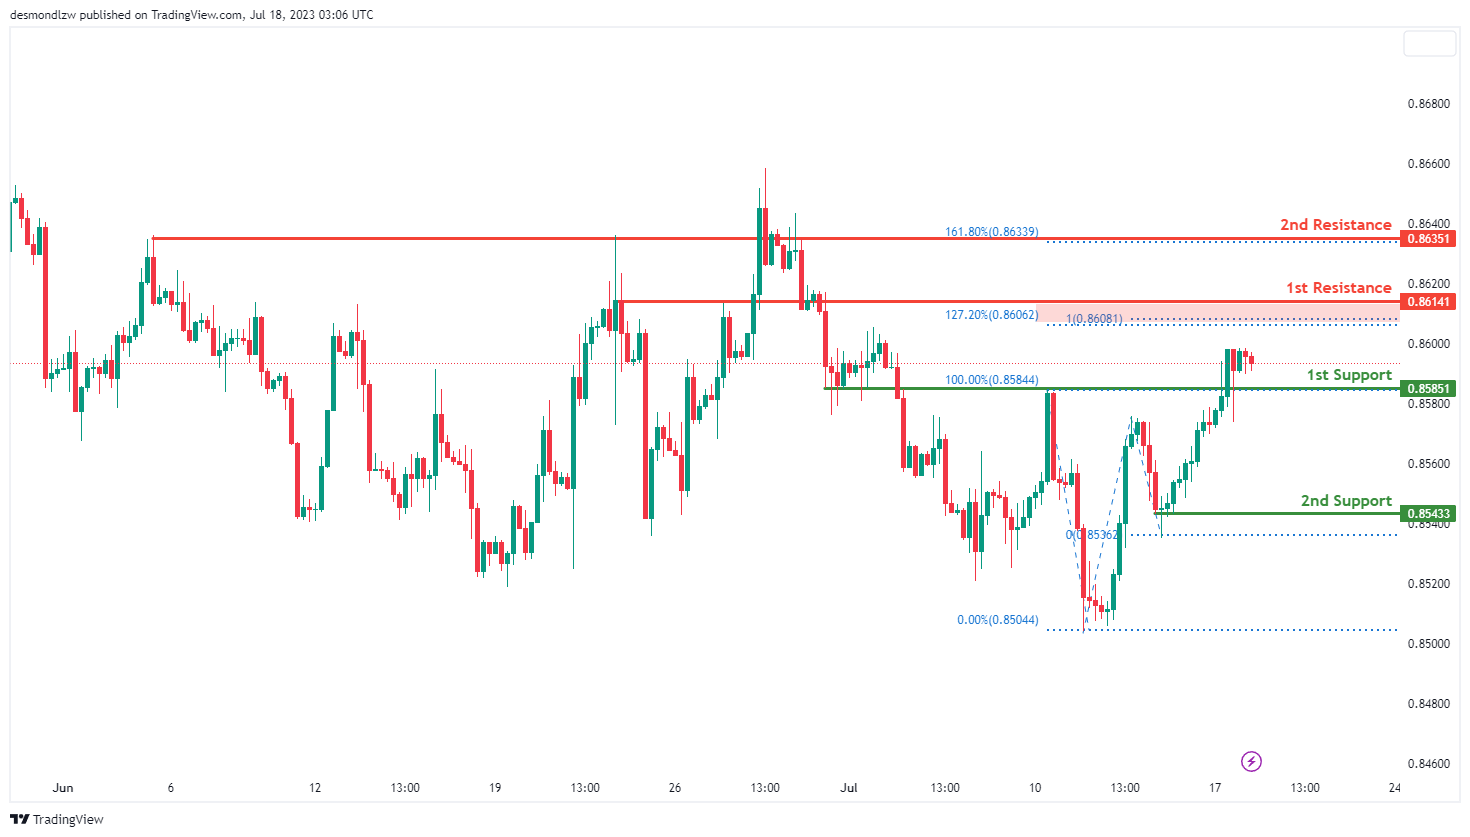
The EUR/GBP instrument is currently demonstrating a bullish overall momentum. Based on the chart analysis, there is a potential for the price to drop further to the first support level in the short term before bouncing from there and rising towards the first resistance.
The first support level at 0.8585 is considered good as it provides pullback support. Additionally, the second support at 0.8543 is identified as swing low support.
On the upside, the first resistance level at 0.8614 is seen as an overlap resistance, and it also aligns with the 127.20% Fibonacci extension and 100% Fibonacci projection levels. The second resistance at 0.8635 is identified as an overlap resistance.
GBP/USD:
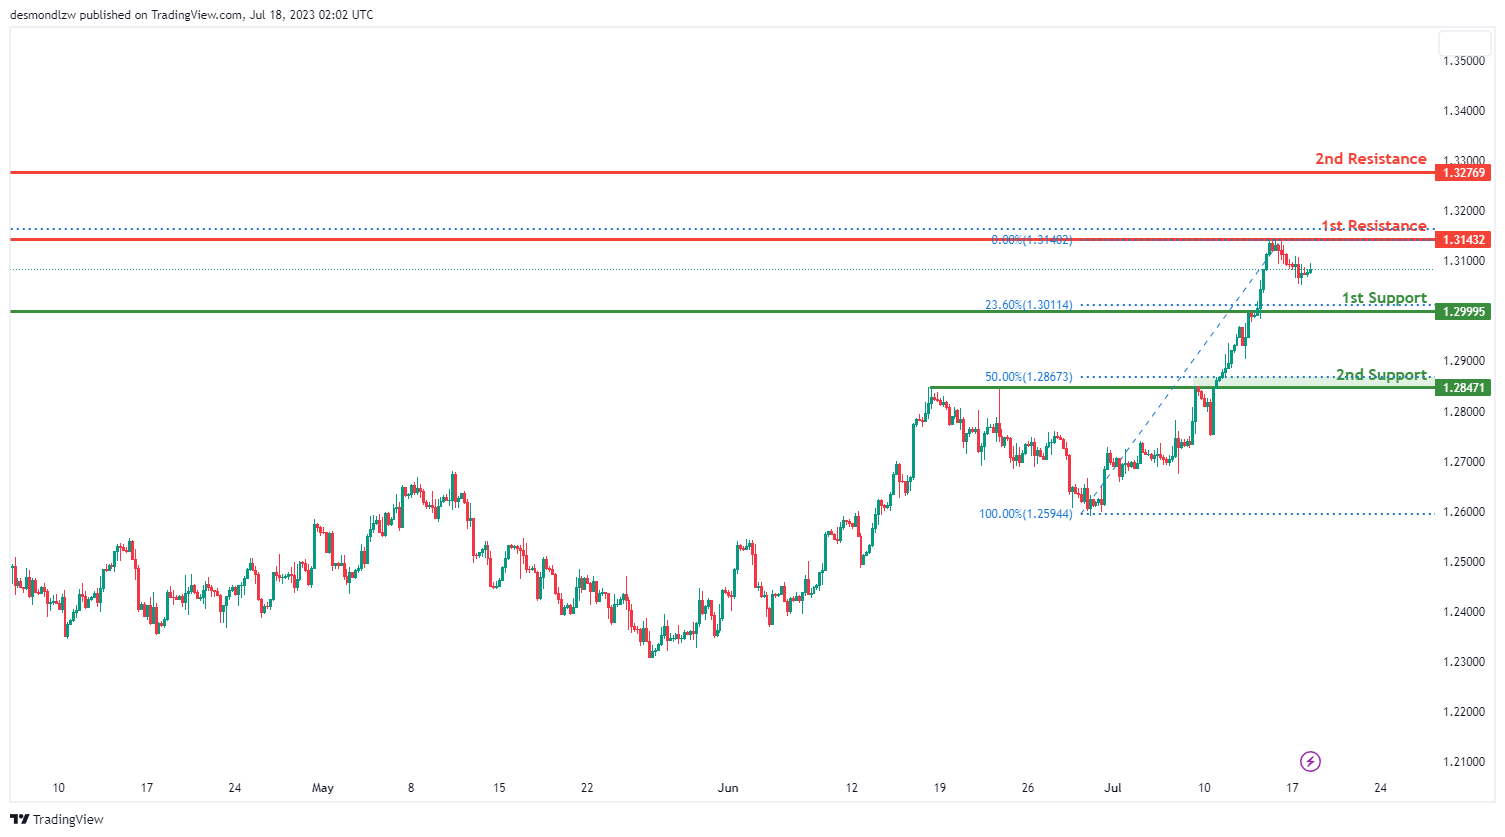
The GBP/USD instrument currently exhibits a bullish momentum, implying that the price could continue its upward trajectory towards the 1st resistance level.
The 1st support level is situated at 1.2999, recognized as a pullback support and also aligns with the 23.60% Fibonacci retracement level. Should the price retreat, this level might provide a rebound point. A further decline could lead the price towards the 2nd support level at 1.2847, which is also considered as pullback support and matches with the 50% Fibonacci retracement level. These support zones are important areas where buying pressure may overpower selling pressure, potentially causing a price increase.
On the flip side, if the price continues its bullish run, it may encounter resistance at 1.3143, identified as a multi-swing high resistance. If the price surpasses this level, the next obstacle could be the 2nd resistance level at 1.3276, distinguished as an overlap resistance. These resistance levels could act as barriers to the price’s advancement and may trigger a selling reaction.
GBP/JPY:
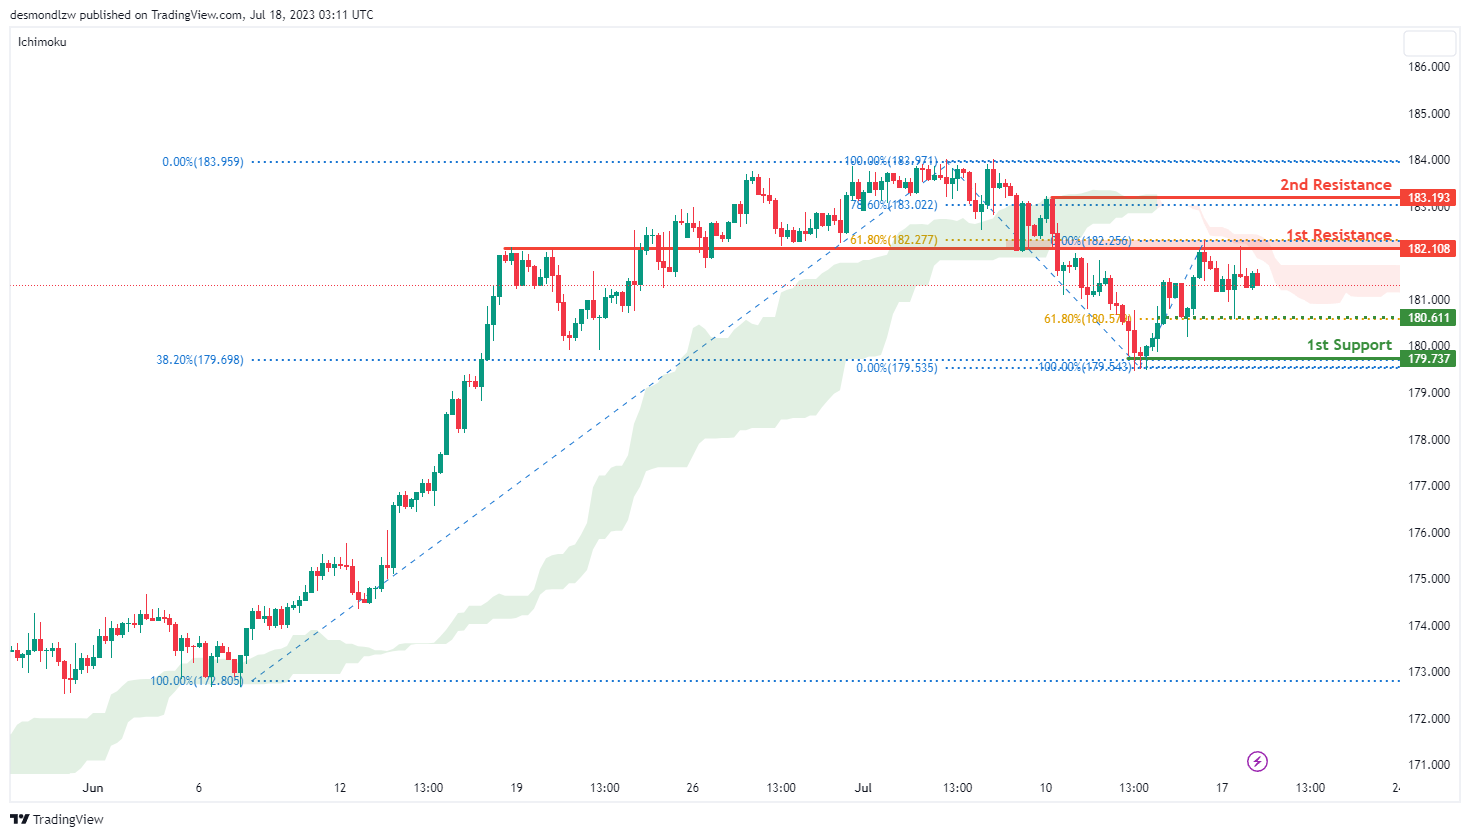
The GBP/JPY instrument is currently experiencing a bearish momentum, and one of the factors contributing to this momentum is that the price is below the bearish Ichimoku cloud. Based on the chart analysis, there is a potential for a bearish continuation towards the first support level.
The first support level at 179.73 is considered good as it provides pullback support and aligns with the 38.20% Fibonacci retracement level. Additionally, the intermediate support at 180.61 is identified as a level that corresponds to the 61.80% Fibonacci retracement.
On the upside, the first resistance level at 182.10 is seen as an overlap resistance and is associated with the 61.80% Fibonacci retracement. The second resistance at 183.19 is identified as a swing high resistance and corresponds to the 78.60% Fibonacci retracement.
USD/CHF:
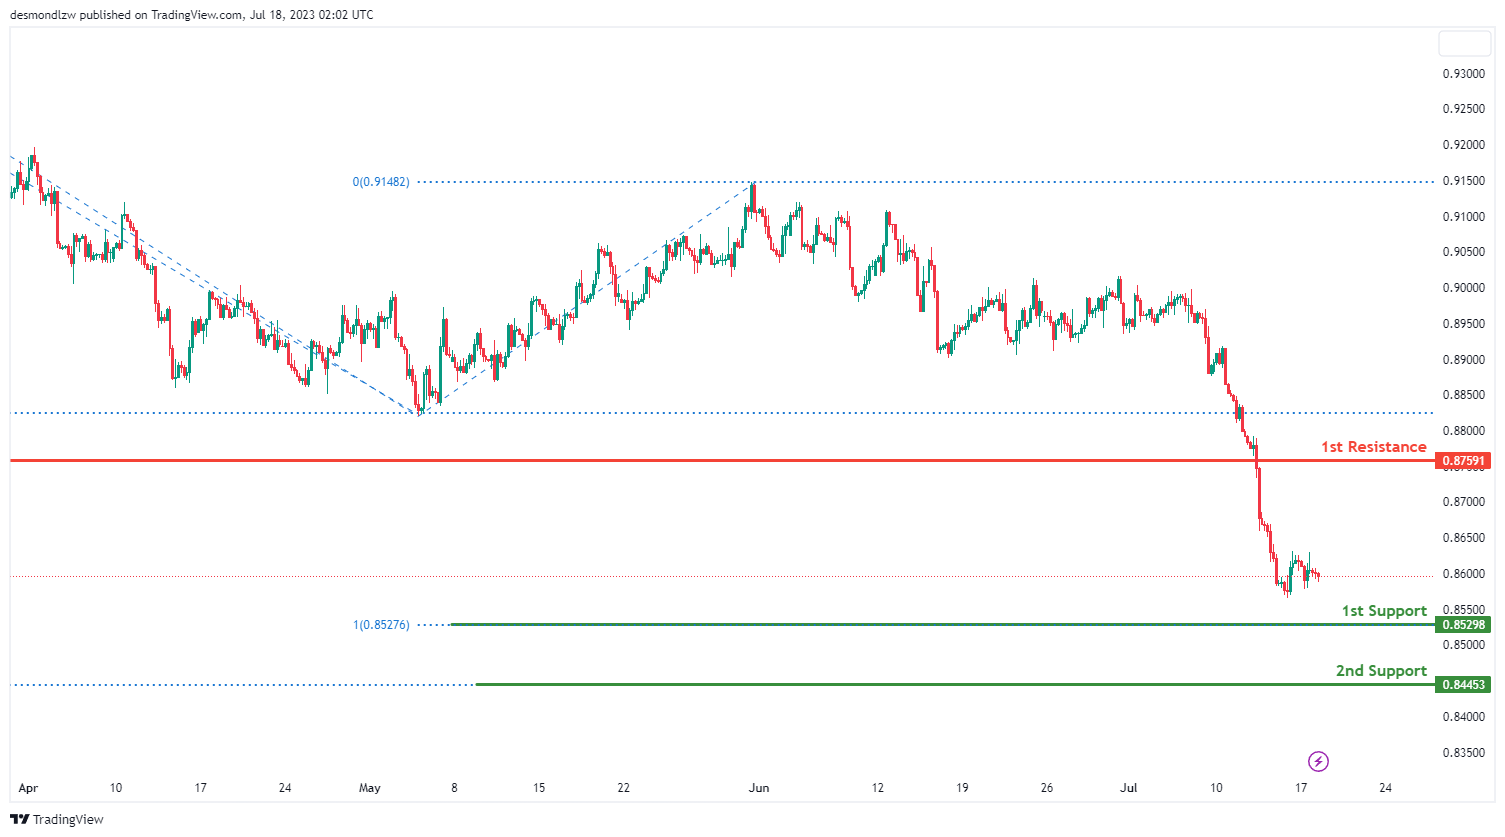
The USD/CHF instrument is currently exhibiting a bearish momentum, indicating that the price could potentially continue its downward movement towards the 1st support level.
The 1st support level is identified at 0.8529 and it aligns with the 100% Fibonacci projection, making it a significant level where the price might experience a bounce. Should this level fail to hold, the price could decline further to the 2nd support level at 0.8445, which corresponds to the -61.8% Fibonacci expansion level. These support levels are crucial areas where buying interest may surpass selling pressure, leading to a potential price increase.
Conversely, if the price reverses its course and starts to ascend, it could face resistance at 0.8759. This level, defined as a pullback resistance, might act as a barrier to the price’s advancement, possibly triggering a selling response. It’s important to closely monitor the price action at these critical levels for potential trading opportunities.
USD/JPY:
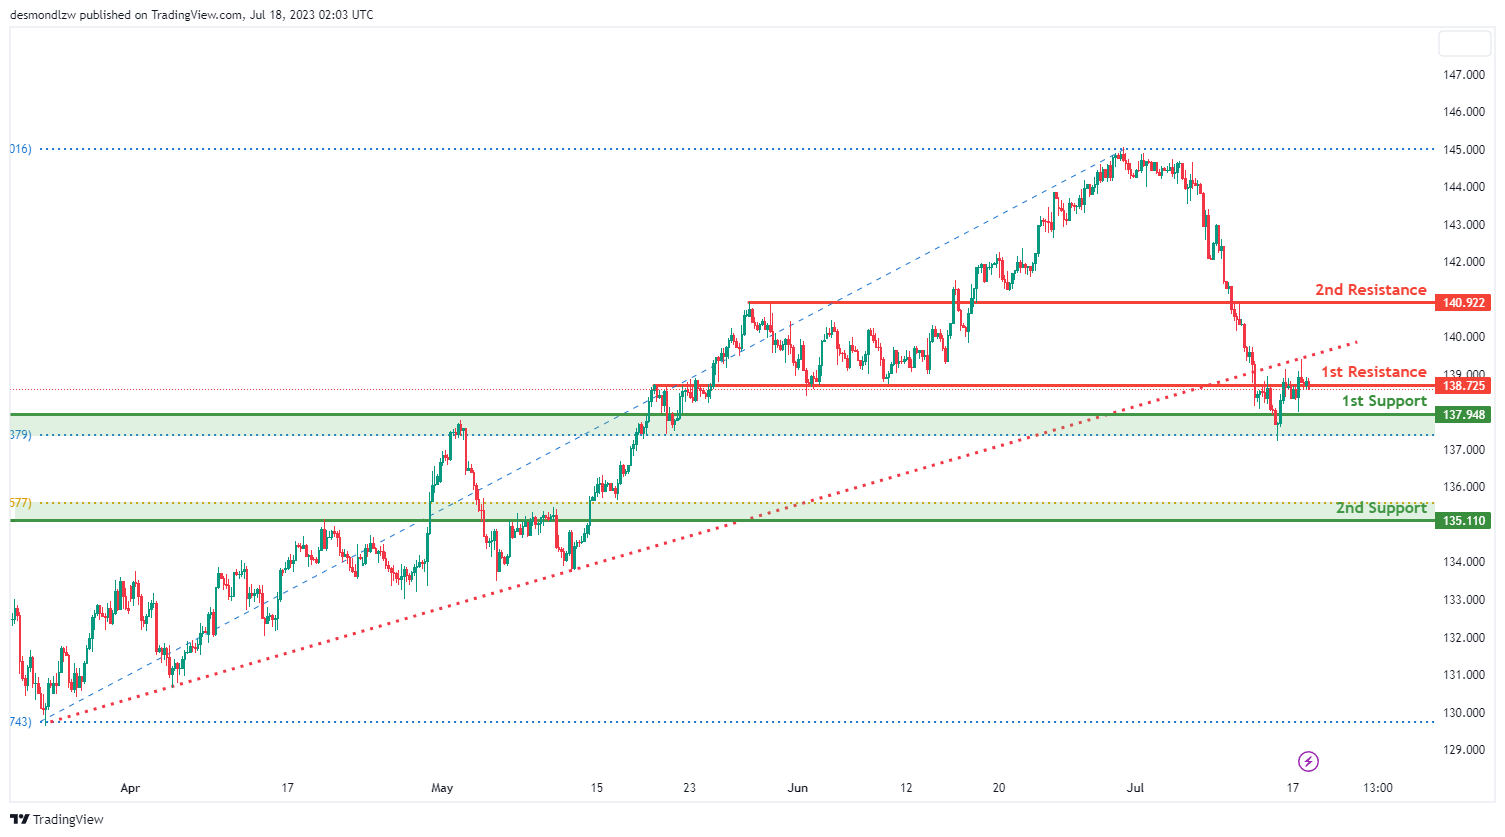
The USD/JPY currency pair currently demonstrates a bearish momentum after breaking below an ascending support line, which could potentially trigger further bearish movement. This suggests that the price could continue its downward trajectory towards the 1st support level.
The 1st support level is at 137.94 and is identified as an overlap support, coinciding with the 50% Fibonacci projection. This creates a potentially significant zone where the price may experience a bounce. If this support level fails to hold, the price could further descend towards the 2nd support level at 135.11, which is another overlap support but this time coinciding with the 61.80% Fibonacci retracement. These support levels are critical areas where buying pressure might exceed selling pressure, leading to a potential upturn in the price.
On the flip side, if the price starts to rise, it could face resistance at 138.72, identified as an overlap resistance. Further upwards, the 2nd resistance level stands at 140.92, also recognized as an overlap resistance. These resistance levels may act as barriers where the price could meet a selling response, potentially halting its upward movement
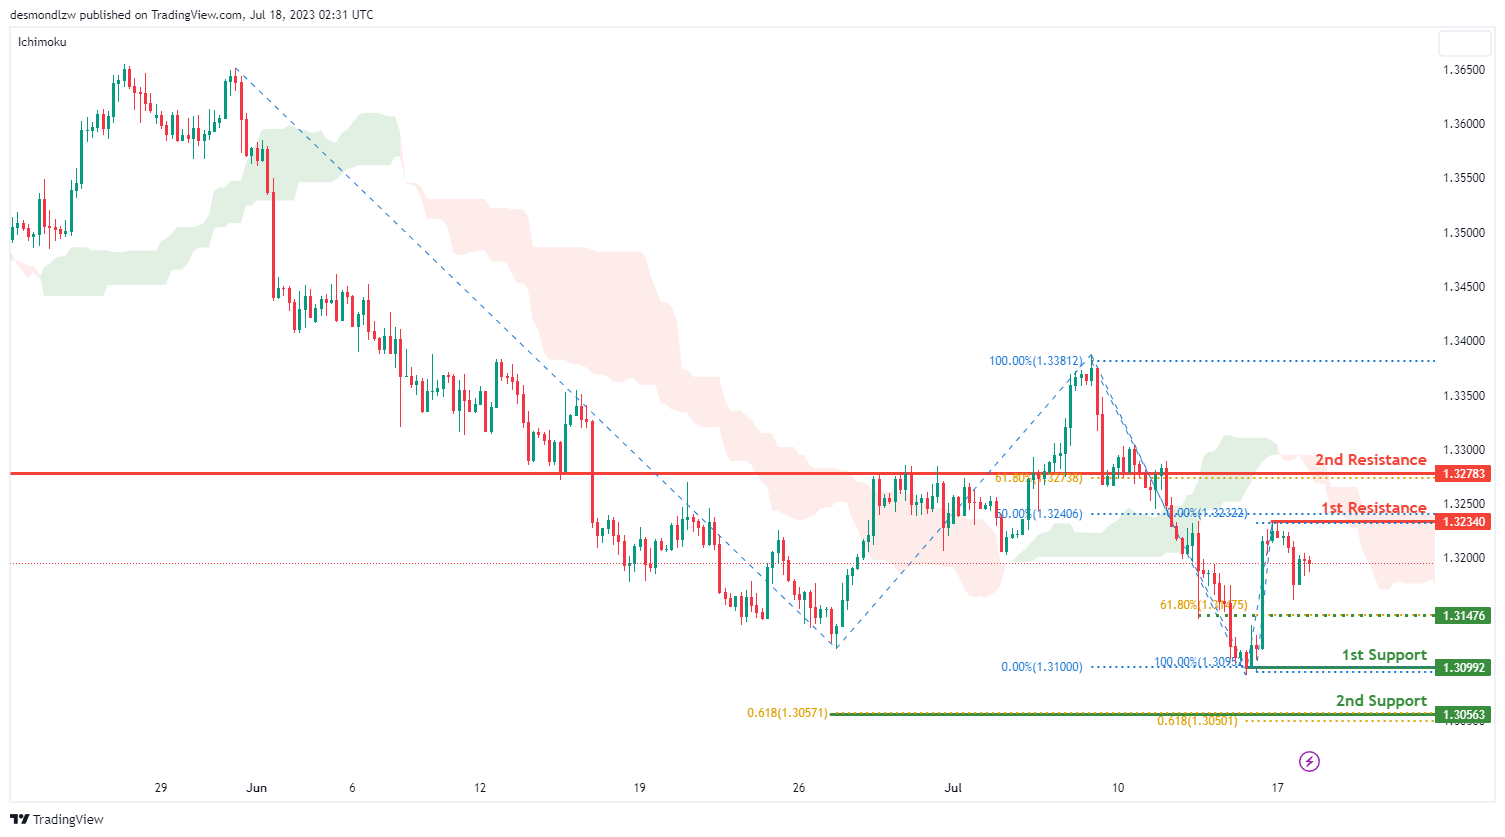
USD/CAD:
USD/CAD is currently showing a bearish momentum as the price is below the bearish Ichimoku cloud. This indicates that the price could potentially continue its bearish momentum towards the 1st support level.
The 1st support level is at 1.3099, identified as a swing low support level. In addition, there is also an intermediate support level at 1.3148 that coincides with the 61.8% Fibonacci retracement level. If the price goes beyond this point, the next level to watch would be the 2nd support at 1.3056, which is a pullback support level and also coincides with two Fibonacci projection levels at 61.80%. This indicates a strong Fibonacci confluence which might work as a strong barrier against further price decline.
On the other hand, if the price reverses its bearish course, it could face resistance at 1.3234, identified as a swing-high resistance level and also coinciding with the 50% Fibonacci retracement level. A further bullish move may encounter the 2nd resistance level at 1.3278, an overlap resistance which aligns with the 61.80% Fibonacci retracement level. These resistance levels could potentially hinder further price progress and trigger a selling response.
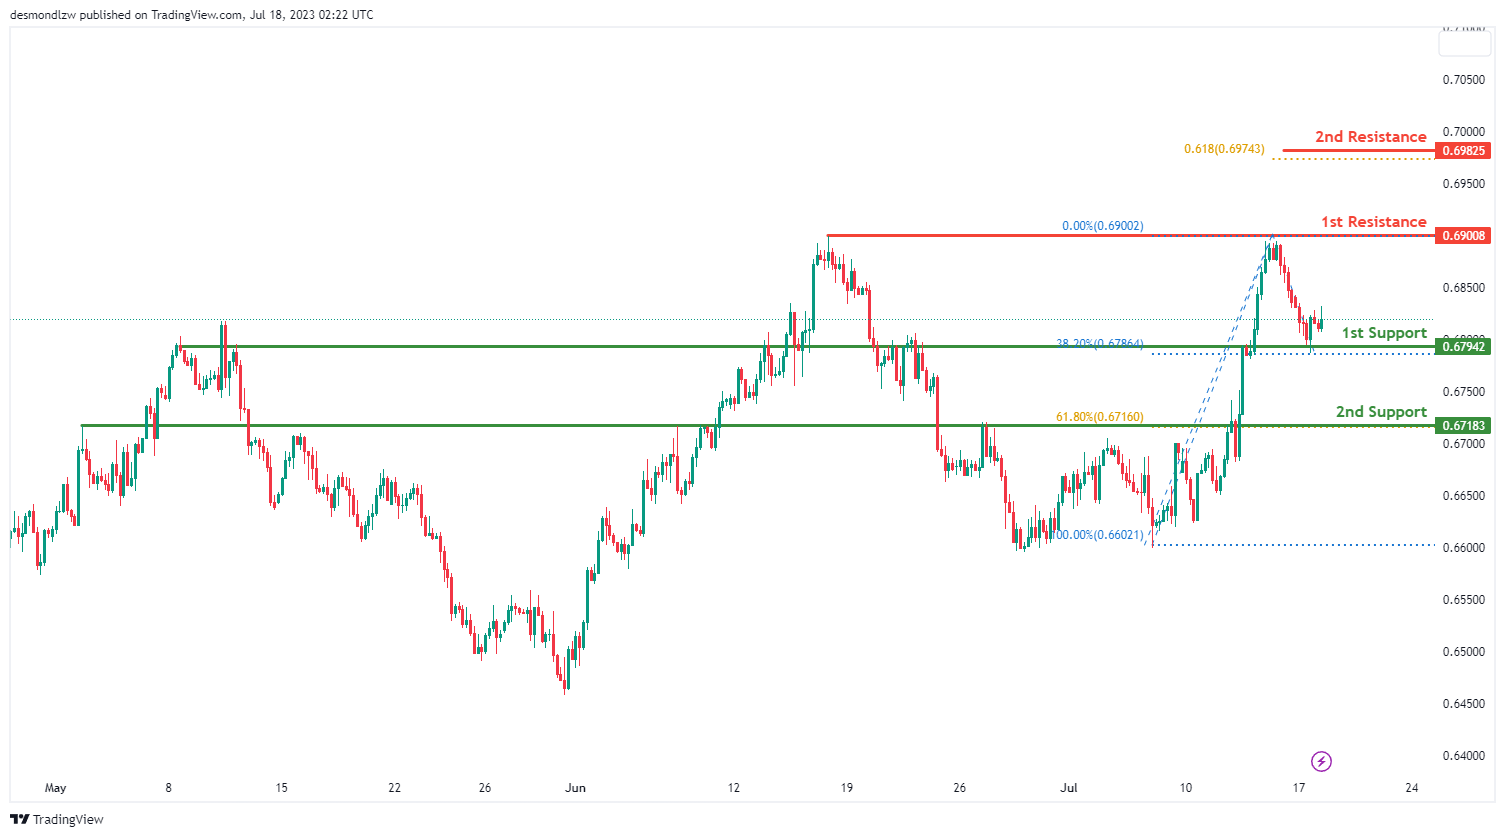
AUD/USD:
The AUD/USD pair currently shows bullish momentum. In this context, it could potentially make a bullish bounce off the 1st support level and head towards the 1st resistance level.
The 1st support level is located at 0.6794, recognized as an overlap support and coinciding with the 38.20% Fibonacci retracement level. If the price retreats to this level, it could find strong buying interest that could push it higher. Should the 1st support level fail to hold, the price might further decline towards the 2nd support level at 0.6718, which is identified as a pullback support and aligns with the 61.80% Fibonacci retracement level.
On the upside, the 1st resistance level is situated at 0.6900, defined as a multi-swing high resistance. This level might act as a hurdle where the price could face selling pressure. If the price successfully breaks this resistance, it could aim for the 2nd resistance level at 0.6982, also a significant level as per the 61.80% Fibonacci projection.
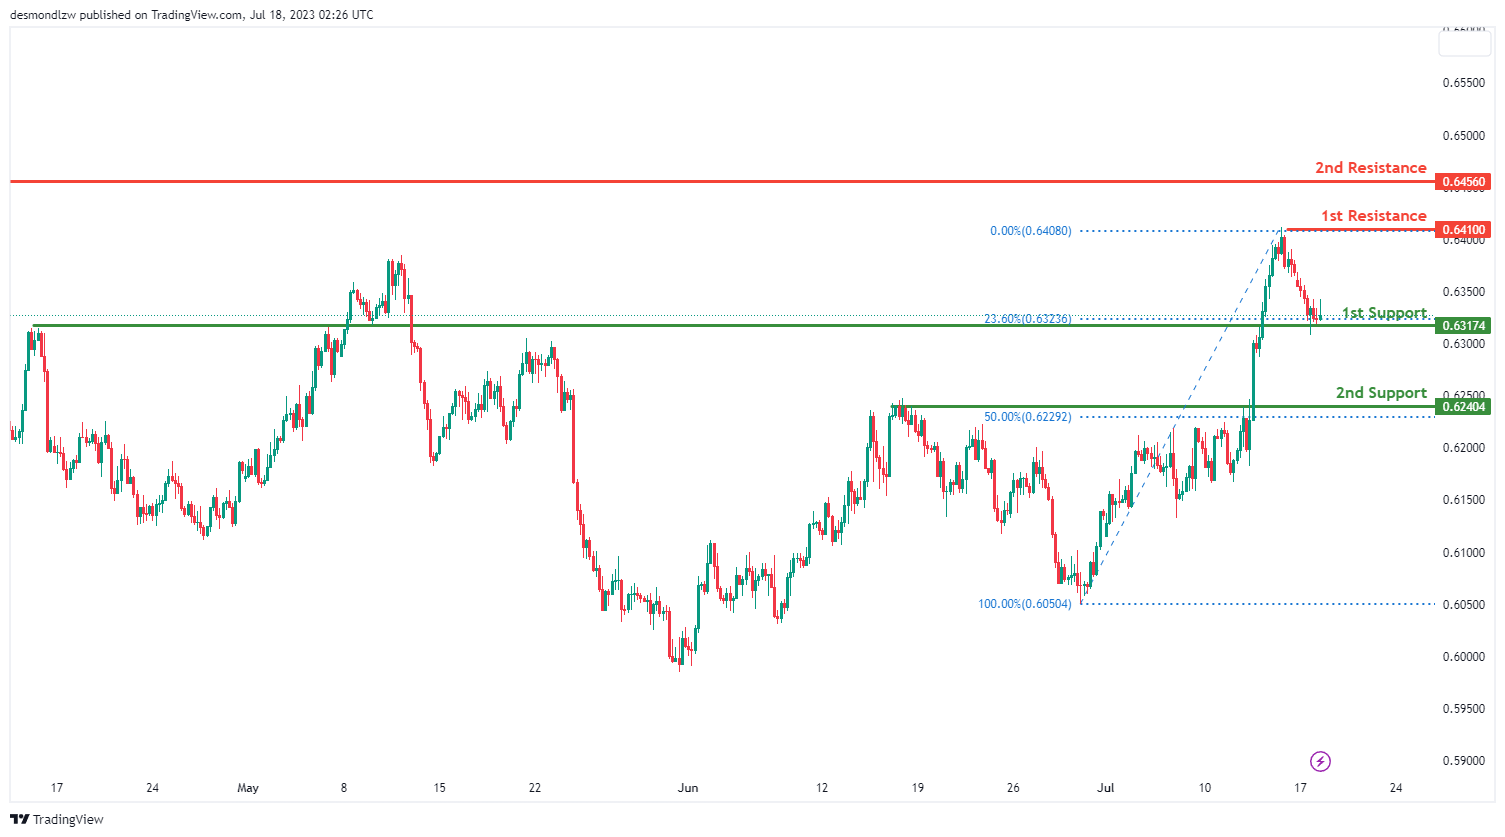
NZD/USD
The NZD/USD pair is currently showcasing bullish momentum. Given this context, it could potentially make a bullish bounce off the 1st support level and proceed towards the 1st resistance level.
The 1st support level is at 0.6317, identified as an overlap support and coinciding with the 38.20% Fibonacci retracement level. If the price retraces to this level, it may encounter significant buying interest that could push it upwards. Should the 1st support fail to hold, the price may further decline towards the 2nd support level at 0.6240. This level is recognized as a pullback support and aligns with the 50% Fibonacci retracement level.
On the upside, the 1st resistance level stands at 0.6410, characterized by swing high resistance. This level might act as a hurdle, triggering some selling pressure. If the price successfully surmounts this resistance, it could then aim for the 2nd resistance level at 0.6456, known as a pullback resistance.
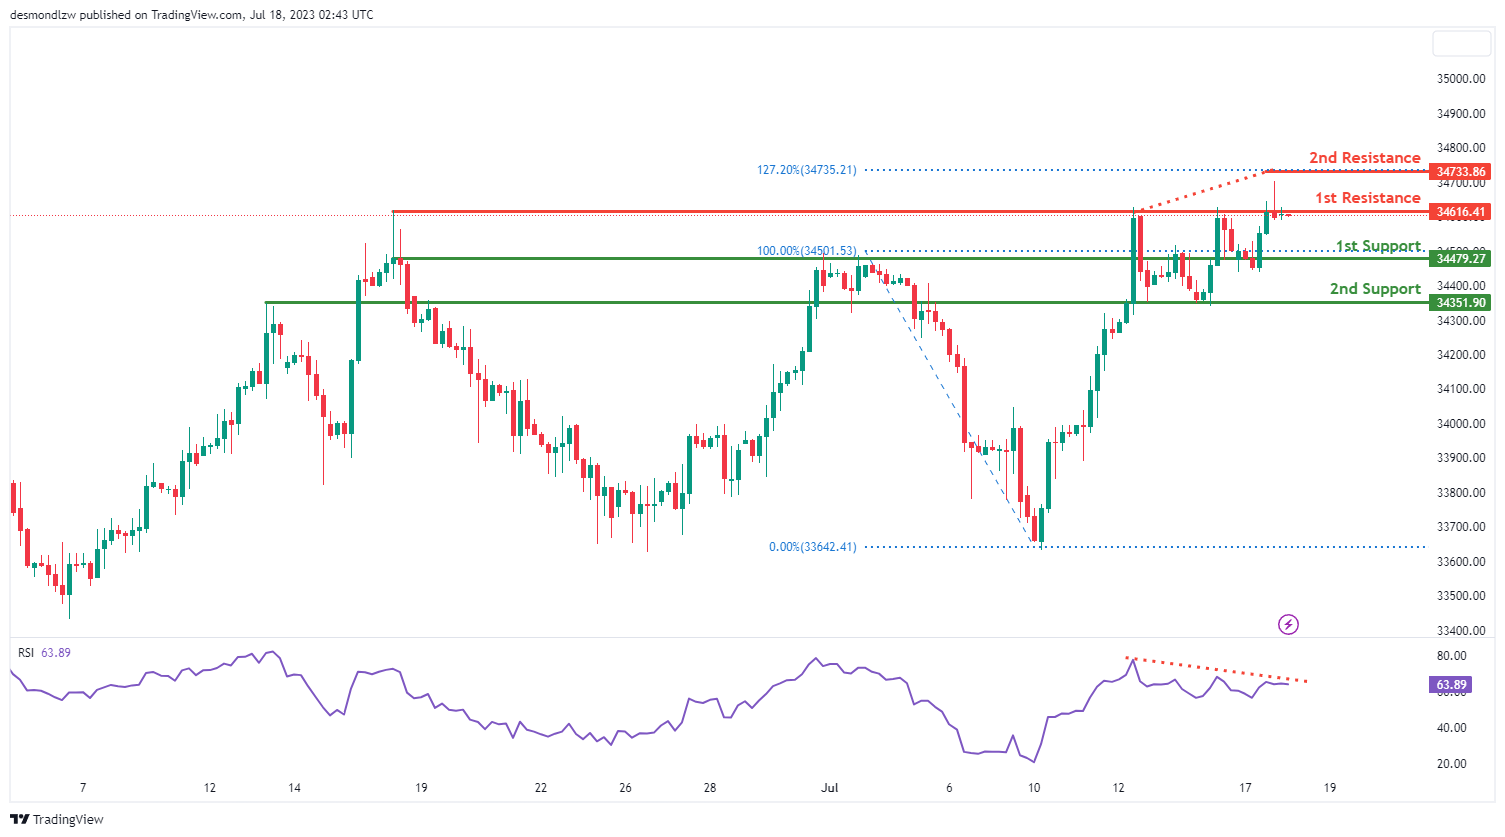
DJ30:
The DJ30, or Dow Jones Industrial Average, is currently experiencing a bearish momentum. Based on the chart analysis, there is a potential for a bearish reaction off the first resistance level, leading to a drop towards the first support level.
The first support level at 34479.27 is considered good as it provides pullback support and aligns with the 38.20% Fibonacci retracement level. The second support at 34351.90 is identified as an overlap support level.
On the upside, the first resistance level at 34616.41 is seen as a multi-swing high resistance. The second resistance at 34733.86 corresponds to the 127.20% Fibonacci extension level.
Additionally, the Relative Strength Index (RSI) is displaying bearish divergence versus price, suggesting that a reversal might occur soon.
GER30:
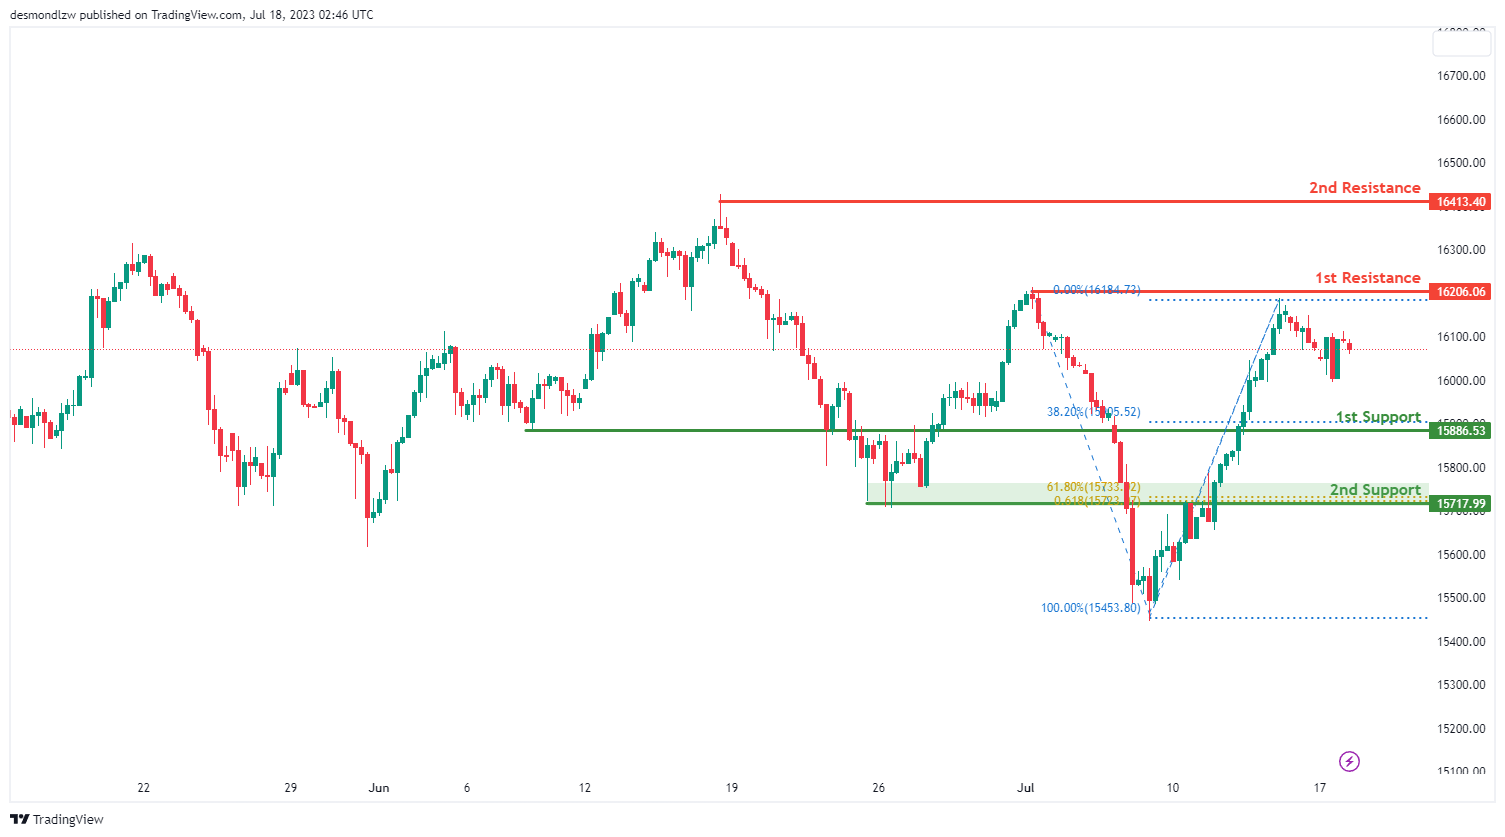
The GER30 (DAX) instrument is currently experiencing a neutral momentum, indicating a lack of clear directional bias in the chart.
Based on the analysis, there is a potential for price to fluctuate between the first resistance and first support levels.
The first support level at 15886.53 is considered good as it provides pullback support and aligns with the 38.20% Fibonacci retracement level. The second support at 15717.99 is identified as an overlap support, which also coincides with the 61.80% Fibonacci retracement and projection levels, indicating Fibonacci confluence.
On the upside, the first resistance level at 16206.06 is seen as a multi-swing high resistance. The second resistance at 16413.40 corresponds to a swing high resistance level.
US500
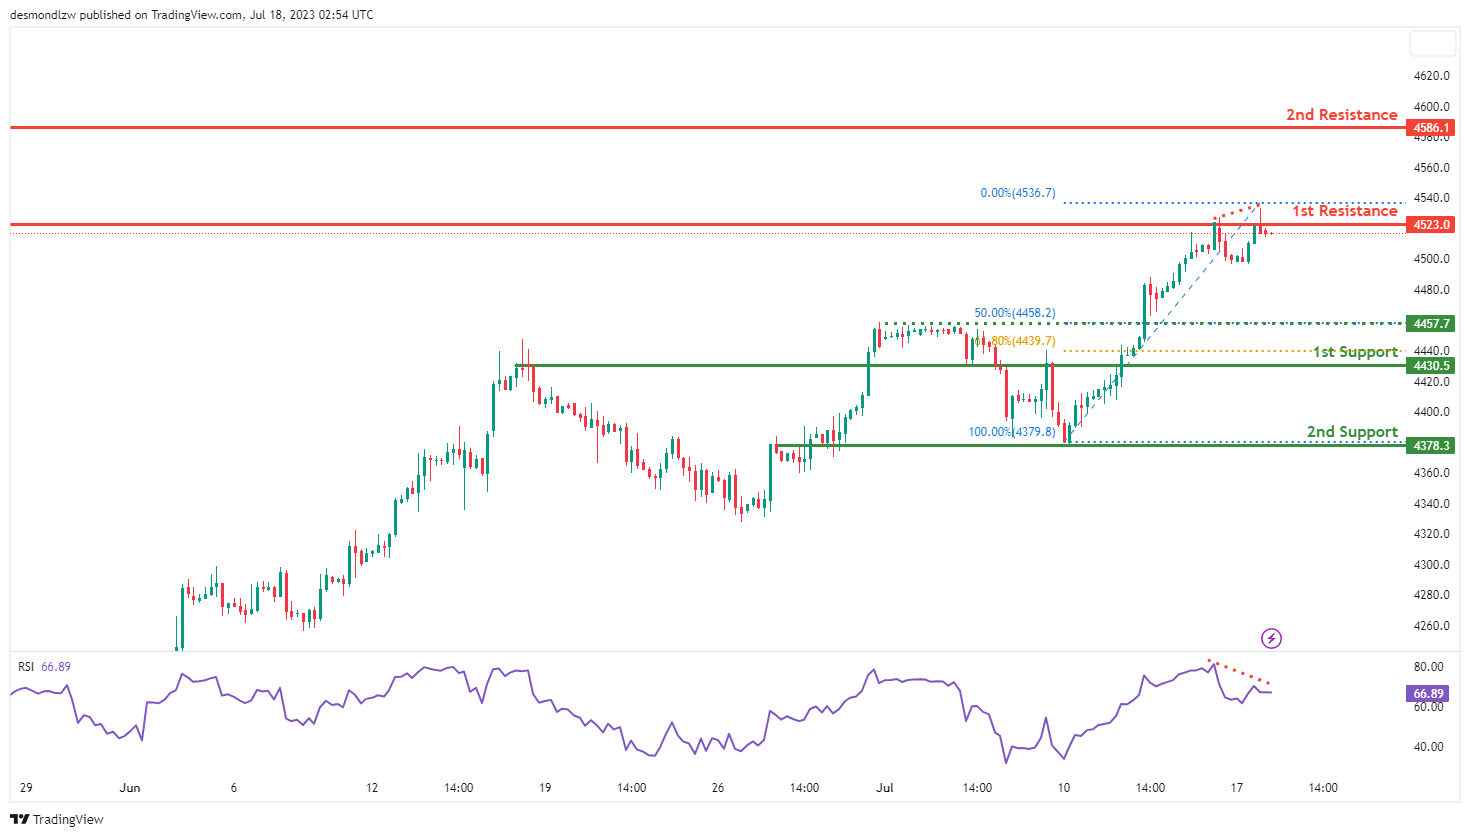
The US500 (S&P 500) instrument is currently experiencing a bearish momentum, indicating a downward bias in the chart.
Based on the analysis, there is a potential for price to have a bearish reaction off the first resistance level and drop towards the first support level. The first support level at 4430.5 is considered good as it aligns with an overlap support and coincides with the 61.80% Fibonacci retracement level. The second support at 4378.3 is identified as an overlap support.
On the upside, the first resistance level at 4523.0 is seen as a multi-swing high resistance. The second resistance at 4586.1 corresponds to a swing high resistance level.
Additionally, the RSI indicator is displaying bearish divergence versus price, suggesting that a reversal might occur soon. This could further support the bearish scenario.
BTC/USD:
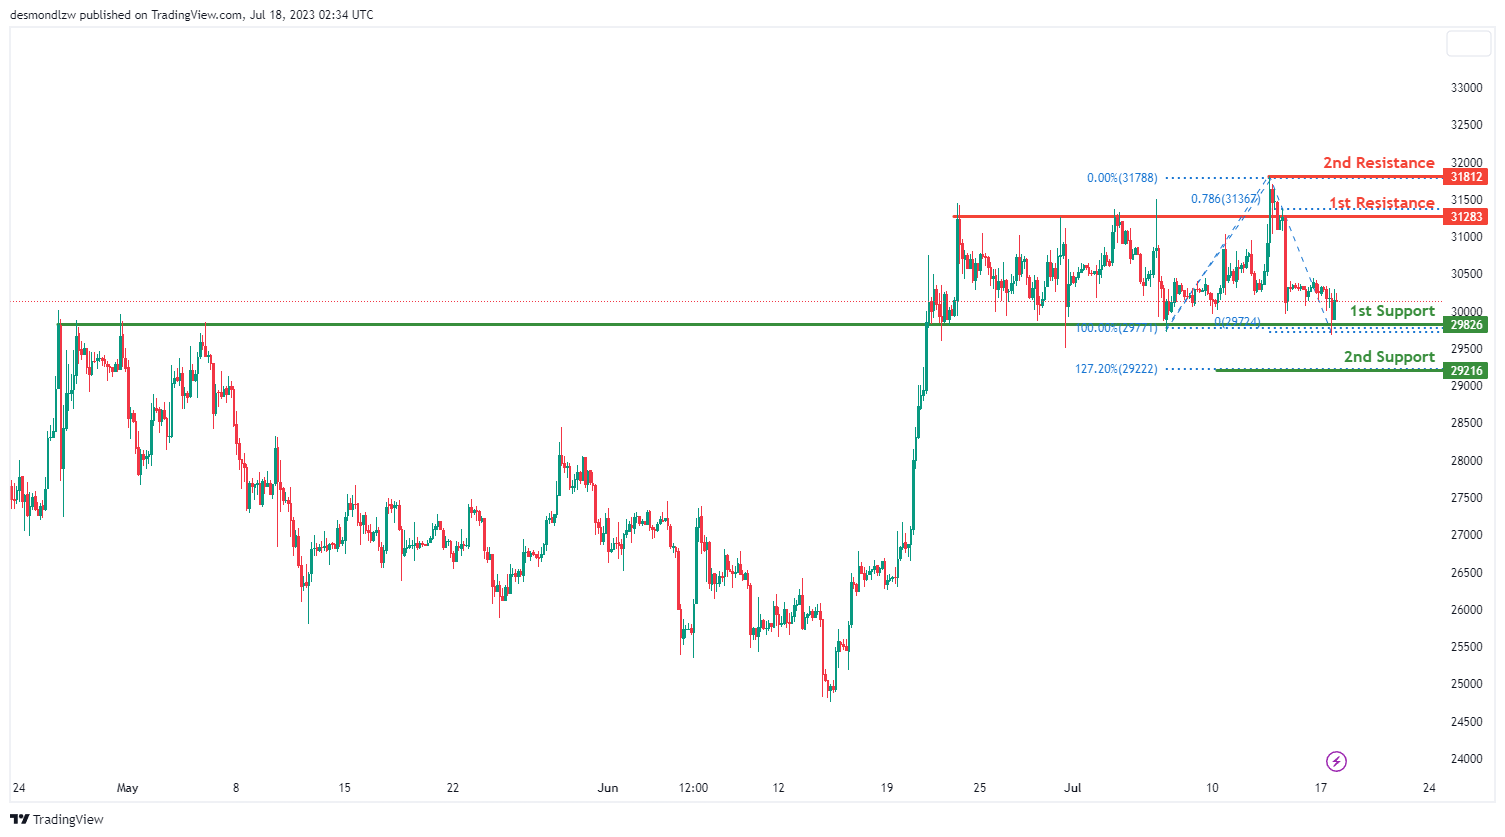
For the BTC/USD instrument, the overall momentum of the chart is currently neutral, which suggests that the price could potentially fluctuate between the 1st resistance and 1st support level.
The 1st support level is at 29826, identified by overlap support. If this support level fails to hold, the price could potentially drop to the 2nd support level at 29216, which is at the 127% Fibonacci retracement level. These support levels are critical areas where buying interest could outweigh selling pressure and lead to a price rebound.
On the other hand, if the price starts to rise, it could face resistance at 31283. This level is identified as an overlap resistance and a 78.6% Fibonacci projection. Further above, the 2nd resistance level is at 31812, which is a swing high resistance level, could also act as a strong barrier for upward price movement and potentially trigger a selling response.
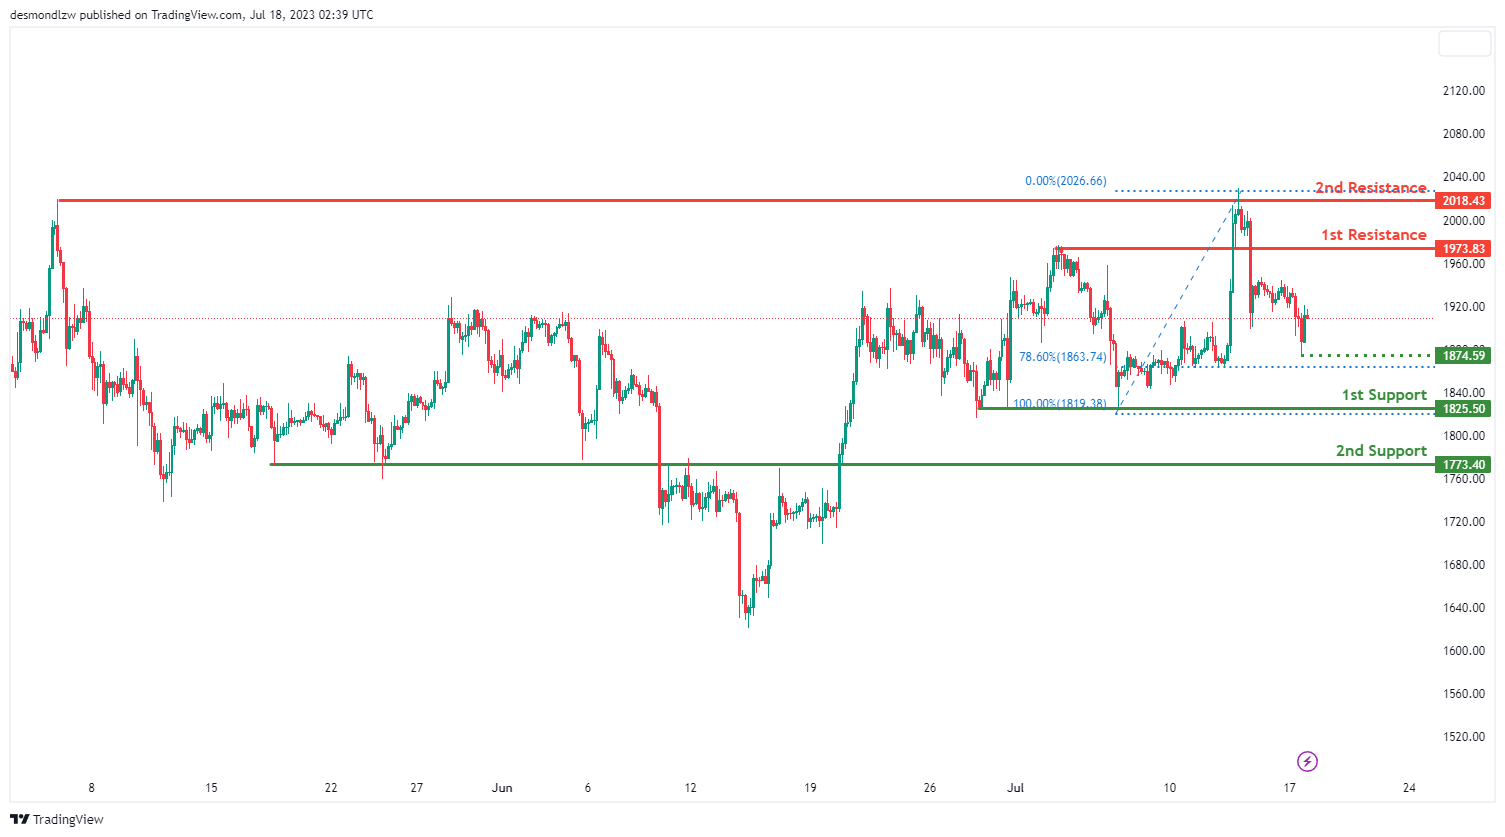
ETH/USD:
The ETH/USD instrument is currently exhibiting a neutral overall momentum. Based on the chart analysis, there is a potential for price to fluctuate between the first resistance and first support levels.
The first support level at 1825.50 is considered strong due to its status as a multi-swing low support. Additionally, the second support level at 1773.40 is identified as an overlap support.
On the other hand, the first resistance at 1973.83 is seen as an overlap resistance, indicating a potential barrier to further upward movement. The second resistance at 2018.43 is identified as a multi-swing high resistance.
There is also an intermediate support level at 1874.59, which is noteworthy as a swing low support and coincides with the 78.60% Fibonacci retracement level.
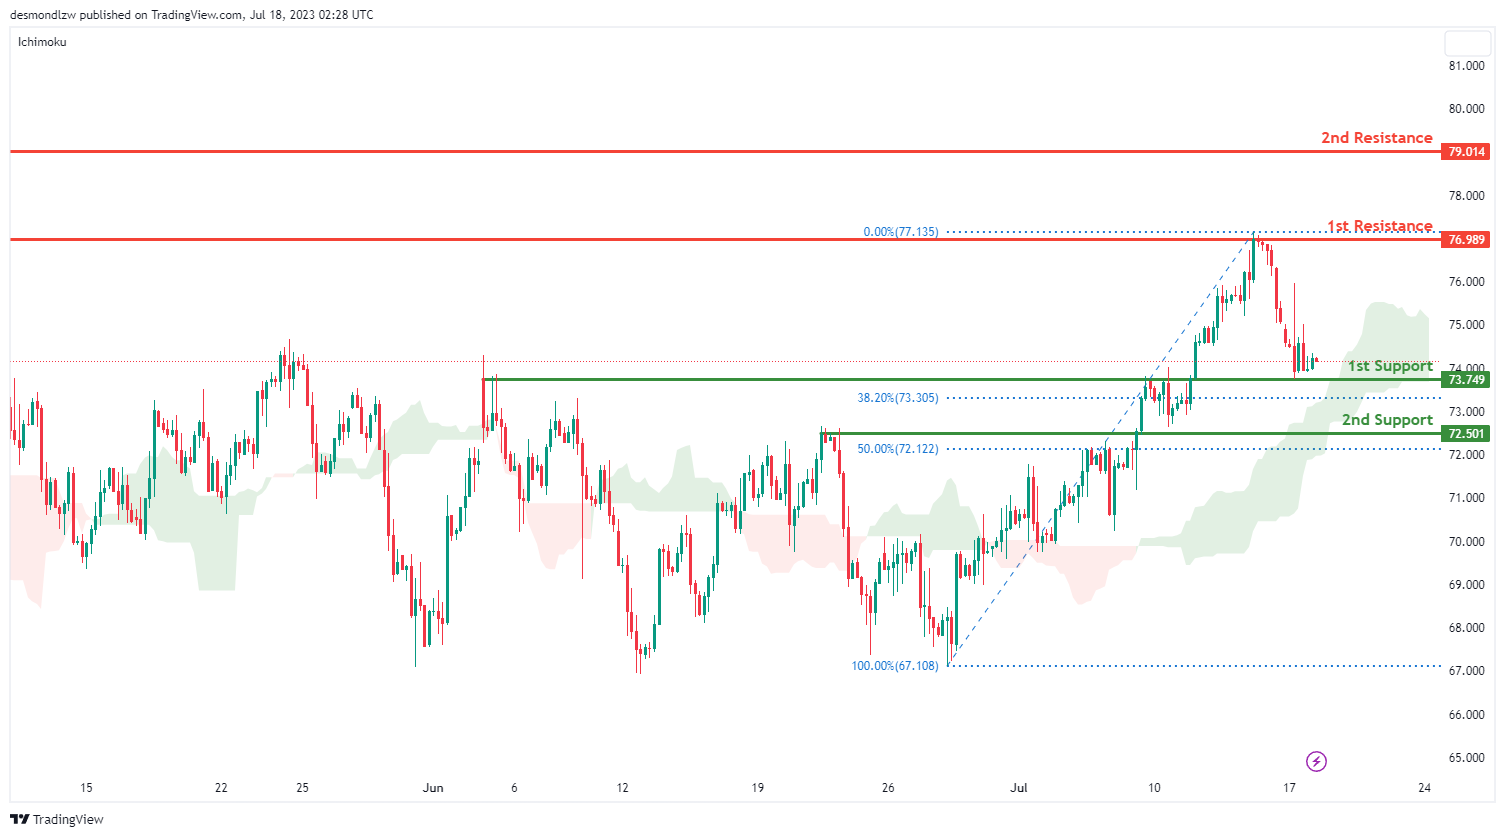
WTI/USD:
The WTI/USD pair is currently displaying a bullish momentum, despite being above the bullish Ichimoku cloud. In light of this, the price could potentially make a bullish bounce off the 1st support level and progress towards the 1st resistance level.
The 1st support level is situated at $73.75, recognized as an overlap support, and coincides with the 38.20% Fibonacci retracement level. If this level fails to hold the price, it could potentially decline towards the 2nd support level at $72.50. This level is also noted as an overlap support, and it aligns with the 50% Fibonacci retracement level.
On the flip side, if the price maintains its bullish trajectory, it could encounter resistance at $76.99. This level is marked as overlap resistance and could act as a barrier to the price’s upward progression. If the price manages to breach this resistance, it could then aim for the 2nd resistance level at $79.01, which is similarly recognized as overlap resistance.
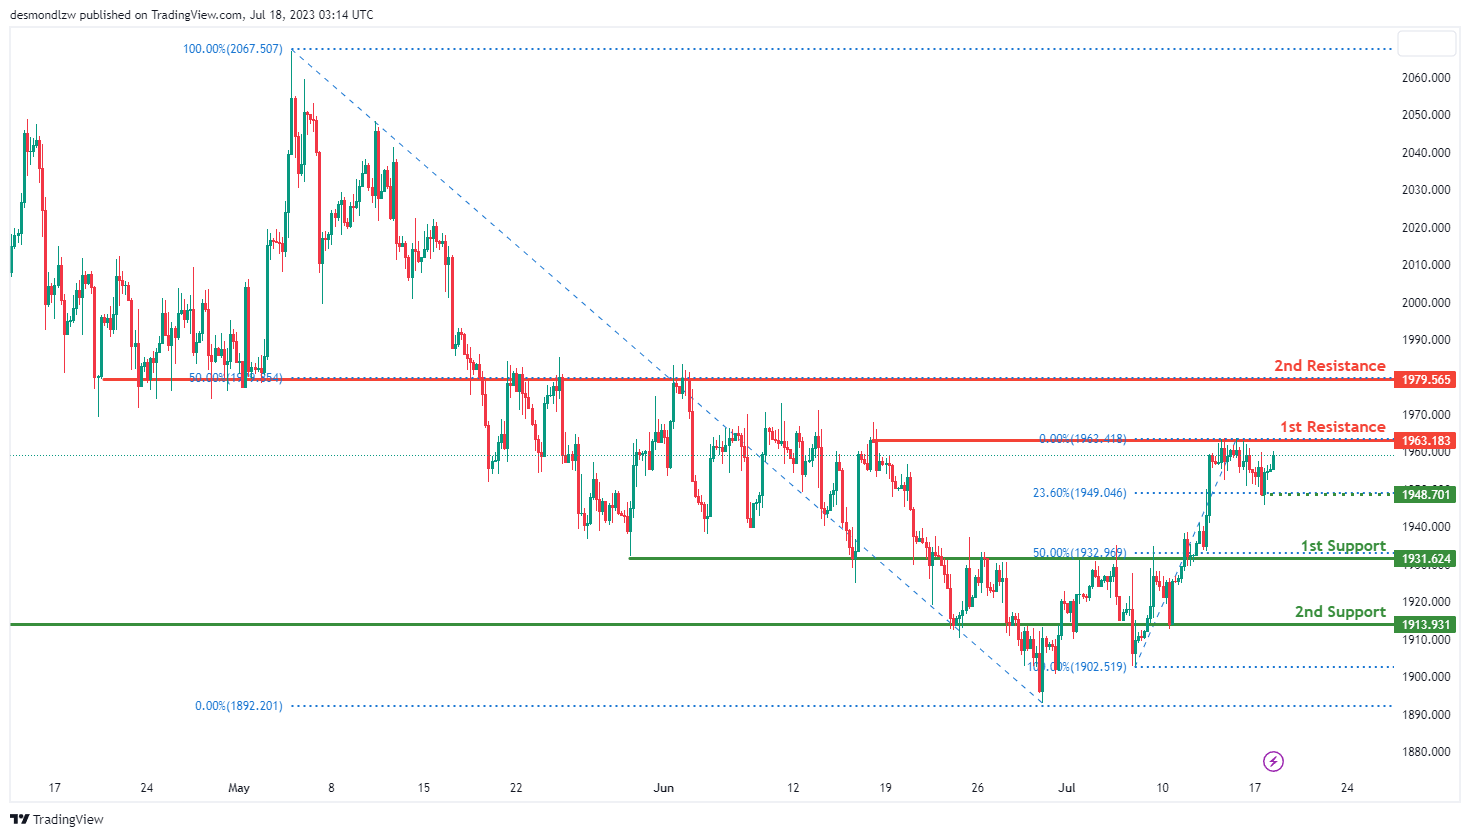
XAU/USD (GOLD):
The XAU/USD pair, also known as gold, is currently showing neutral momentum, which indicates the price could potentially fluctuate between the 1st resistance and 1st support level.
The 1st support level is identified at 1931.62, known as an overlap support and aligning with the 50% Fibonacci projection level. This could be a level at which buying interest may potentially outweigh selling interest, leading to a possible price rebound. If the price breaks this level, it could drop further to the 2nd support level at 1913.93, also identified as an overlap support.
On the upside, the 1st resistance level is positioned at 1963.18, a level defined by the multi-swing high resistance. If the price manages to break this resistance, it could climb towards the 2nd resistance level at 1979.56, which is known as an overlap resistance. These resistance levels may act as barriers where the price could meet selling interest.
In between these levels, there’s an intermediate support level at 1948.70, recognized as a pullback support and coinciding with the 23.60% Fibonacci retracement.


