
DXY:
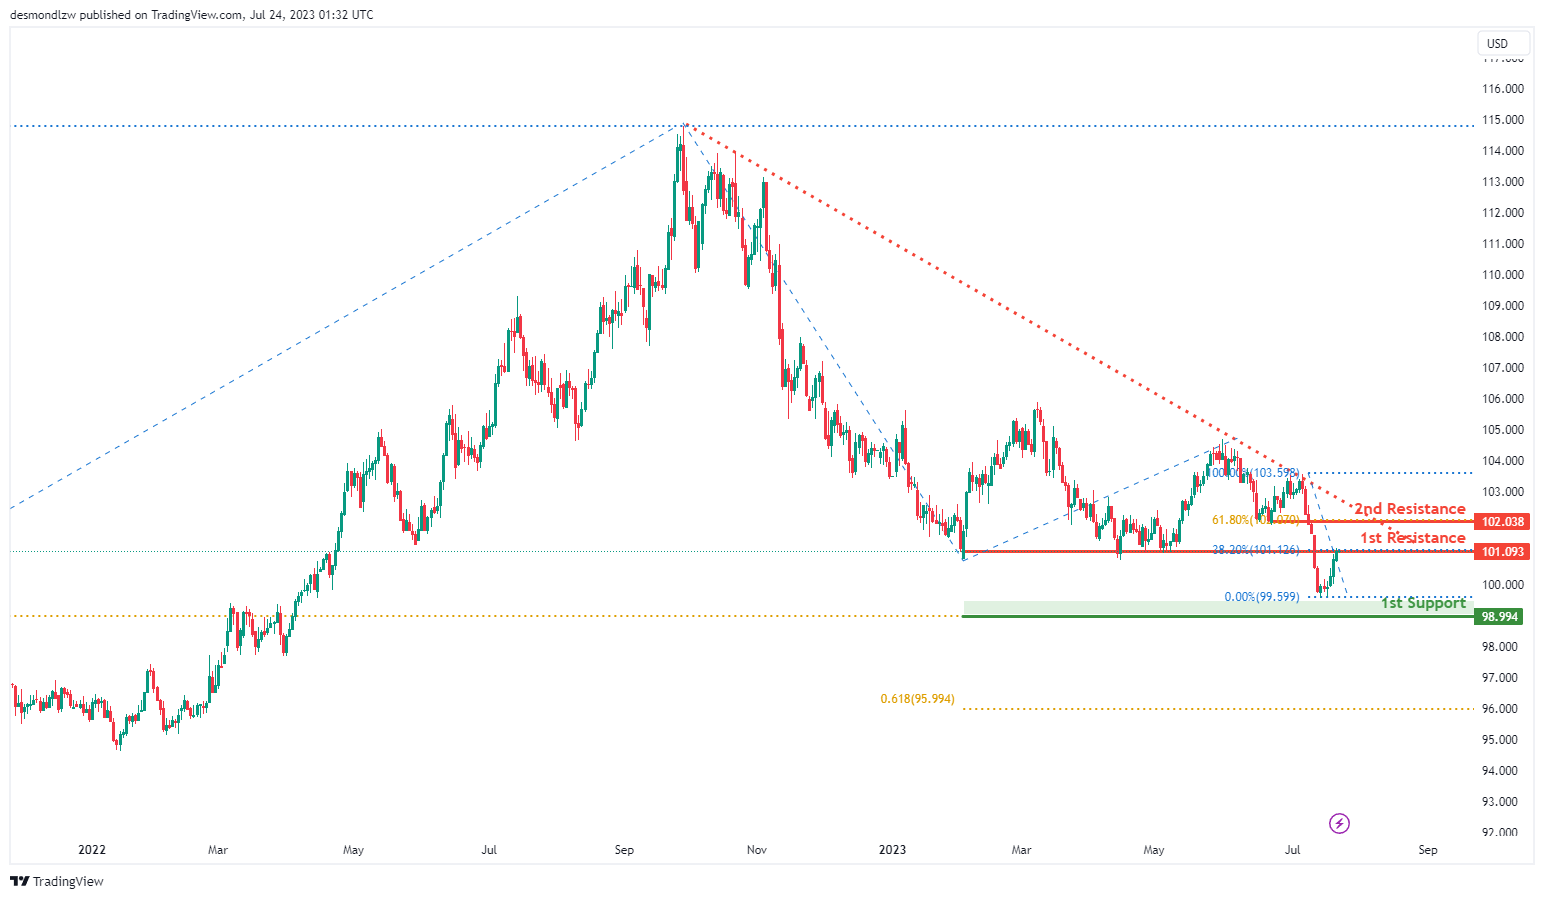
The DXY (US Dollar Index) chart indicates a bearish overall momentum, attributed to the price being below a significant descending trend line, suggesting a potential continuation of the bearish trend.
The price may potentially experience a bearish reaction off the 1st resistance level at 101.09, which coincides with the 38.20% Fibonacci retracement, leading to a drop towards the 1st support at 101.03, representing the 61.80% Fibonacci retracement.
Additionally, the 2nd resistance at 102.03 acts as a pullback resistance, aligned with the 61.80% Fibonacci retracement, and could further hinder any upward movement. These resistance and support levels are critical in gauging potential price reactions.
EUR/USD:
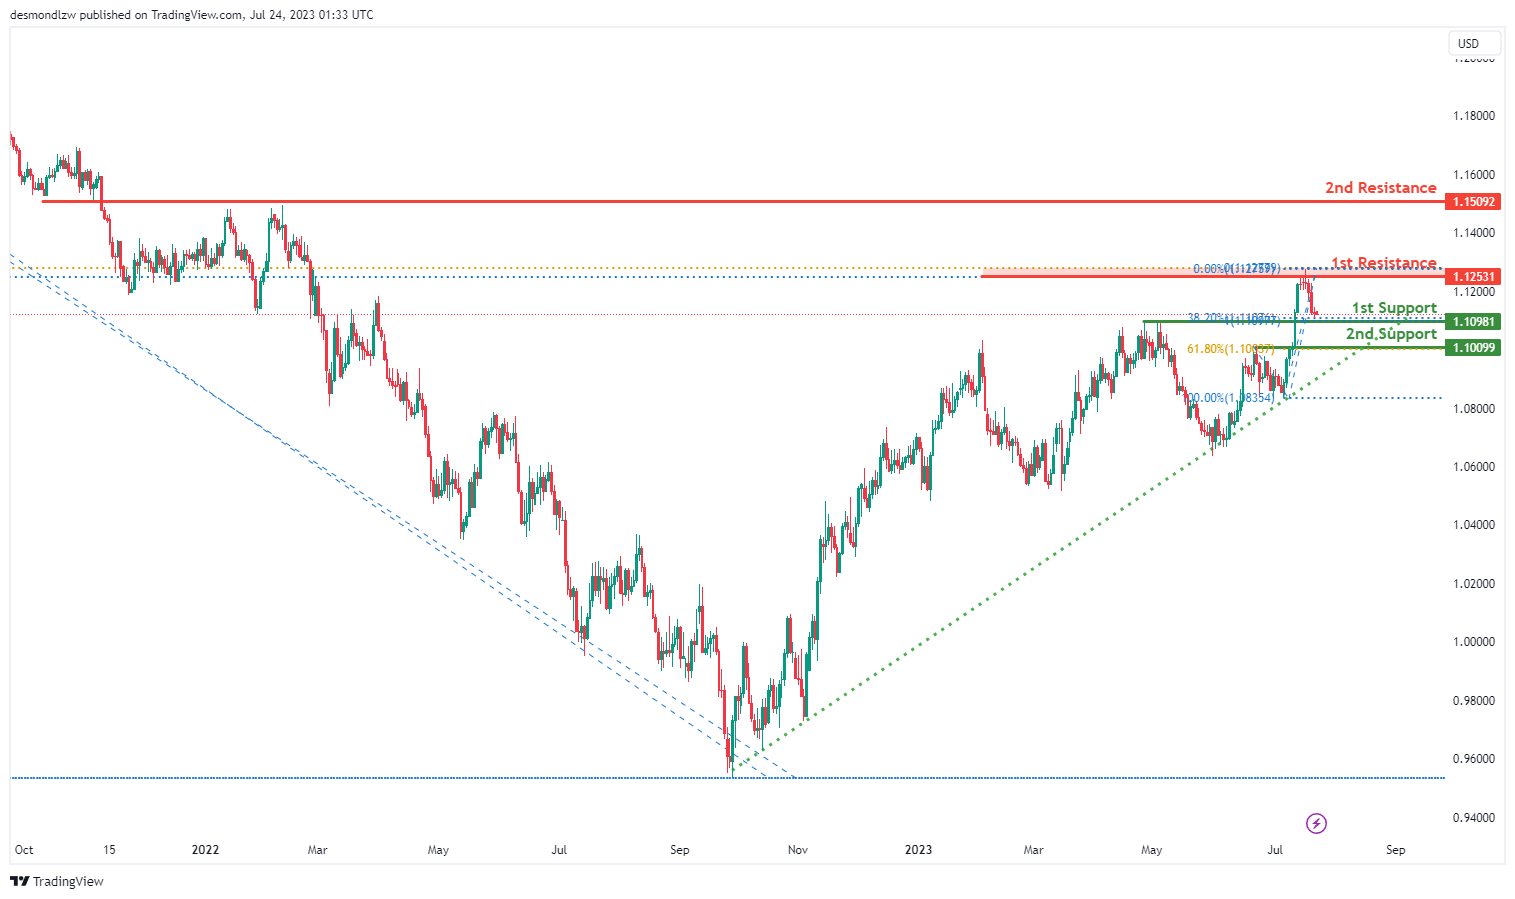
The EUR/USD chart demonstrates a bullish momentum, with the price above a significant ascending trend line, indicating the possibility of further upward movement.
A potential scenario is a bullish bounce off the 1st support level at 1.1098, aligned with the 38.20% Fibonacci retracement, leading the price towards the 1st resistance at 1.1253. This resistance level coincides with the 61.80% Fibonacci retracement and the 100% Fibonacci projection, adding to its significance.
Additionally, the 2nd support at 1.1009 is another pullback support, corresponding to the 61.80% Fibonacci retracement, while the 2nd resistance at 1.1509 acts as an overlap resistance. These levels may play crucial roles in potential price movements.
EUR/JPY:
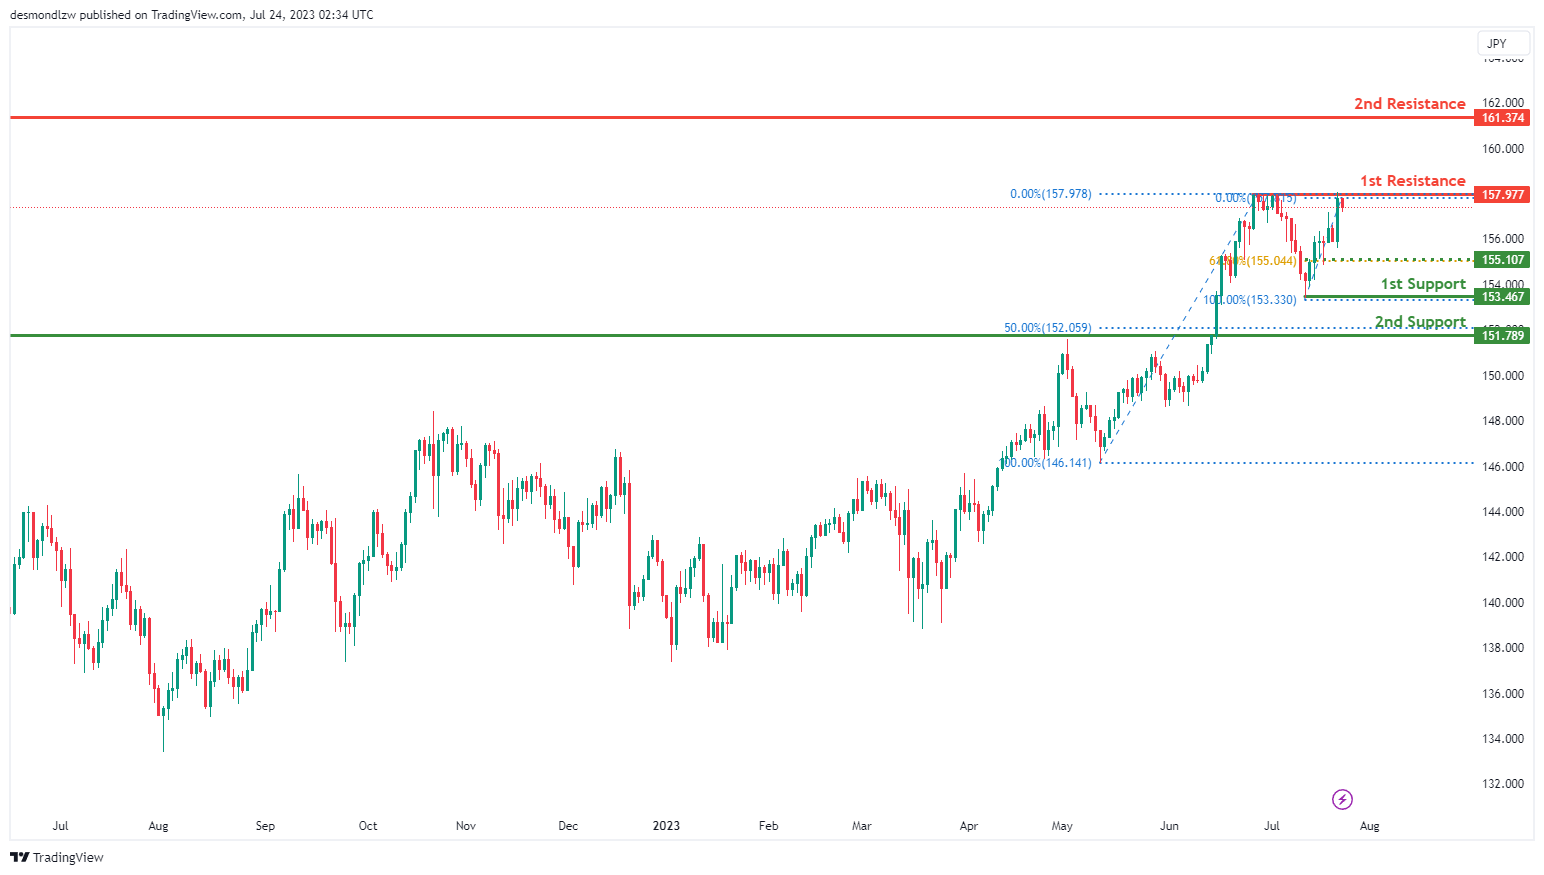
The EUR/JPY instrument is currently displaying a bearish trend. The chart suggests that the price might potentially continue its bearish momentum towards the 1st support level.
The 1st support level is identified at 153.46, which acts as a swing low support and could potentially provide a buffer against further price declines.
If the price further descends, the 2nd support level is located at 151.78, identified as an overlap support, which could provide additional assurance against further price decline.
In the event the price starts to ascend, it could face resistance at 157.97, which is defined by a multi-swing high resistance. If the price surpasses this, the 2nd resistance at 161.37, identified as an overlap resistance, could pose the next substantial barrier to price increases.
An intermediate support level is also present at 155.10, which corresponds to a 61.80% Fibonacci retracement, adding to its significance as a potential support level in the event of price drops.
EUR/GBP:
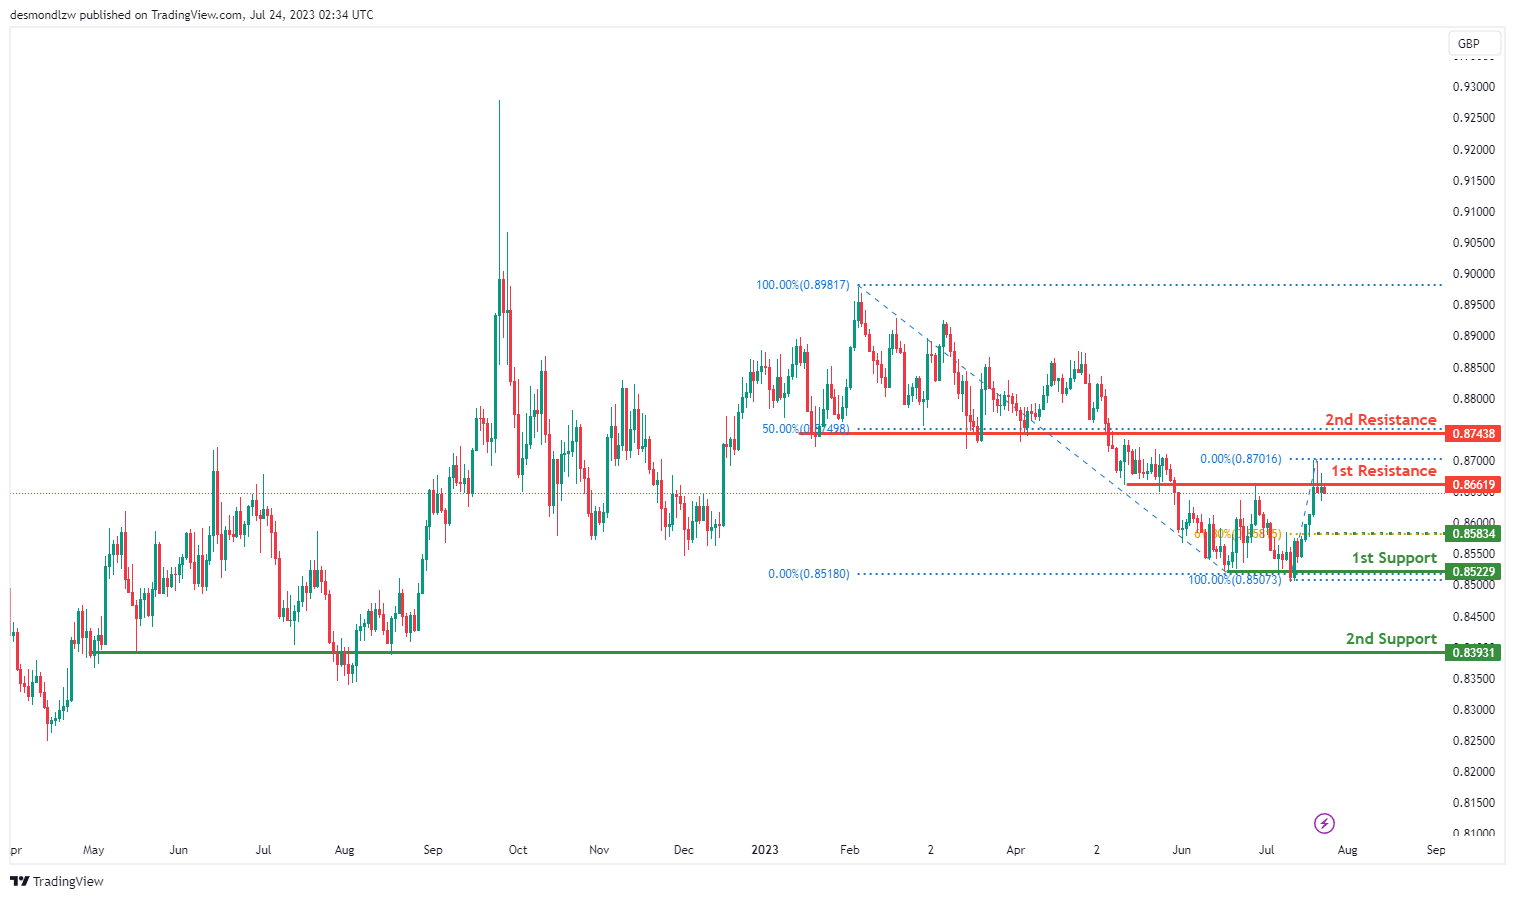
The EUR/GBP pair is currently showing a bearish momentum, suggesting that the price could potentially bounce off the 1st resistance and drop to the 1st support level.
The 1st support level is at 0.8522 and serves as an overlap support, which could provide a degree of price stability. In case the price drops further, the 2nd support at 0.8393, also an overlap support, could offer an additional barrier against further price decline.
In terms of resistance, the 1st resistance level is at 0.8661, and it’s identified as an overlap resistance that could challenge any potential bullish movement. Should the price manage to surpass this, the 2nd resistance at 0.8743, a pullback resistance, could pose the next significant obstacle.
Additionally, there’s an intermediate support at 0.8580, recognized as an overlap support and aligns with the 61.80% Fibonacci retracement level, potentially offering another point of price stability.
GBP/USD:
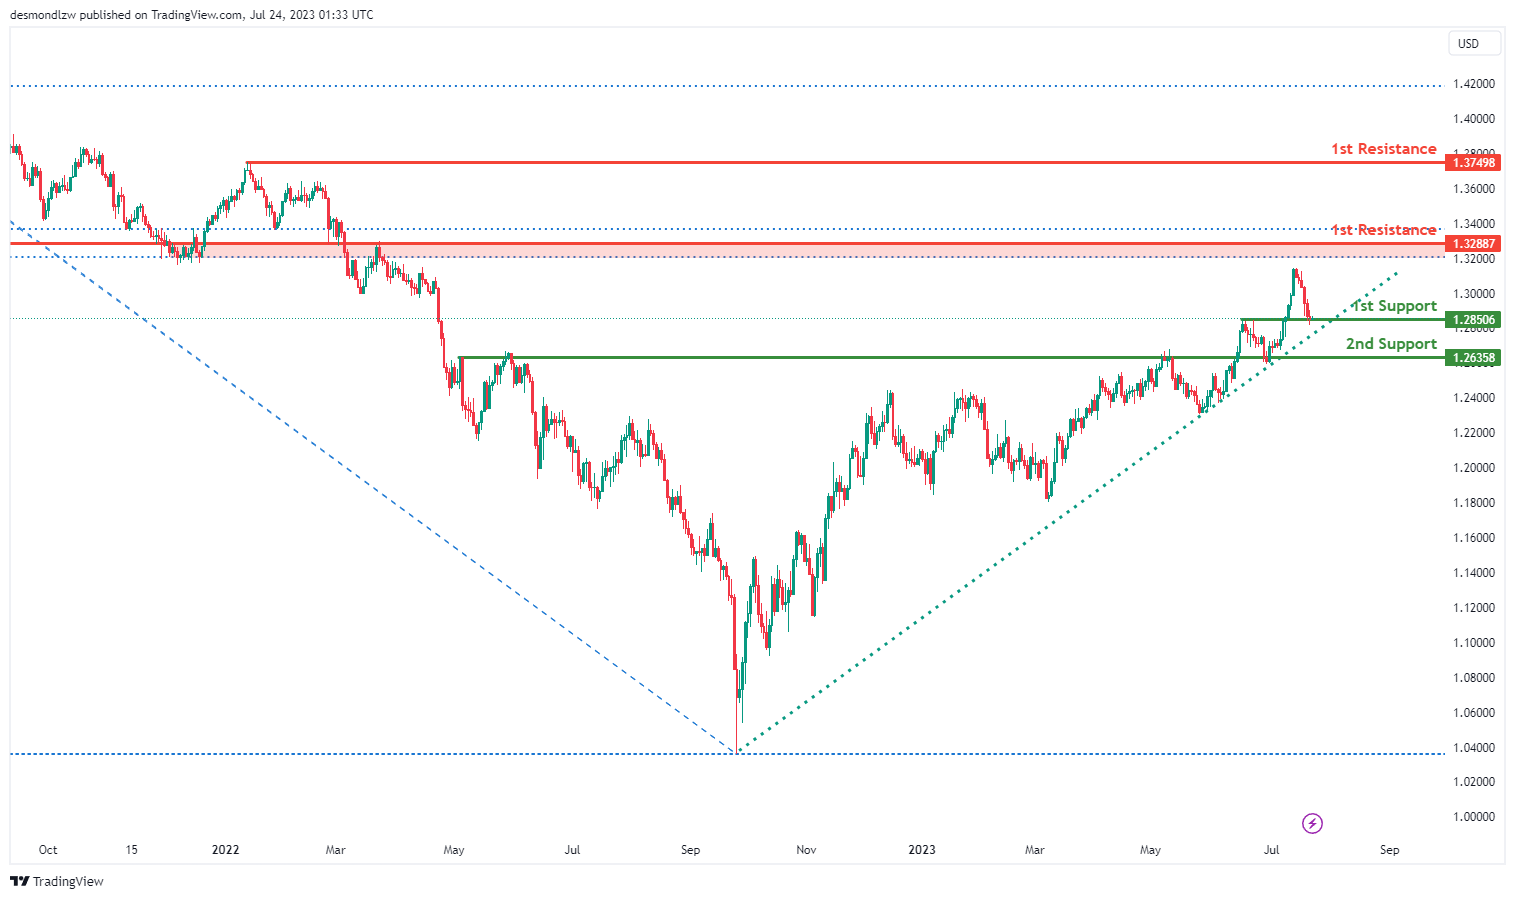
The GBP/USD chart indicates a bullish momentum, with the price above a significant ascending trend line, suggesting the potential for further upward movement.
A possible scenario is a bullish bounce off the 1st support level at 1.2850, recognized as a pullback support, leading the price towards the 1st resistance at 1.3288. This resistance level is an overlap resistance.
Additionally, the 2nd support at 1.2635 acts as another pullback support, while the 2nd resistance at 1.3749 represents a swing high resistance. These levels may play crucial roles in shaping the price’s movement.
GBP/JPY:
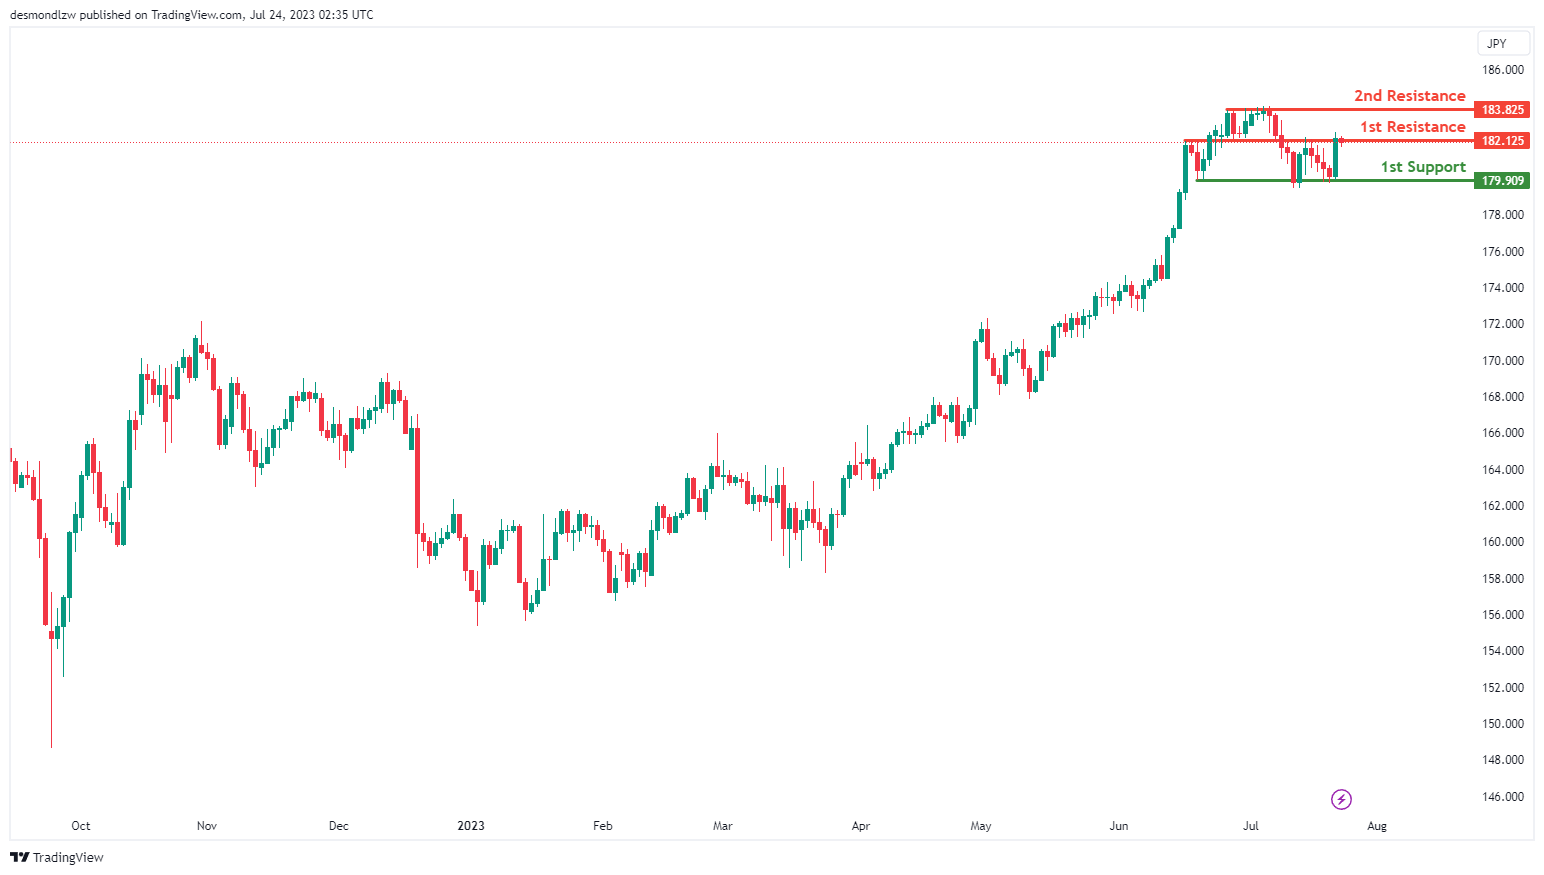
The GBP/JPY pair is currently exhibiting a bearish momentum, suggesting that the price could potentially continue its descent towards the 1st support level.
The 1st support level is situated at 179.91 and is identified as a multi-swing low support, which could offer a degree of stability against further price declines.
On the other hand, if the price starts to ascend, it could face resistance at 182.12, identified as an overlap resistance that might act as a barrier to the price’s upward movement. If the price manages to breach this, the 2nd resistance at 183.82, defined by a multi-swing high resistance, could pose the next significant hurdle to further price increases.
USD/CHF:
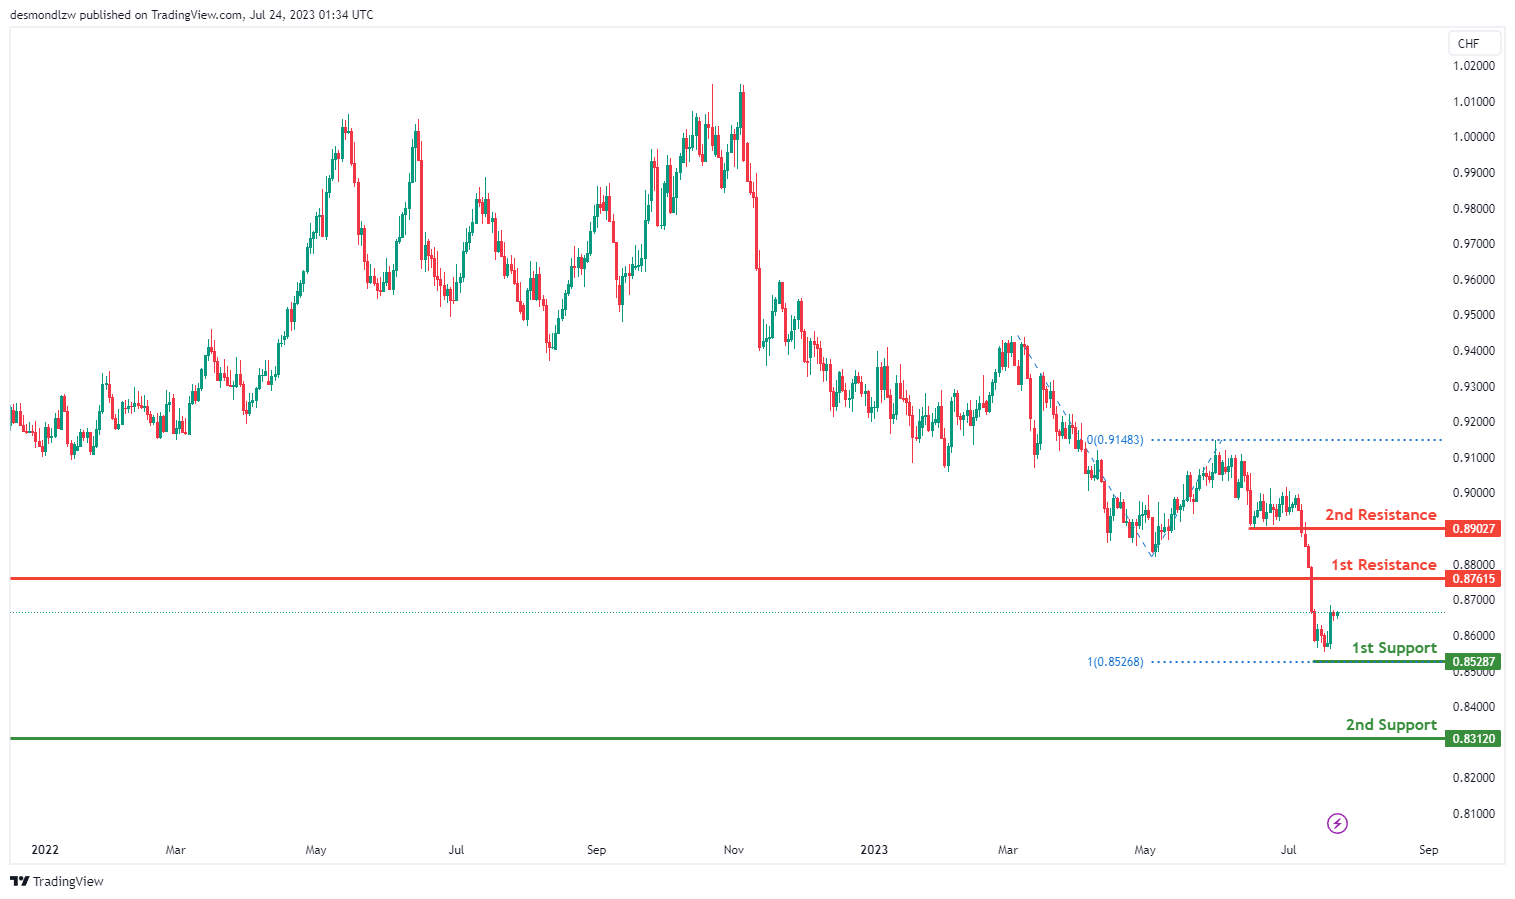
The USD/CHF chart displays a bullish momentum, suggesting the possibility of continued upward movement.
Potential scenario: The price could experience a bullish continuation towards the 1st resistance at 0.8728, identified as a pullback resistance. If the bullish trend persists, the 2nd resistance at 0.8902, which also serves as a pullback resistance, might pose another obstacle to further upward progress.
On the other hand, the 1st support at 0.8528 is significant as it aligns with the 100% Fibonacci projection, while the 2nd support at 0.8312 represents a swing low support. These support levels could act as crucial points in determining the price’s movement.
USD/JPY:
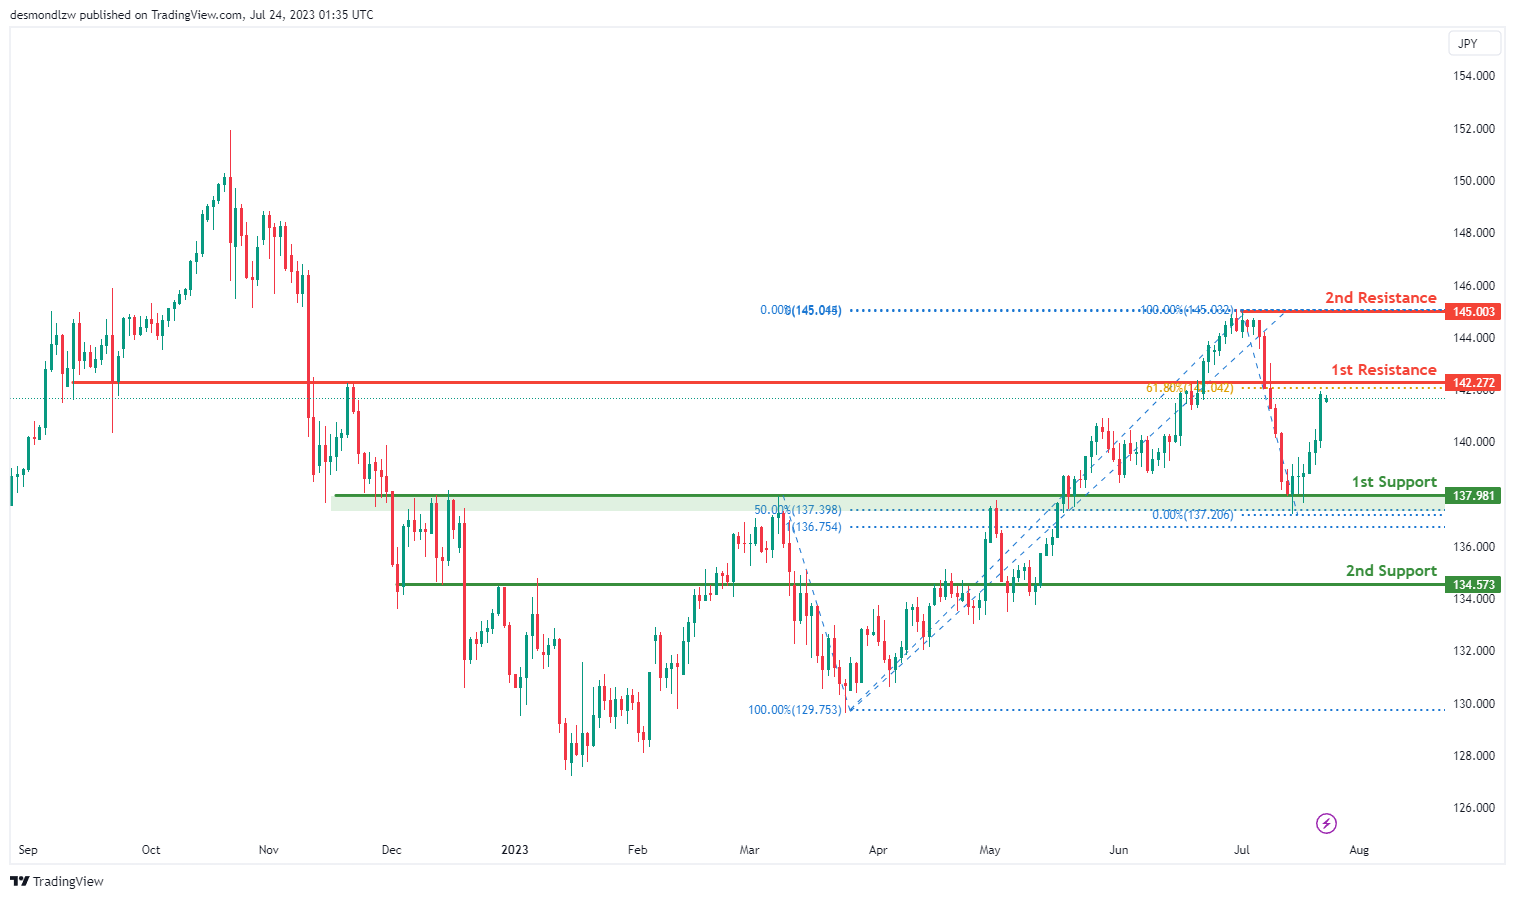
The USD/JPY chart indicates a bearish momentum, suggesting a potential bearish reaction off the 1st resistance level at 142.27, which aligns with a pullback resistance at the 61.80% Fibonacci retracement.
In the event of a downward movement, the 1st support at 137.98 holds significance as an overlap support coinciding with the 50% Fibonacci retracement and 100% Fibonacci projection, indicating a Fibonacci confluence. If the bearish trend continues, the 2nd support at 134.57, another overlap support, may provide additional stability.
On the upside, the 2nd resistance at 145.00 represents a swing high resistance. These support and resistance levels are crucial in determining the price’s potential movement.
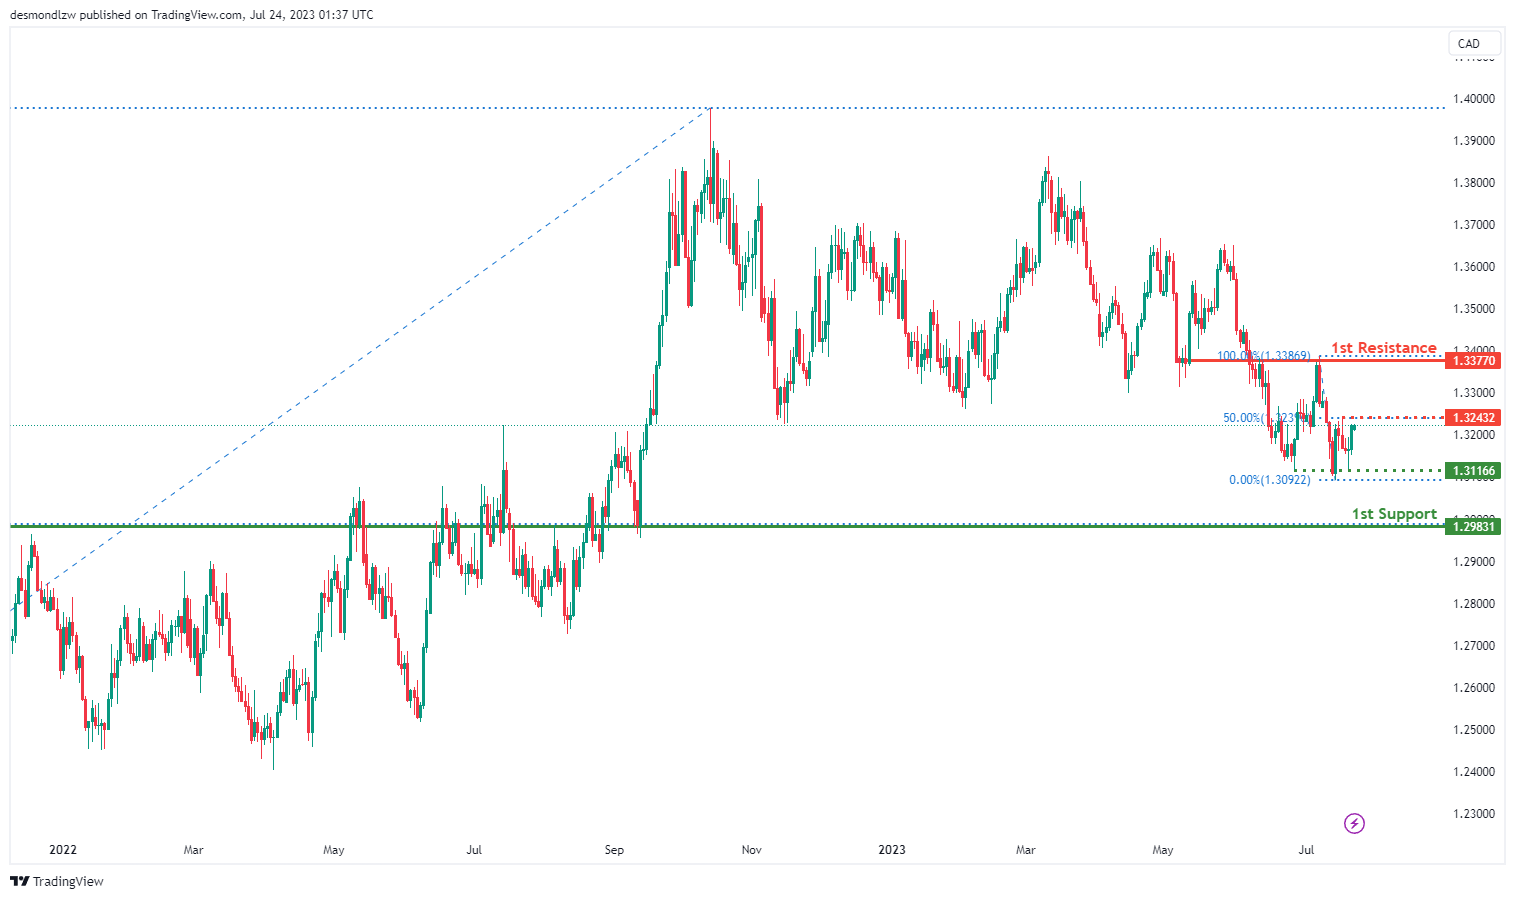
USD/CAD:
The USD/CAD chart exhibits a bullish momentum, indicating a potential continuation of the upward movement towards the 1st resistance level at 1.3377, which is an overlap resistance.
In case of a retracement, the 1st support at 1.2983 acts as an overlap support, and there is an additional intermediate support also at 1.2983, coinciding with a multi-swing low support, providing a strong floor for the price.
On the upside, the intermediate resistance at 1.3116 corresponds to the 50% Fibonacci retracement, adding to its significance as a potential barrier. These support and resistance levels are essential in evaluating the potential direction of the price.
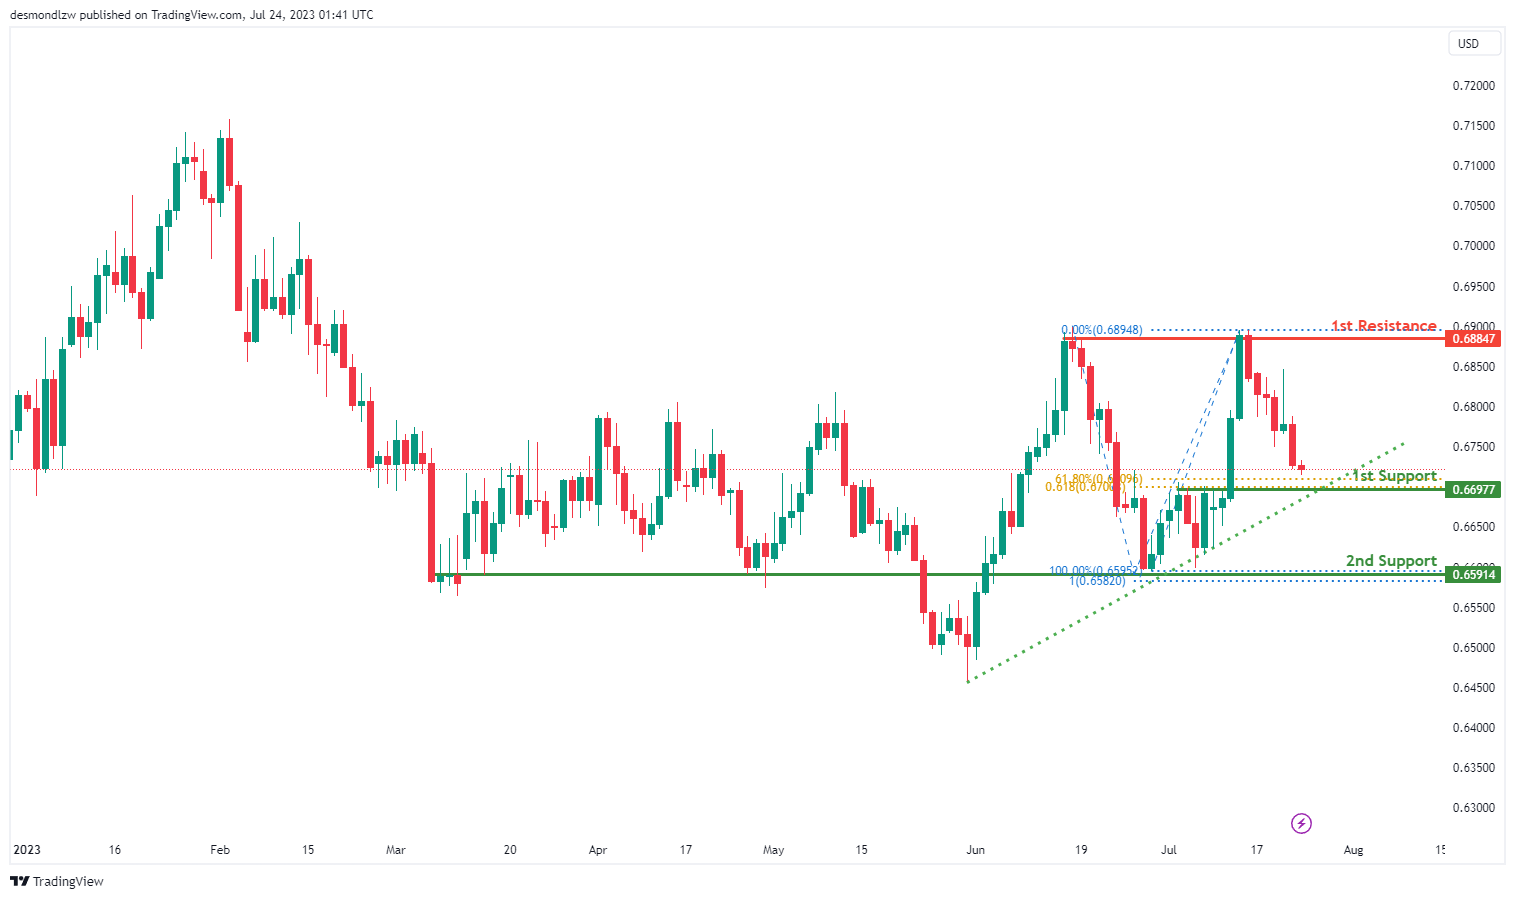
AUD/USD:
The AUD/USD chart demonstrates a bullish momentum, with the price above a major ascending trend line, suggesting the potential for further upward movement.
In case of a retracement, the 1st support at 0.6697 is a pullback support, aligning with both the 61.80% Fibonacci retracement and the 61.80% Fibonacci projection, indicating strong Fibonacci confluence. Additionally, the 2nd support at 0.6591 serves as an overlap support, coinciding with the 100% Fibonacci projection, providing further reinforcement.
On the upside, the 1st resistance at 0.6884 represents a multi-swing high resistance level, which might pose a challenge to the price’s upward progress. These support and resistance levels play a crucial role in evaluating potential price movements.
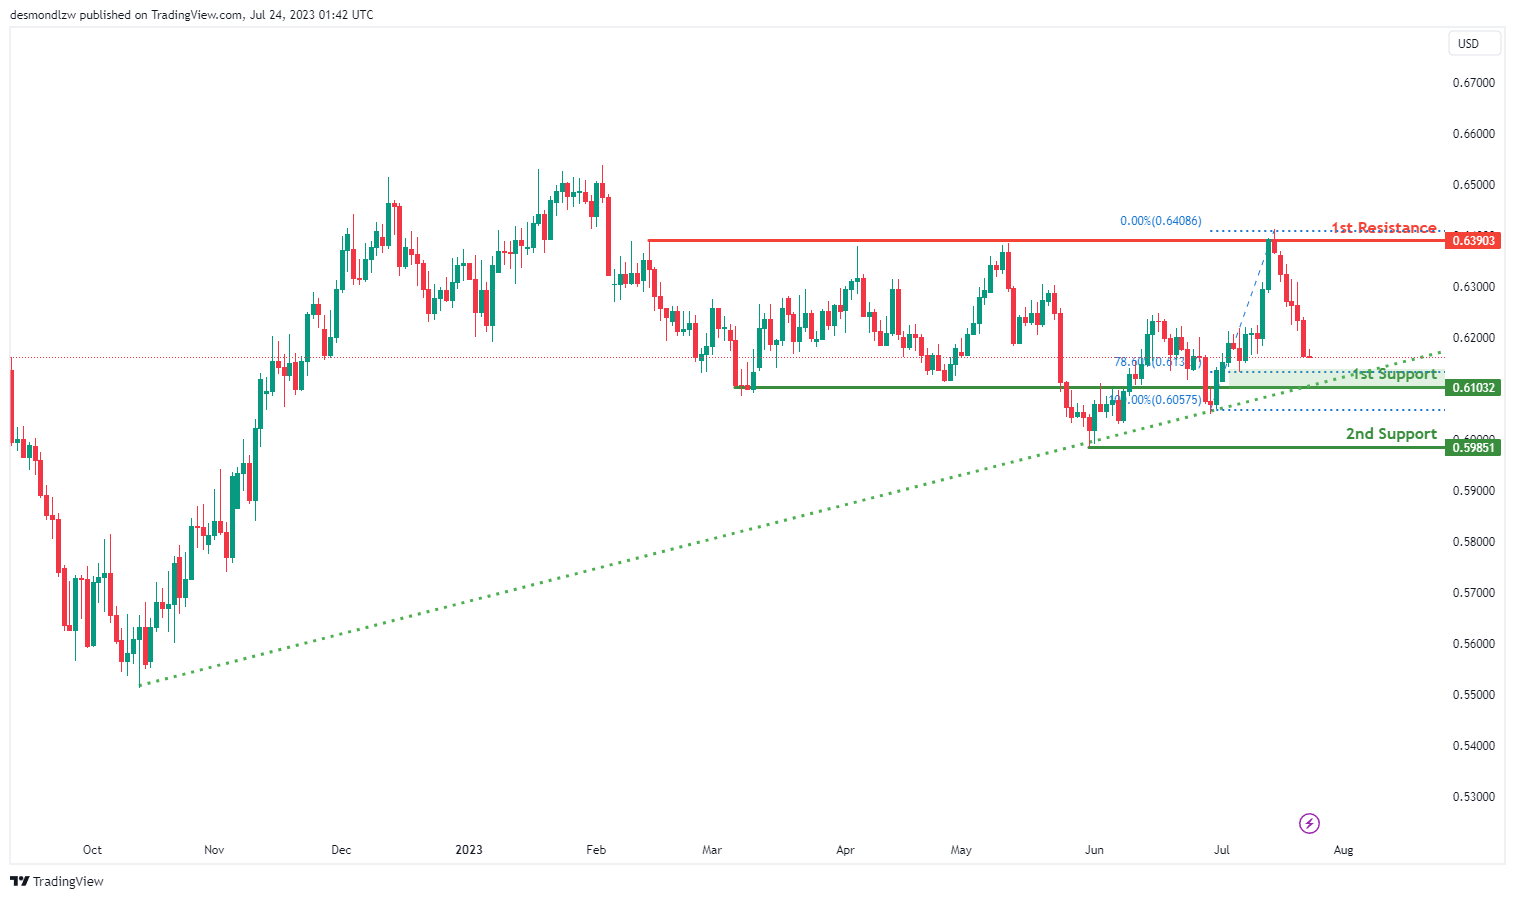
NZD/USD
The AUD/USD chart reflects a bullish momentum as the price remains above a major ascending trend line, suggesting the potential for further upward movement.
If there is a retracement, the 1st support at 0.6103 acts as a pullback support, coinciding with the 78.60% Fibonacci retracement level. Additionally, the 2nd support at 0.5985 is a swing low support.
On the upside, the 1st resistance at 0.6390 represents a significant multi-swing high resistance level, potentially impeding further upward progress. These support and resistance levels play a crucial role in assessing potential price movements.
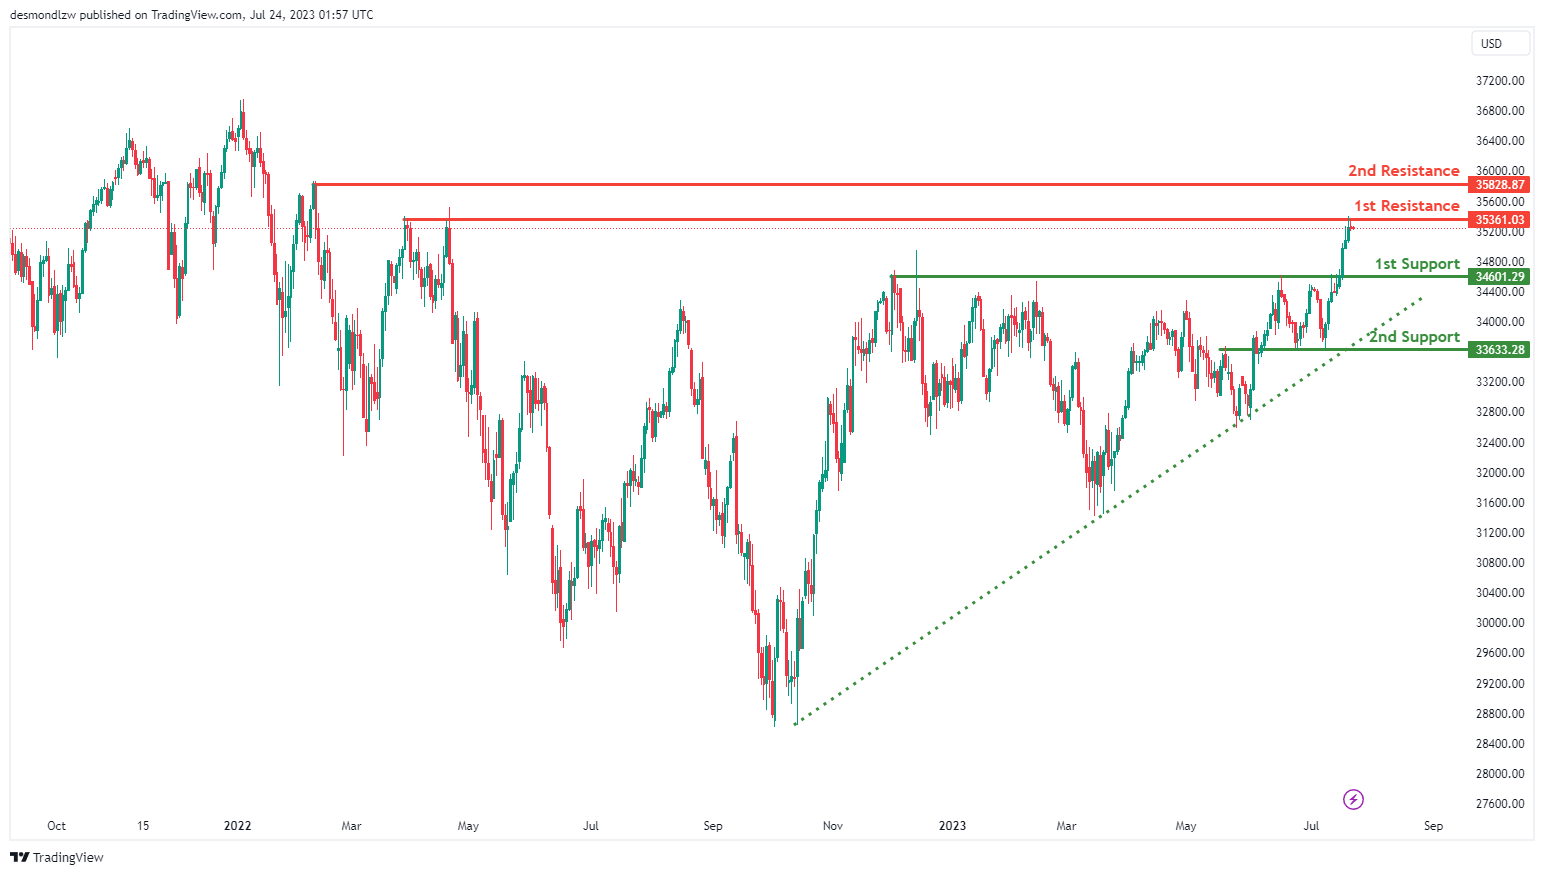
DJ30:
The DJ30 (Dow Jones Industrial Average) is currently displaying a bullish momentum, with the price positioned above a major ascending trend line, suggesting further bullish momentum could be expected.
In the short term, the price could potentially drop further to the 1st support at 34601.29, which is valued for its pullback support property. After reaching this level, the price might bounce back and rise towards the 1st resistance at 35361.03, characterized by its multi-swing high resistance.
If the price slips below the 1st support, the 2nd support level at 33633.28, an overlap support, could provide a safety net. On the other hand, if the price breaks past the 1st resistance, it could encounter the 2nd resistance at 35828.87. This resistance level is significant due to its swing high resistance attribute.
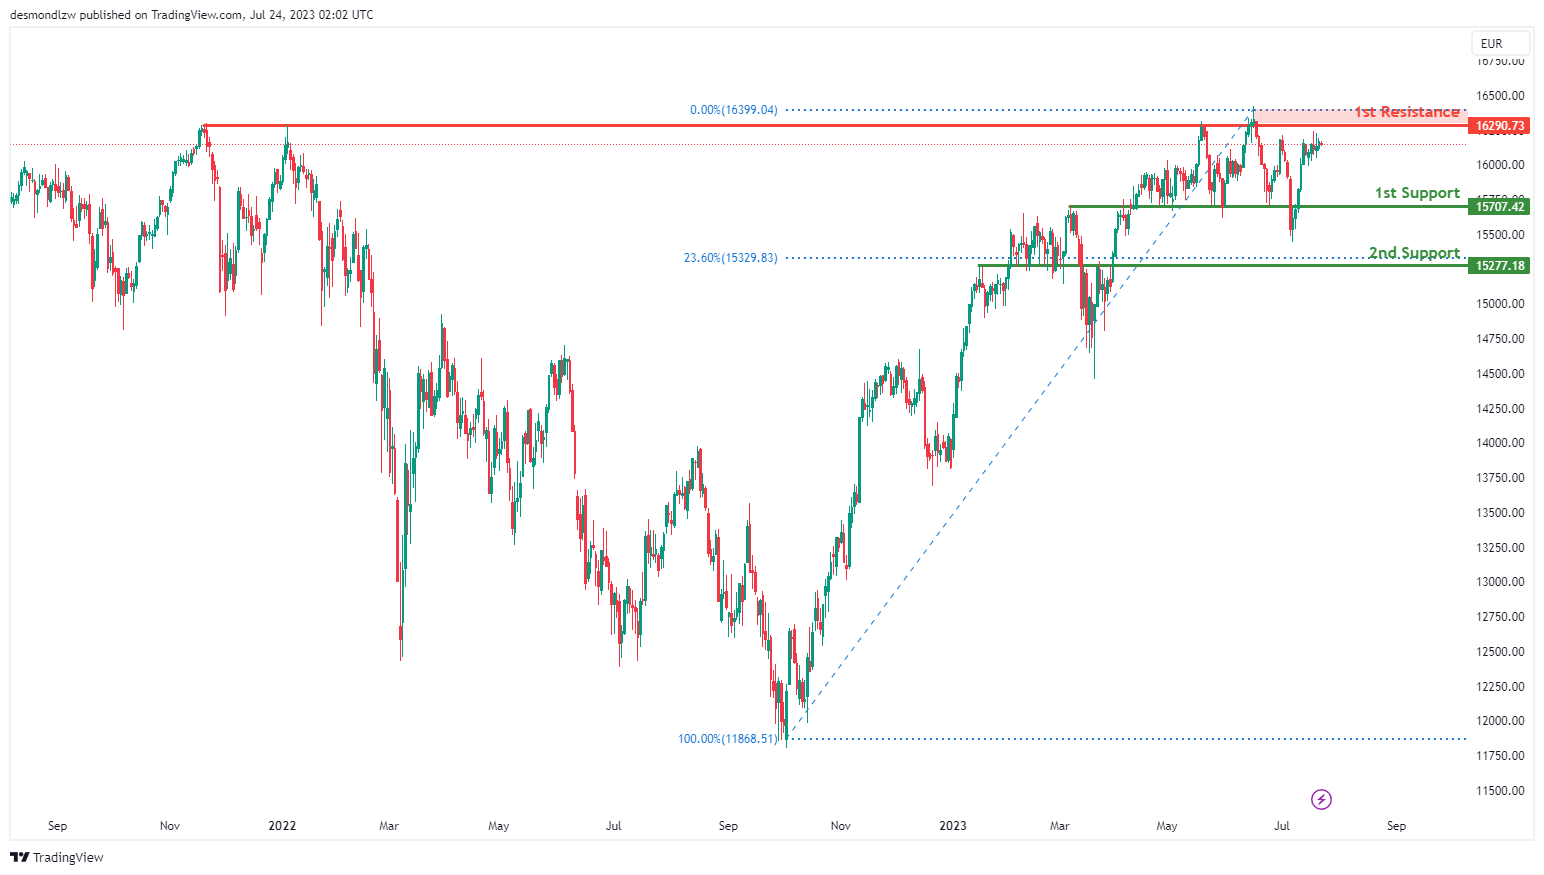
GER30:
The GER30 (DAX) chartis currently showing a bearish momentum on the chart. The price could potentially make a bearish reaction off the 1st resistance level at 16290.73, characterized by its multi-swing high resistance, and descend to the 1st support level.
The 1st support level is found at 15707.42, which is valuable due to its overlap support property. If the price breaks through this level, it could continue its downward trajectory to the 2nd support at 15277.18. This support level is significant due to its overlap support feature and its alignment with the 23.60% Fibonacci retracement level.
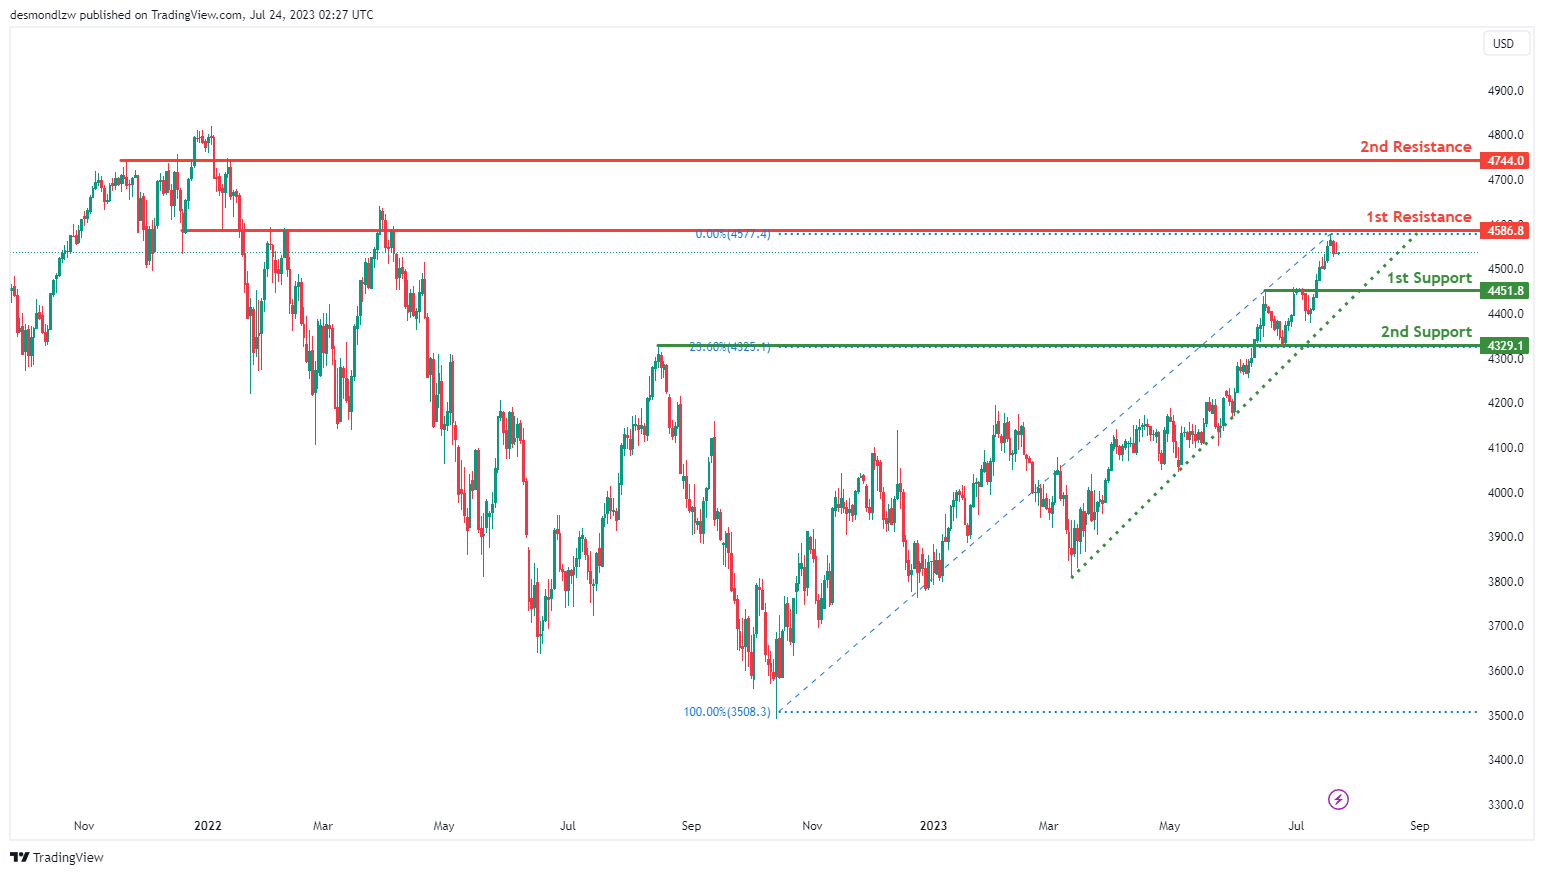
US500
The US500 (S&P 500) chart currently demonstrates a bullish momentum, with the price trending above a major ascending line, suggesting further bullish activity could be forthcoming.
However, in the short term, the price could potentially drop further to the 1st support at 4451.8, which is appreciated for its pullback support attributes. From this level, the price could bounce back and rise towards the 1st resistance at 4586.8, noted for its overlap resistance characteristics.
If the price breaches the 1st support, the 2nd support at 4328.9, which is an overlap support aligned with the 23.60% Fibonacci retracement, could provide a safety net. Conversely, if the price surpasses the 1st resistance, the 2nd resistance at 4744.0, another overlap resistance, could present the next significant barrier.
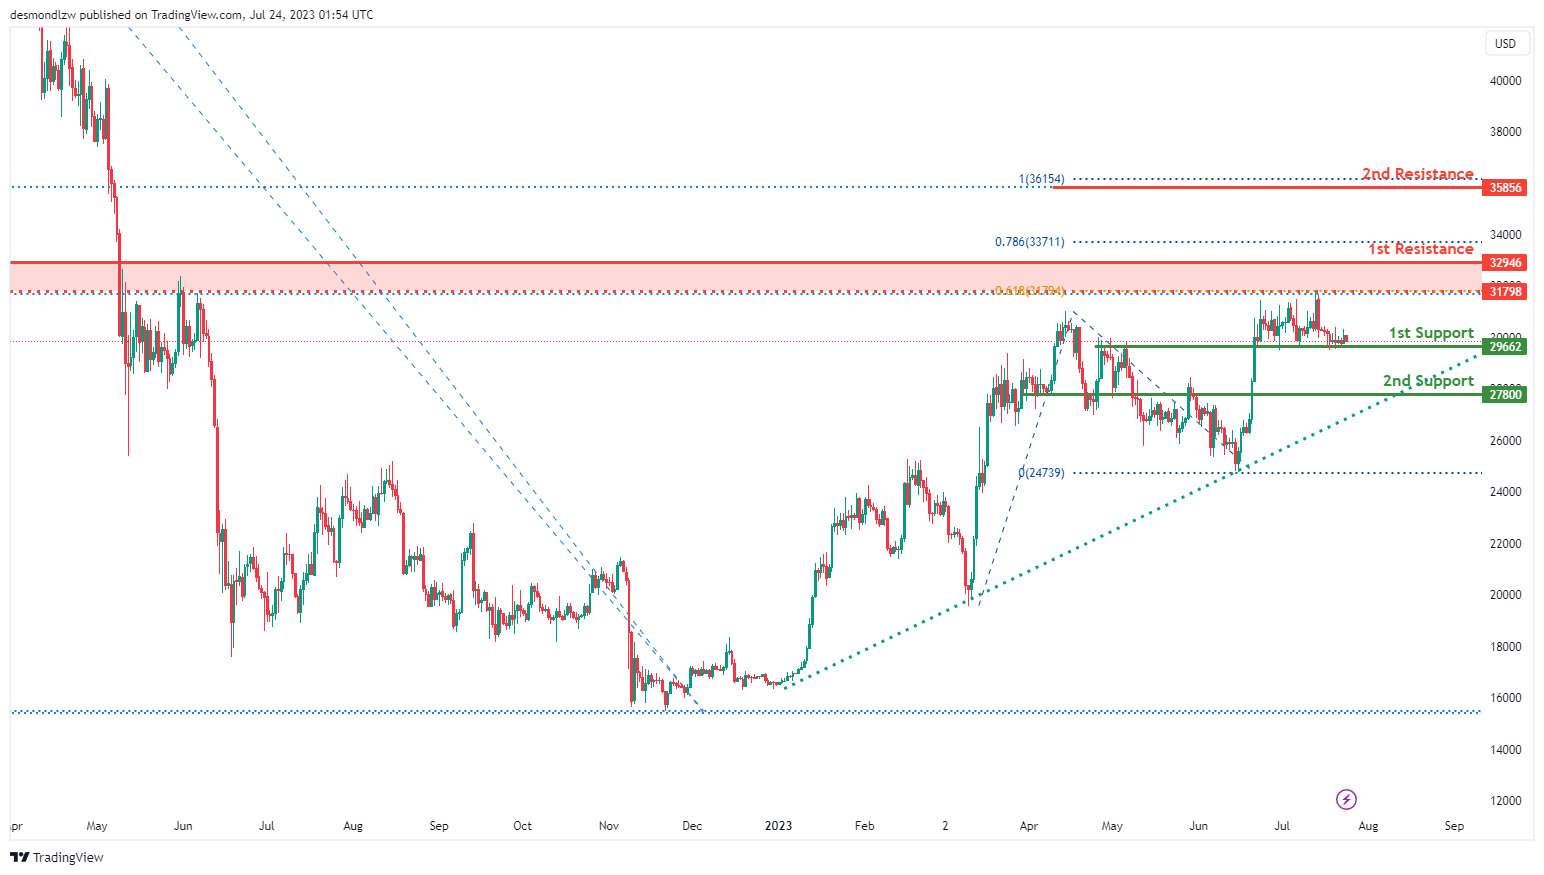
BTC/USD:
The BTC/USD instrument is currently exhibiting a bullish momentum, largely because the price is above a major ascending trend line, suggesting that further bullish momentum could be anticipated.
The price might potentially make a bullish bounce off the 1st support, situated at 29662, which is valued for its overlap support characteristic, and then head towards the 1st resistance. This resistance is located at 32946 and is significant due to its multi-swing high resistance feature and its position at the 78.60% Fibonacci retracement level.
If the price falls below the 1st support, the 2nd support at 27800, another overlap support, could provide stability. On the other hand, if the price breaks the 1st resistance, it could encounter the 2nd resistance at 35856. This level acts as a swing high resistance and aligns with the 38.20% Fibonacci retracement and 100% Fibonacci projection, indicating a Fibonacci confluence.
Additionally, an intermediate resistance is observed at 31798. It is characterized as an overlap resistance and matches the 50% Fibonacci retracement and 61.80% Fibonacci projection, indicating another Fibonacci confluence.
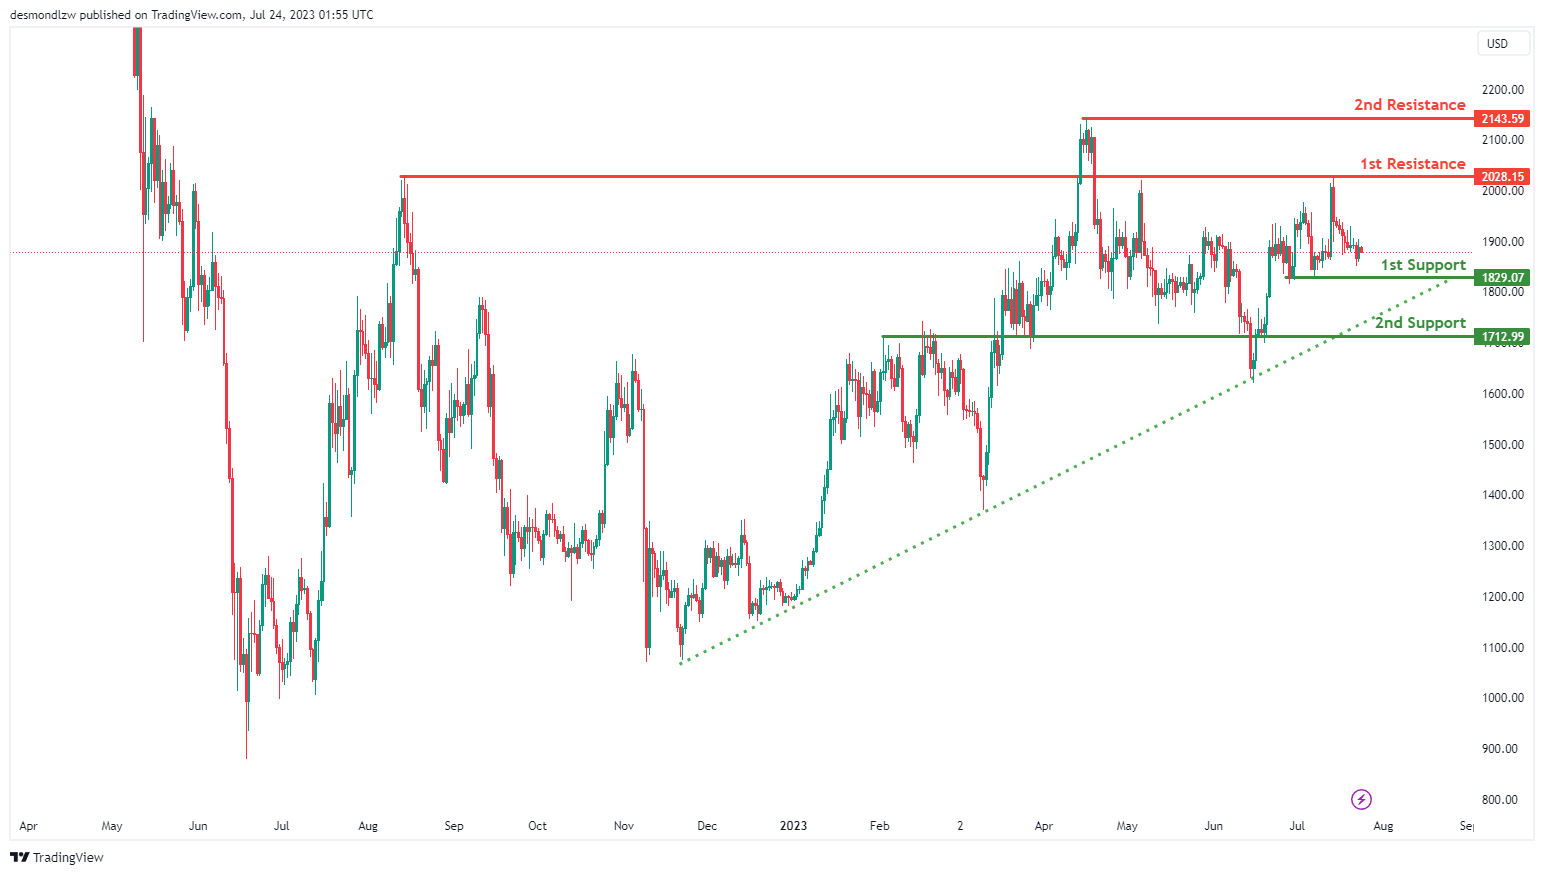
ETH/USD:
The ETH/USD instrument is currently displaying a bullish momentum. The price is above a major ascending trend line, suggesting potential further bullish movements.
There’s a possibility that the price could make a bullish bounce off the 1st support level, located at 1829.07. This level is beneficial due to its multi-swing low support feature, and it might then head towards the 1st resistance. The 1st resistance is at 2028.15 and is significant due to its overlap resistance property.
If the price dips below the 1st support, the 2nd support at 1712.99, an overlap support, could provide a backstop. Conversely, if the price surpasses the 1st resistance, the 2nd resistance at 2143.59, acting as a swing high resistance, could present the next hurdle for upward price movement.
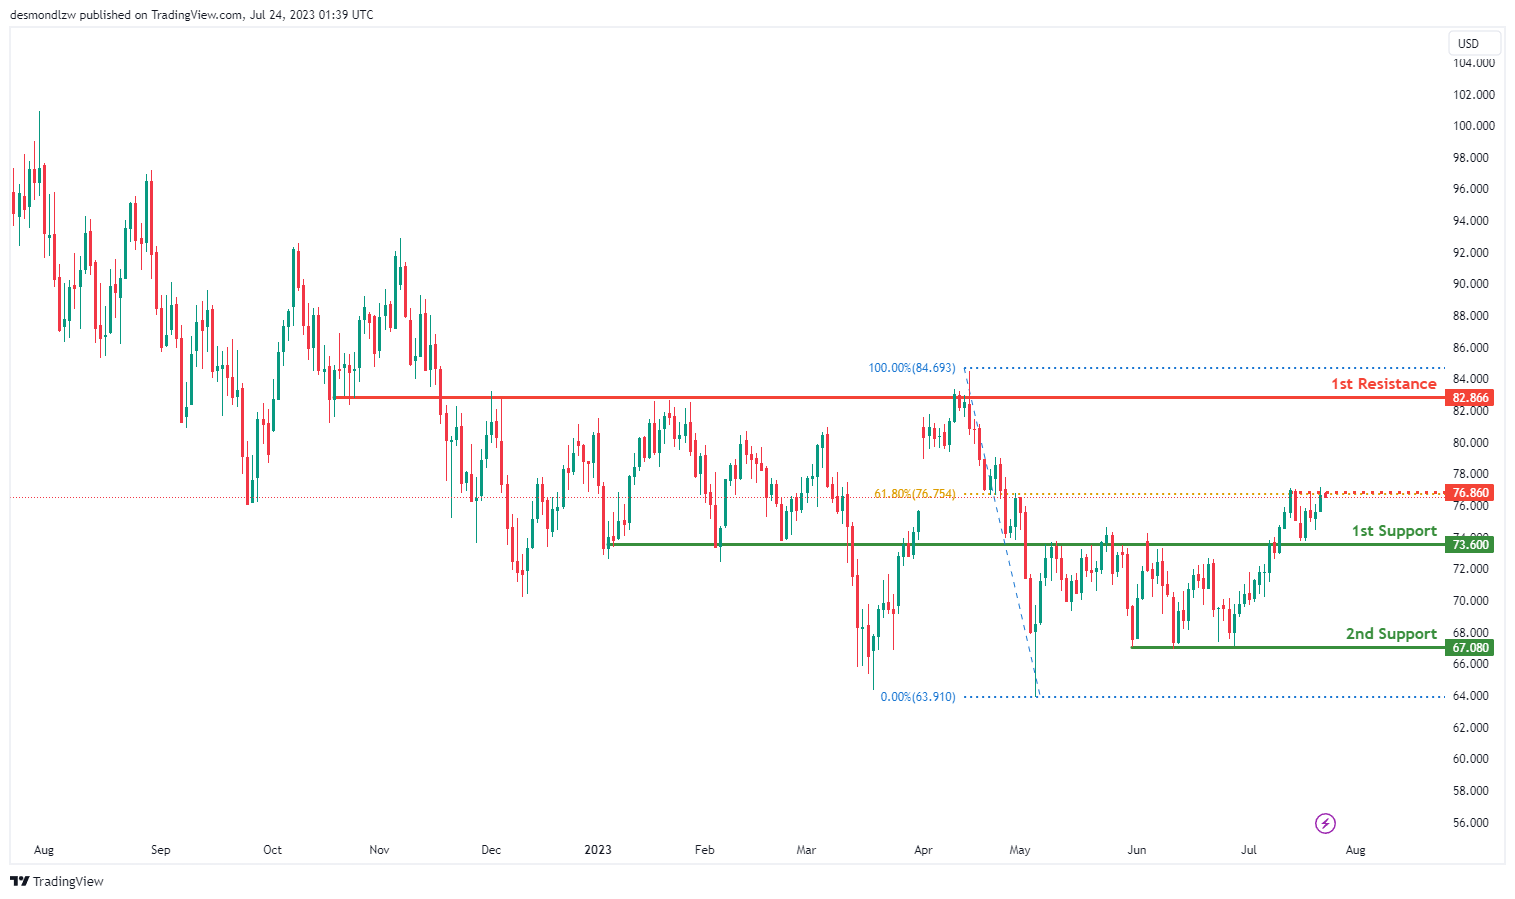
WTI/USD:
The WTI (West Texas Intermediate) chart shows a bullish momentum, indicating the potential for further upward movement.
For potential upward continuation, the 1st support at 73.60 serves as an overlap support, while the 2nd support at 67.08 is a multi-swing low support level.
On the upside, the 1st resistance at 82.86 represents a pullback resistance, and the intermediate resistance at 76.86 aligns with the 61.80% Fibonacci retracement level, adding to its significance. These support and resistance levels are important factors to consider when assessing possible price trends.
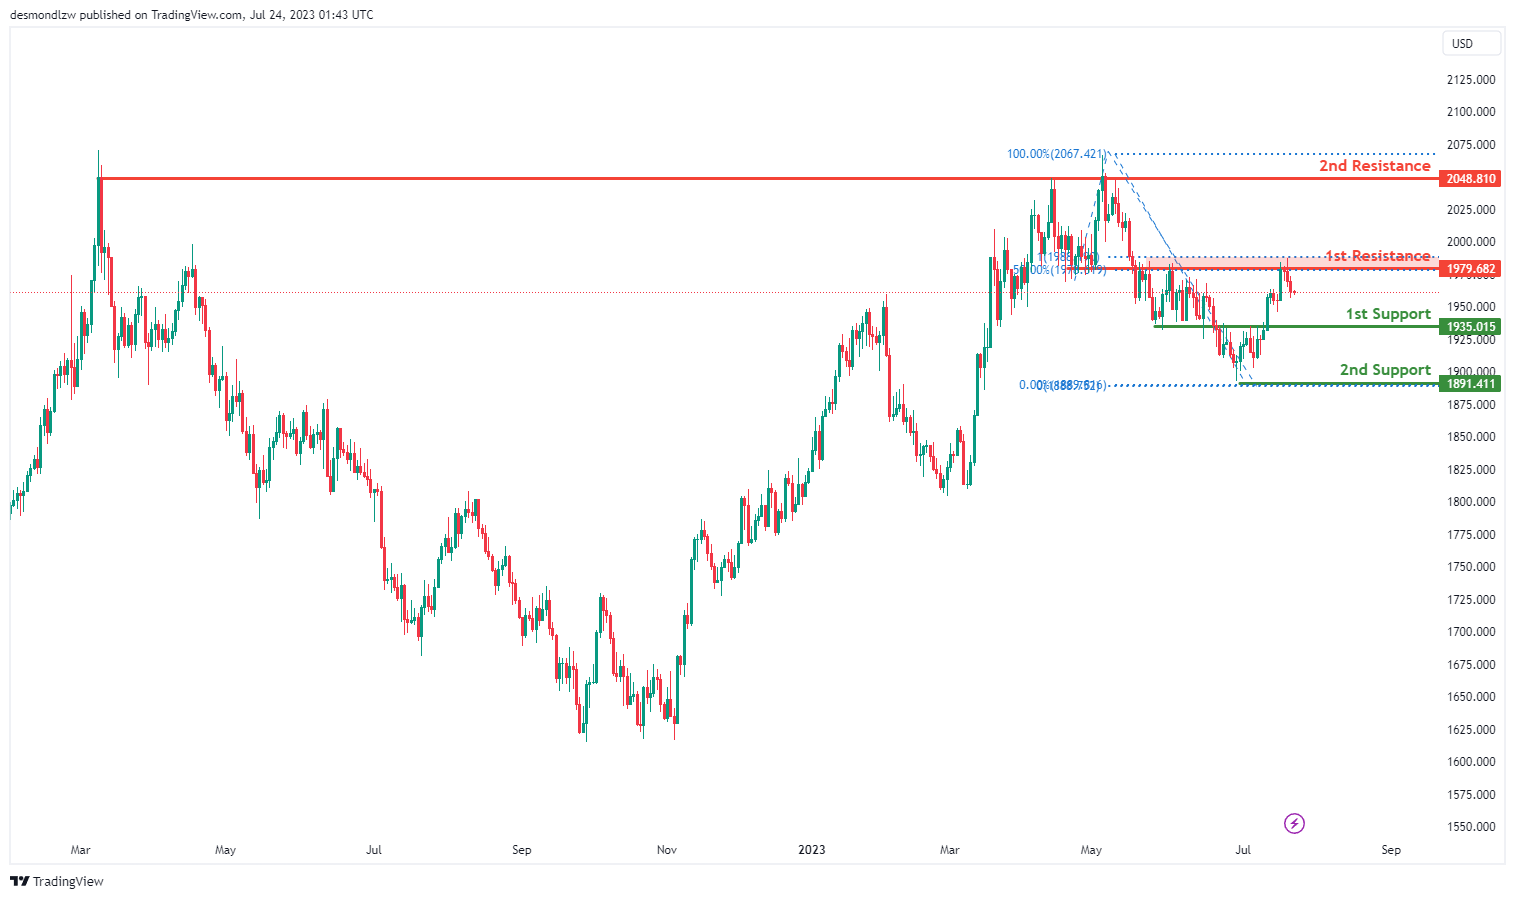
XAU/USD (GOLD):
The XAU/USD chart shows a bearish momentum, suggesting a potential continuation of the downward movement.
For a possible bearish continuation, the 1st support at 1935.01 acts as a pullback support, while the 2nd support at 1891.41 represents a swing low support level.
On the upside, the 1st resistance at 1979.68 is an overlap resistance, coinciding with the 50% and 100% Fibonacci retracement levels. Additionally, the 2nd resistance at 2048.81 serves as a multi-swing high resistance. These support and resistance levels are crucial considerations for assessing the price direction.


