
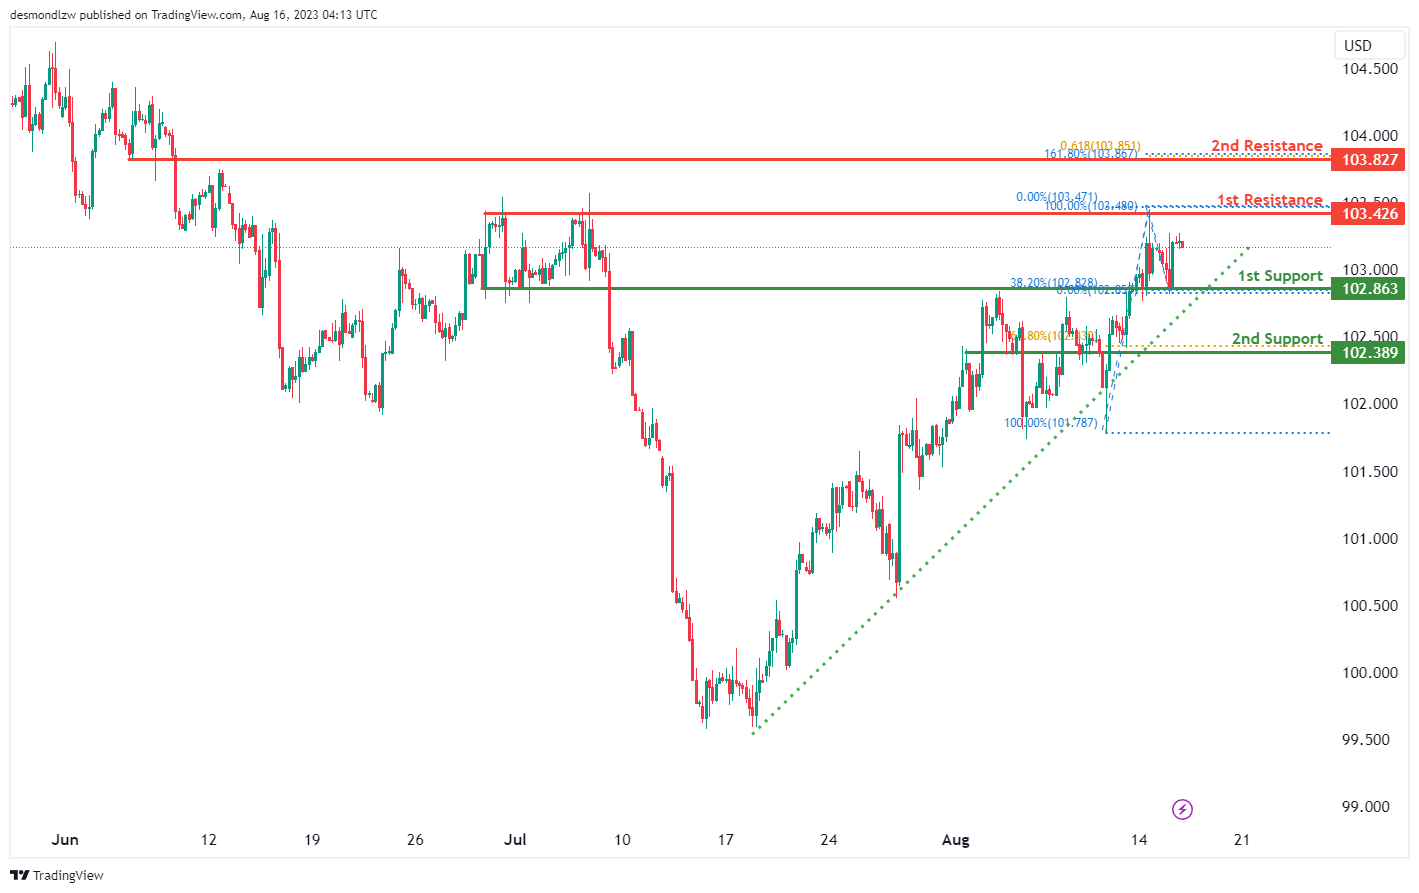
DXY:
The current trend of the DXY indicates a bullish sentiment, supported by its position above a major ascending trend line. This suggests that there may be further upward momentum in the future.
There is a possibility that the price will initially decline towards the 1st support level at 102.86. This support level is significant as it is an overlap support and also corresponds to the 38.20% Fibonacci retracement level.
In the event of a rebound, the 1st resistance level at 103.42 is notable as it is an overlap resistance. Additionally, the 2nd resistance at 103.82 is also a point of confluence, marked by the presence of both a 161.80% Fibonacci Extension and a 61.80% Fibonacci Projection.
Overall, the chart signals potential for further bullish movement but a downside correction is also a possibility before the upward movement resumes.
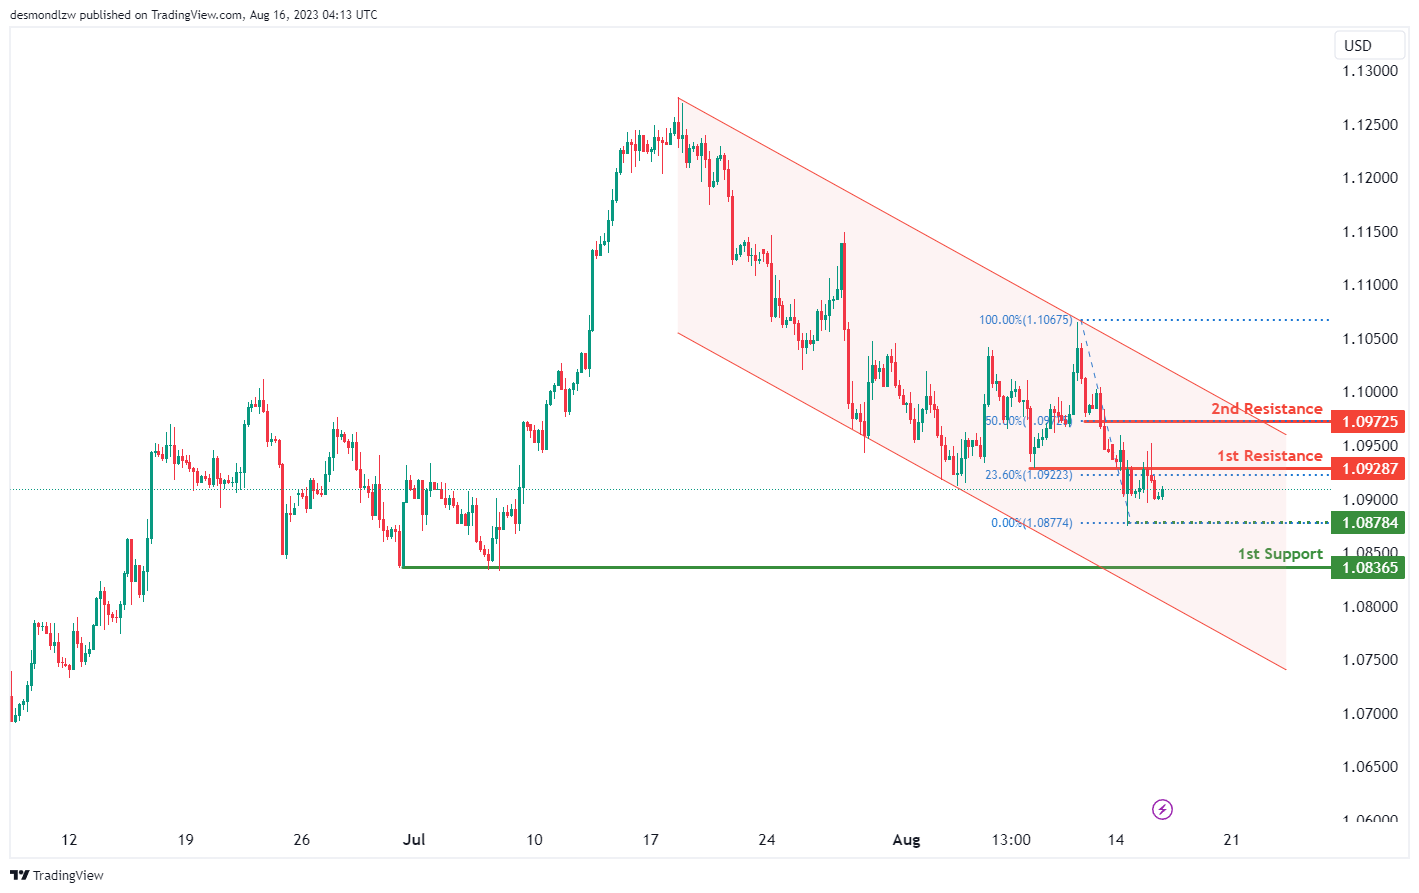
EUR/USD:
The EUR/USD chart currently exhibits a bearish momentum, evident by its position within a descending channel. This bearish channel pattern implies a potential continuation of the downward movement due to the prevailing bearish trend.
Considering this bearish sentiment, there’s a possibility of a bearish reaction occurring as the price reaches the 1st resistance level at 1.0928, followed by a potential drop towards the 1st support at 1.0836. This support level gains significance as it aligns with a multi-swing low point.
Additionally, an intermediate support level at 1.0878, corresponding to a swing low support, further reinforces the potential for a support zone.
Conversely, the presence of the 1st resistance at 1.0928 is notable due to its classification as an overlap resistance and its alignment with the 23.60% Fibonacci retracement level. Furthermore, a 2nd resistance level at 1.0972 holds significance as it corresponds to the 50% Fibonacci retracement, adding to its potential as a resistance level.
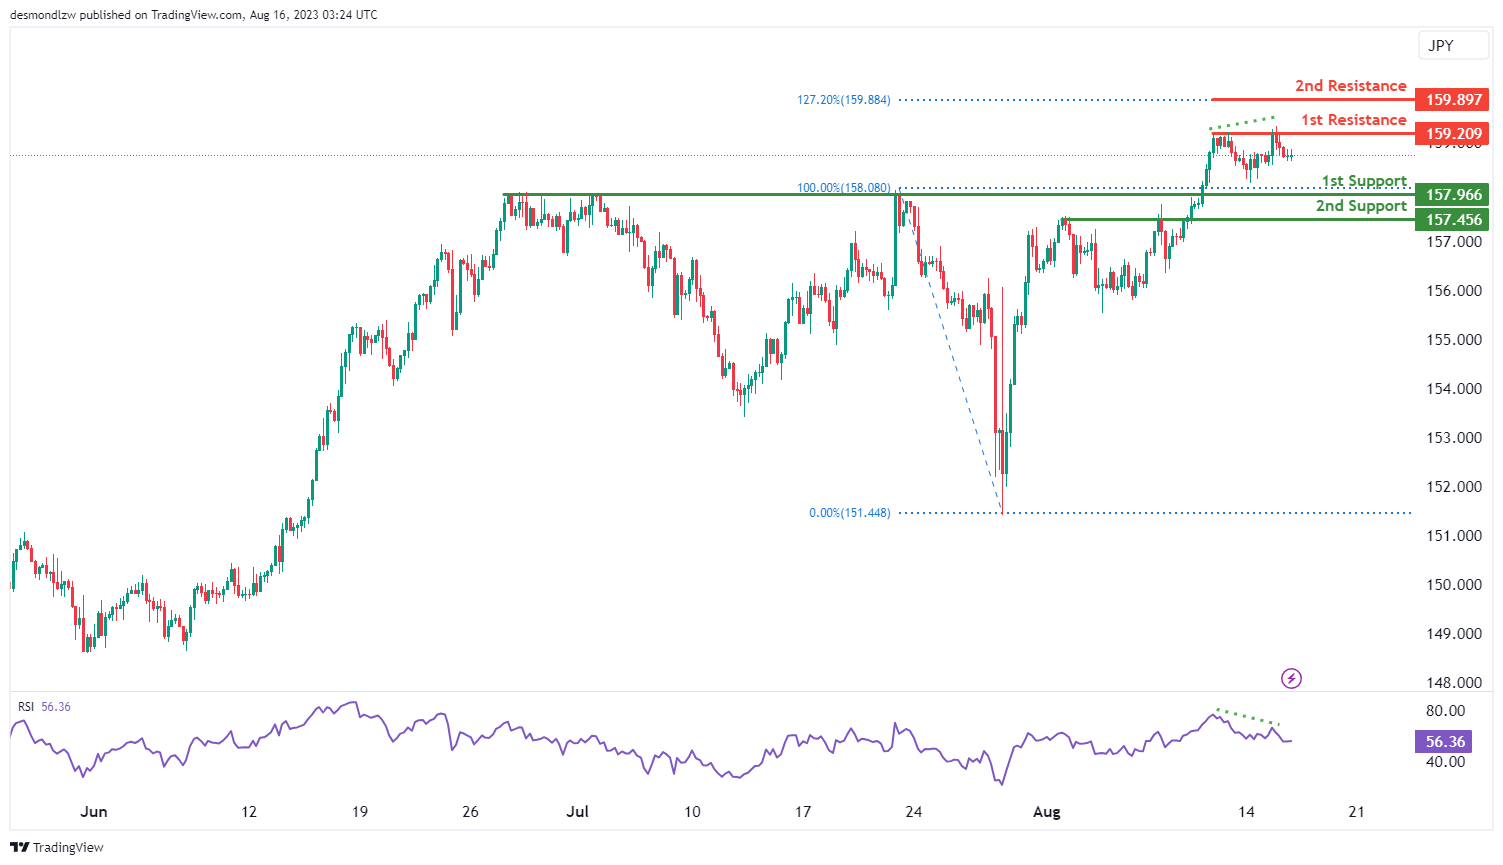
EUR/JPY:
The EUR/JPY chart currently indicates a bearish momentum, implying the potential for further downward movement. It’s conceivable that the price could experience a bearish continuation towards the 1st support level at 157.96. This support level gains significance as a pullback support, potentially influencing price action.
Additionally, the 2nd support at 157.45 further reinforces the potential for a downward move. On the resistance side, the 1st resistance at 159.20 holds importance as a multi-swing high resistance level. The 2nd resistance at 159.89 is notable due to its alignment with a 127.20% Fibonacci extension, adding to its potential impact.
Moreover, the Relative Strength Index (RSI) is exhibiting bearish divergence compared to the price, suggesting a possible upcoming reversal. This could indicate a shift in momentum from the current bearish trend.
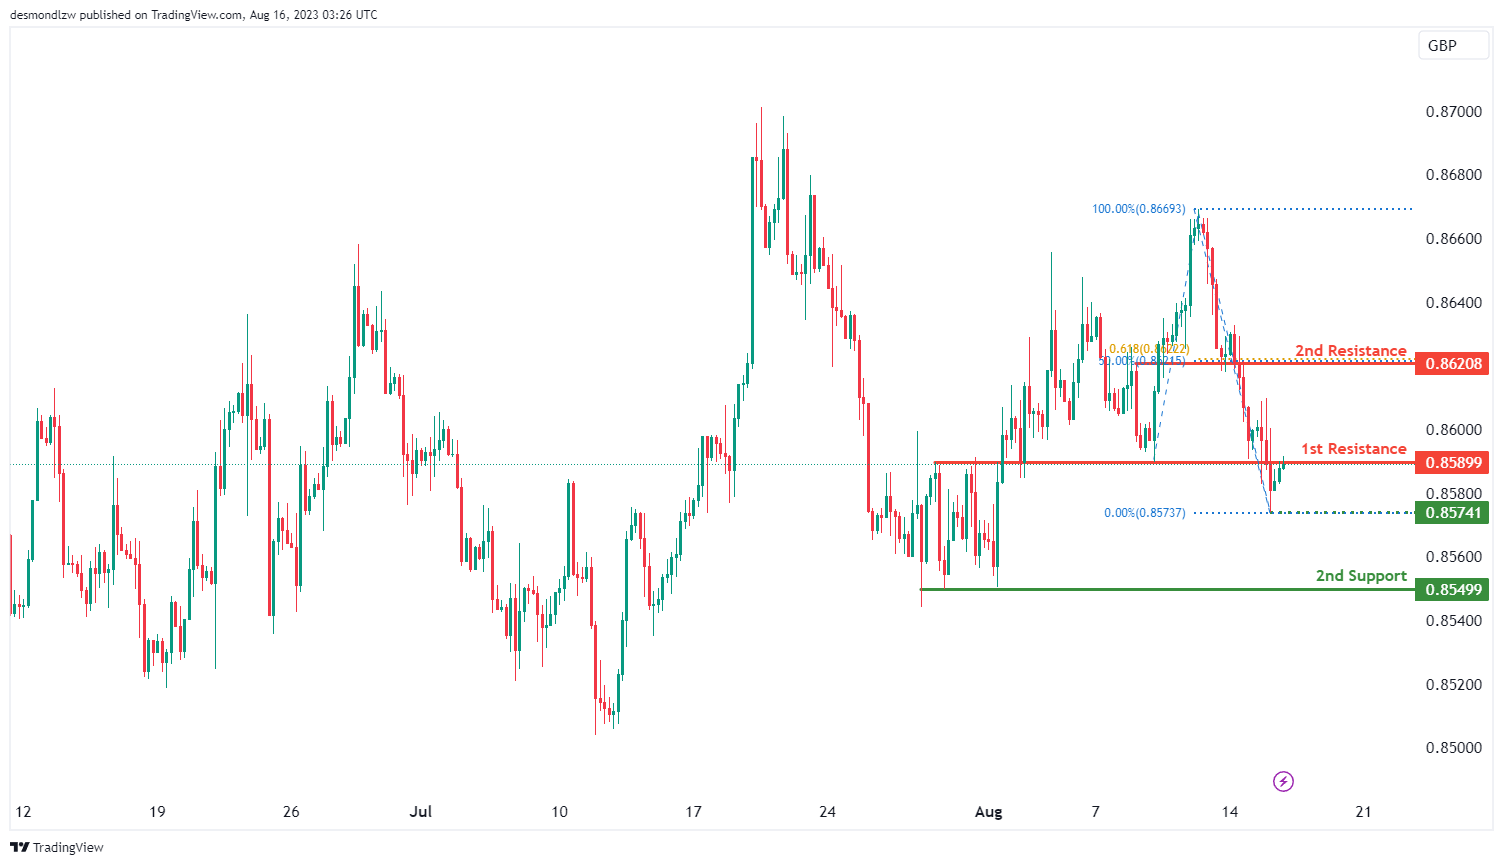
EUR/GBP:
The EUR/GBP chart currently reflects a bearish momentum, indicating a potential downward trend. Given this momentum, there is a possibility of a bearish reaction occurring upon reaching the 1st resistance level, followed by a potential drop towards the 1st support.
The 1st support level at 0.8549 is significant due to its alignment with a multi-swing low support, adding to its potential influence.
Conversely, the 1st resistance level at 0.8589 holds importance as an overlap resistance. The 2nd resistance at 0.8620 gains significance from its alignment with a 50% Fibonacci retracement and a 61.80% Fibonacci projection, suggesting a potential Fibonacci confluence.
Furthermore, an intermediate support at 0.8549 reinforces the overall support structure by aligning with a multi-swing low support.
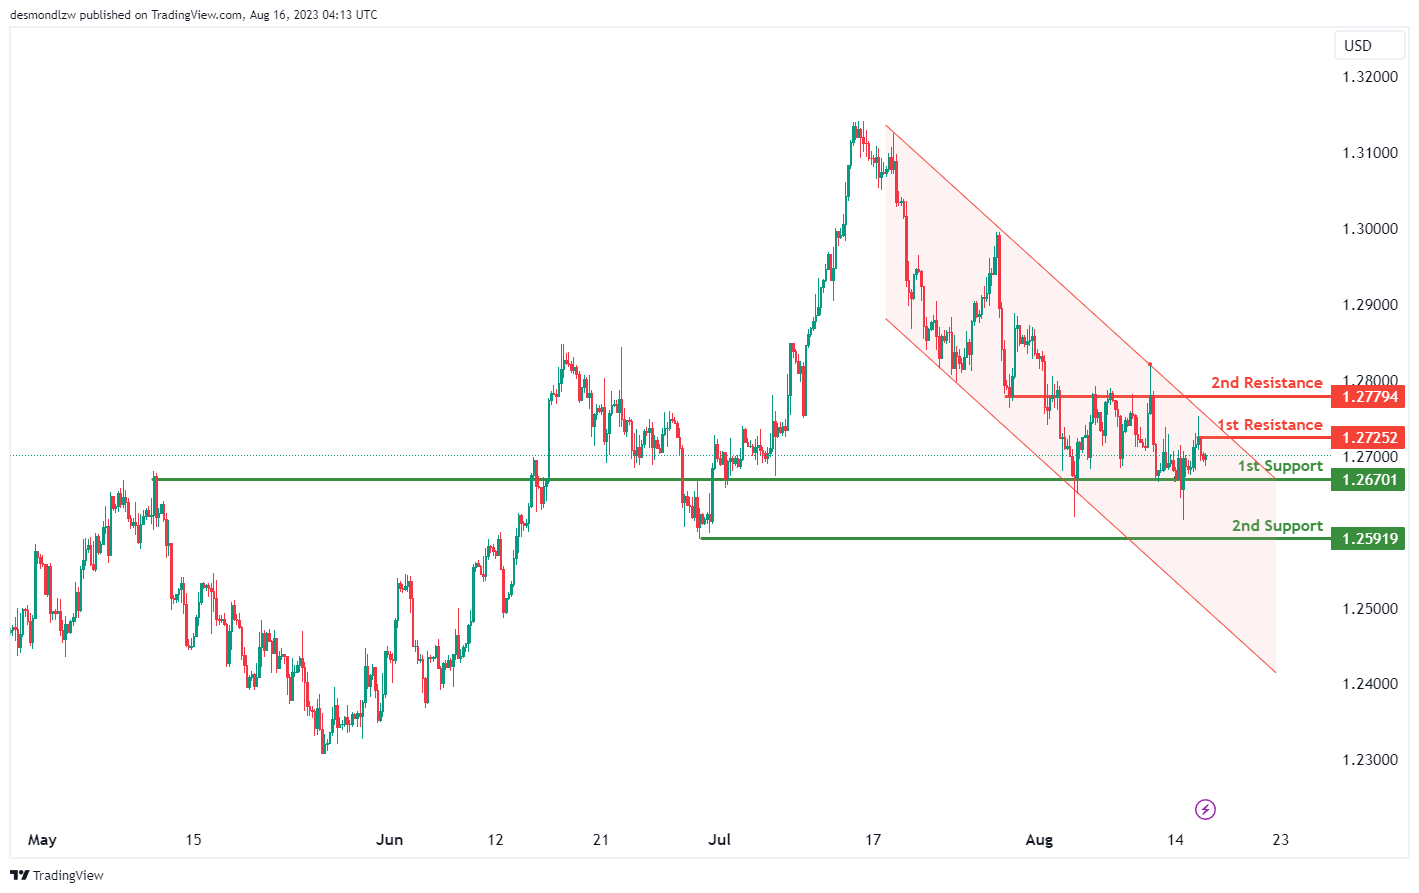
GBP/USD:
The USD/GBP chart currently demonstrates a bearish momentum, evident by its position within a descending channel. This bearish channel pattern suggests a potential continuation of the downward movement due to the existing bearish trend.
Given this bearish sentiment, there’s a likelihood of a bearish continuation as the price moves towards the 1st support level at 1.2670, potentially encountering an overlap support.
Additionally, the 2nd support level at 1.2591 adds to the support structure and gains significance as it aligns with a swing low point.
On the resistance side, the 1st resistance at 1.2725 and the 2nd resistance at 1.2779 are noteworthy. While the specific reasons for the 1st resistance are not mentioned, the 2nd resistance is categorized as an overlap resistance.
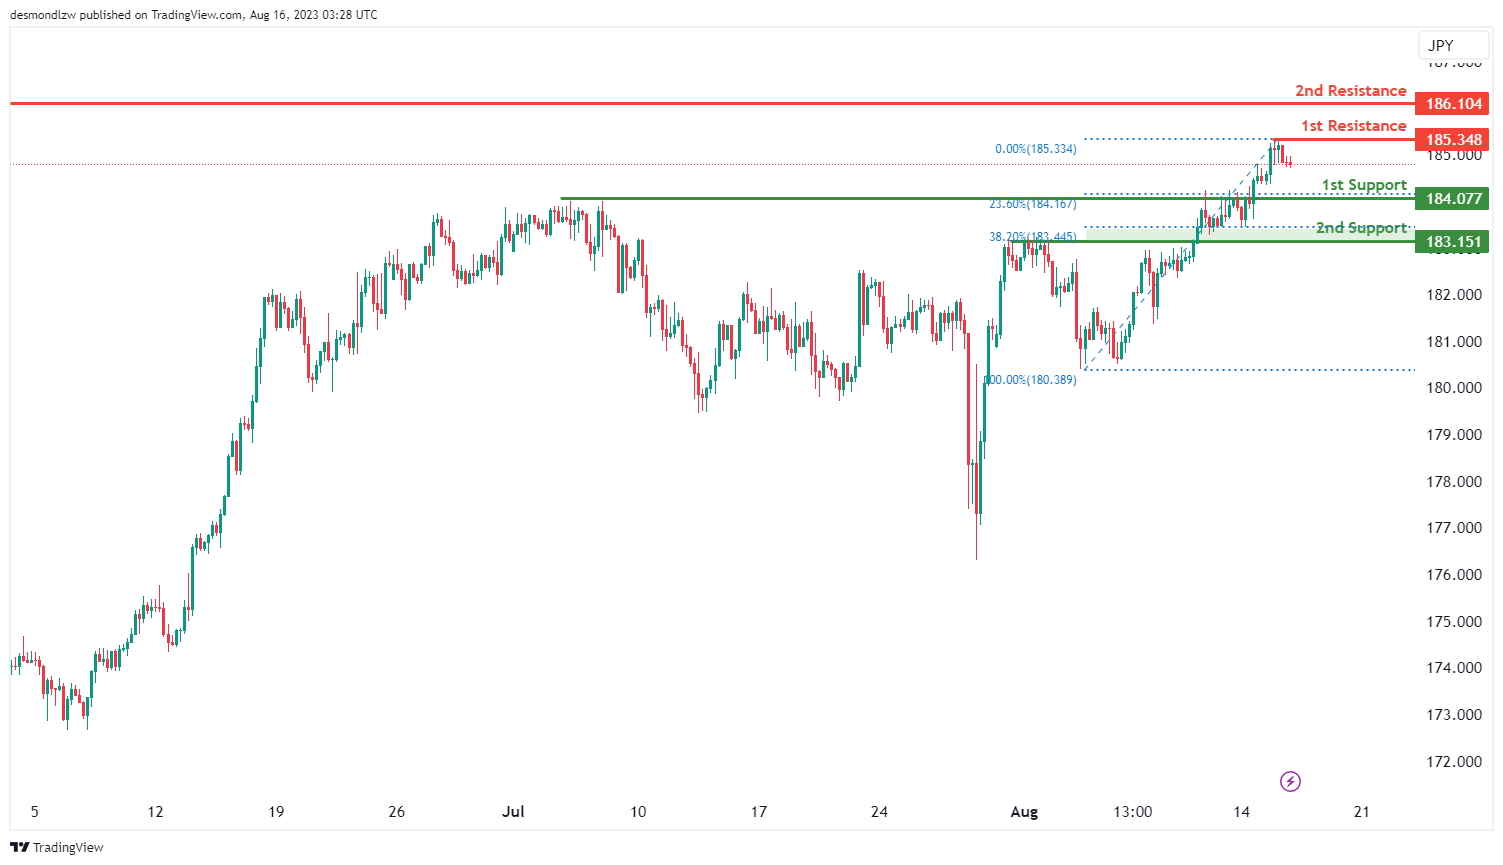
GBP/JPY:
The GBP/JPY chart currently exhibits a bearish momentum, indicating a potential downward trend. In light of this momentum, there is a scenario where the price might continue its bearish movement towards the 1st support level.
The 1st support at 184.07 gains significance as a pullback support, further reinforced by its alignment with a 23.60% Fibonacci retracement. The 2nd support at 183.15 also holds importance due to its role as a pullback support, along with its alignment with a 38.20% Fibonacci retracement.
Conversely, the 1st resistance level at 185.34 is notable as a swing high resistance, and its significance is enhanced by its alignment with a 161.80% Fibonacci extension. The 2nd resistance at 186.10 carries strength as a swing high resistance, potentially influencing price movements.
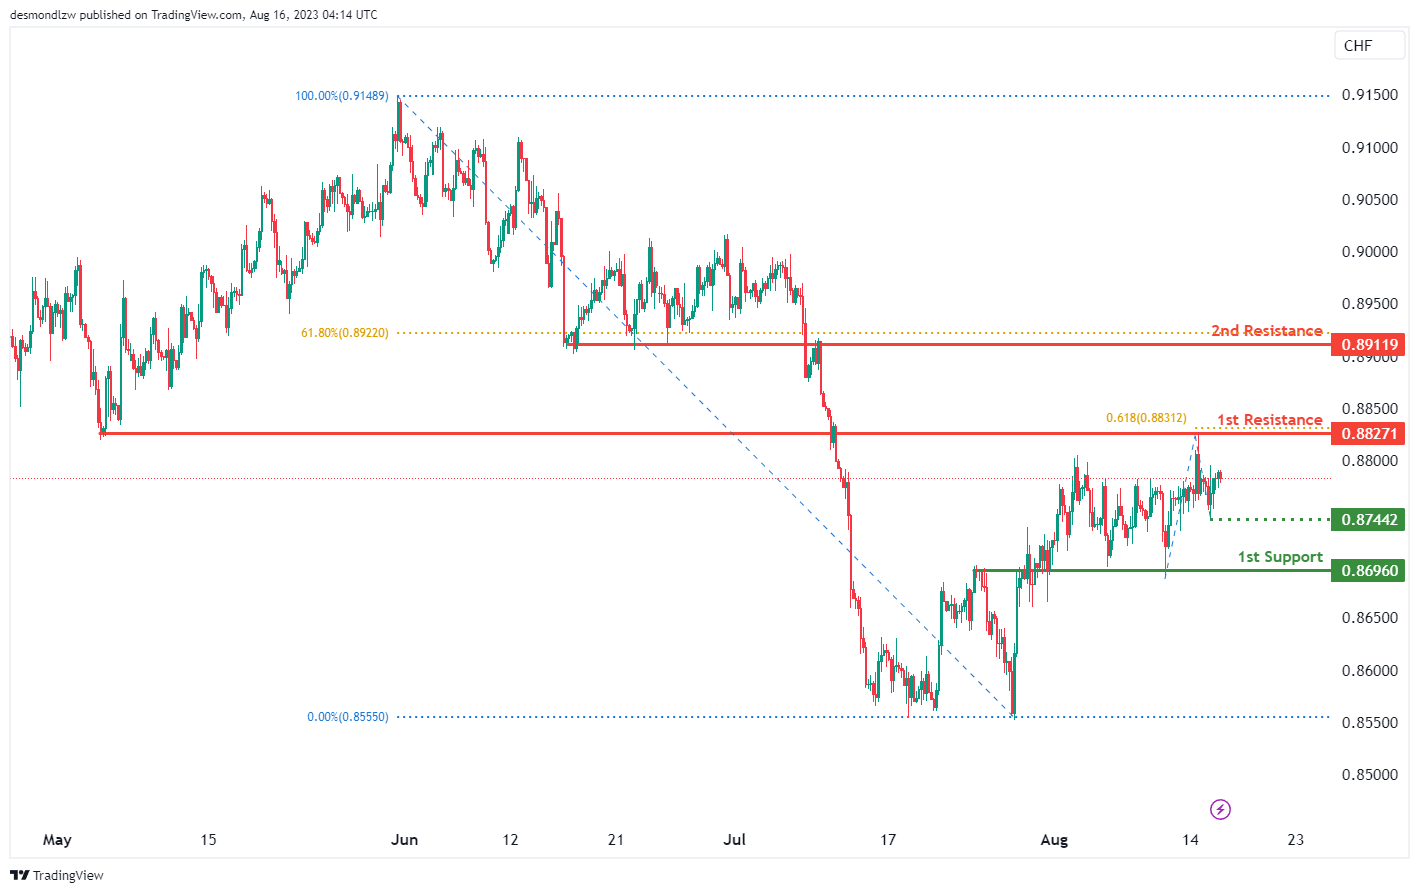
USD/CHF:
The USD/CHF chart currently showcases a bearish momentum, suggesting a prevailing downward trend.
Within this bearish context, there is a possibility of a bearish continuation towards the 1st support level at 0.8696, which is identified as an overlap support. Moreover, an intermediate support at 0.8744, acting as a swing low support, adds to the potential support zones.
On the resistance side, the 1st resistance at 0.8827 holds significance due to its categorization as an overlap resistance and alignment with a 61.80% Fibonacci Projection.
Additionally, the 2nd resistance at 0.8911 is notable as a pullback resistance. This resistance level gains importance as it aligns with a 61.80% Fibonacci Retracement.
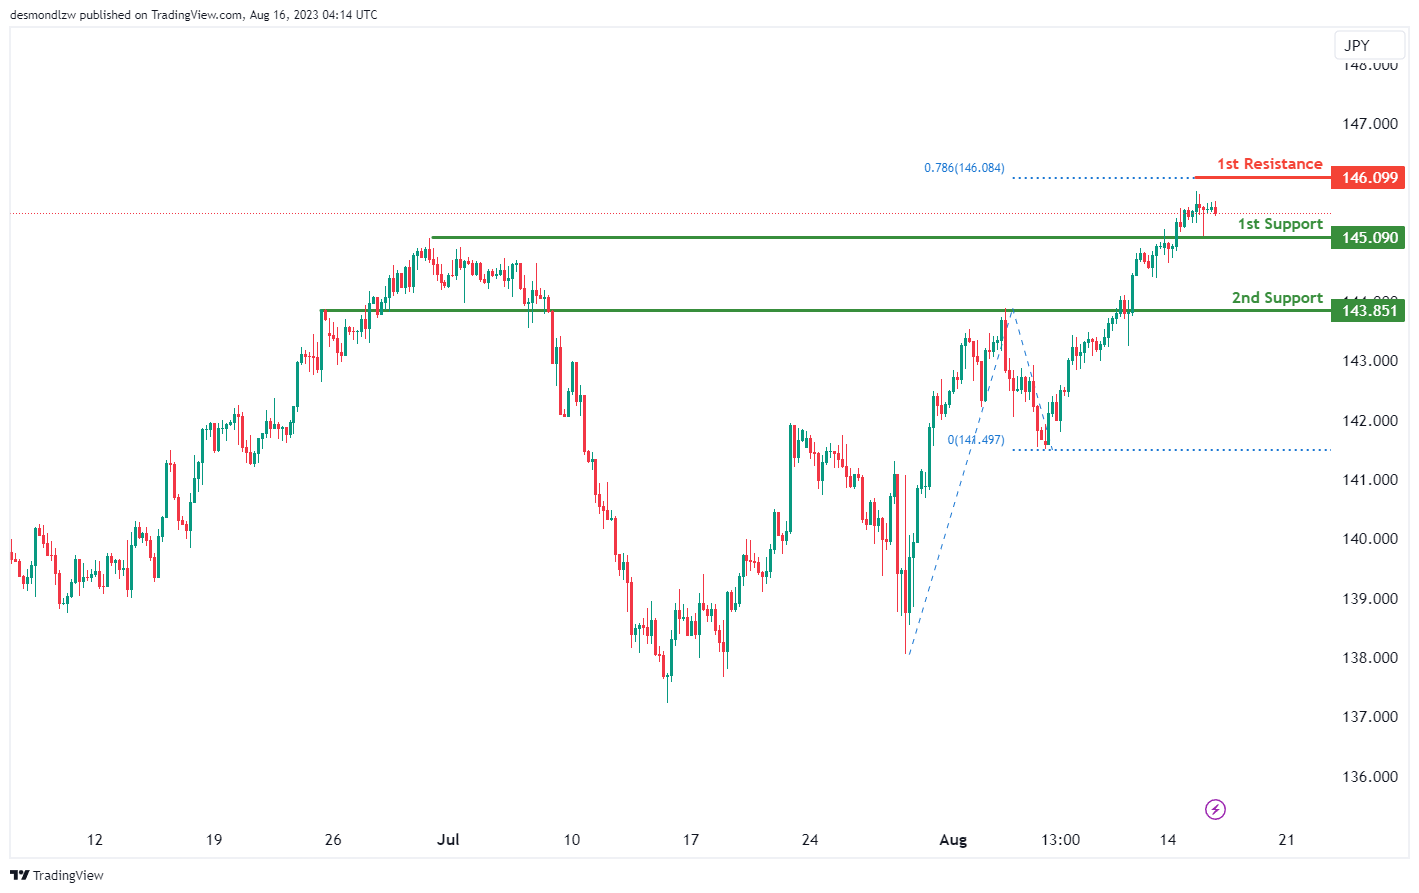
USD/JPY:
The USD/JPY chart currently reflects a bullish momentum, suggesting a prevailing upward trend.
Within this bullish context, a potential scenario could involve a short-term drop in price towards the 1st support level at 145.09, identified as an overlap support. This might be followed by a bounce from this support, leading to a rise towards the 1st resistance at 146.09.
Adding to the support structure, the 2nd support at 143.85 is considered a pullback support, which could provide additional stability during price fluctuations.
On the resistance side, the significance of the 1st resistance at 146.09 is reinforced by its alignment with a 78.60% Fibonacci Projection.
Given the overall bullish momentum, the indicated support and resistance levels suggest the potential for a short-term drop followed by a subsequent upward movement.
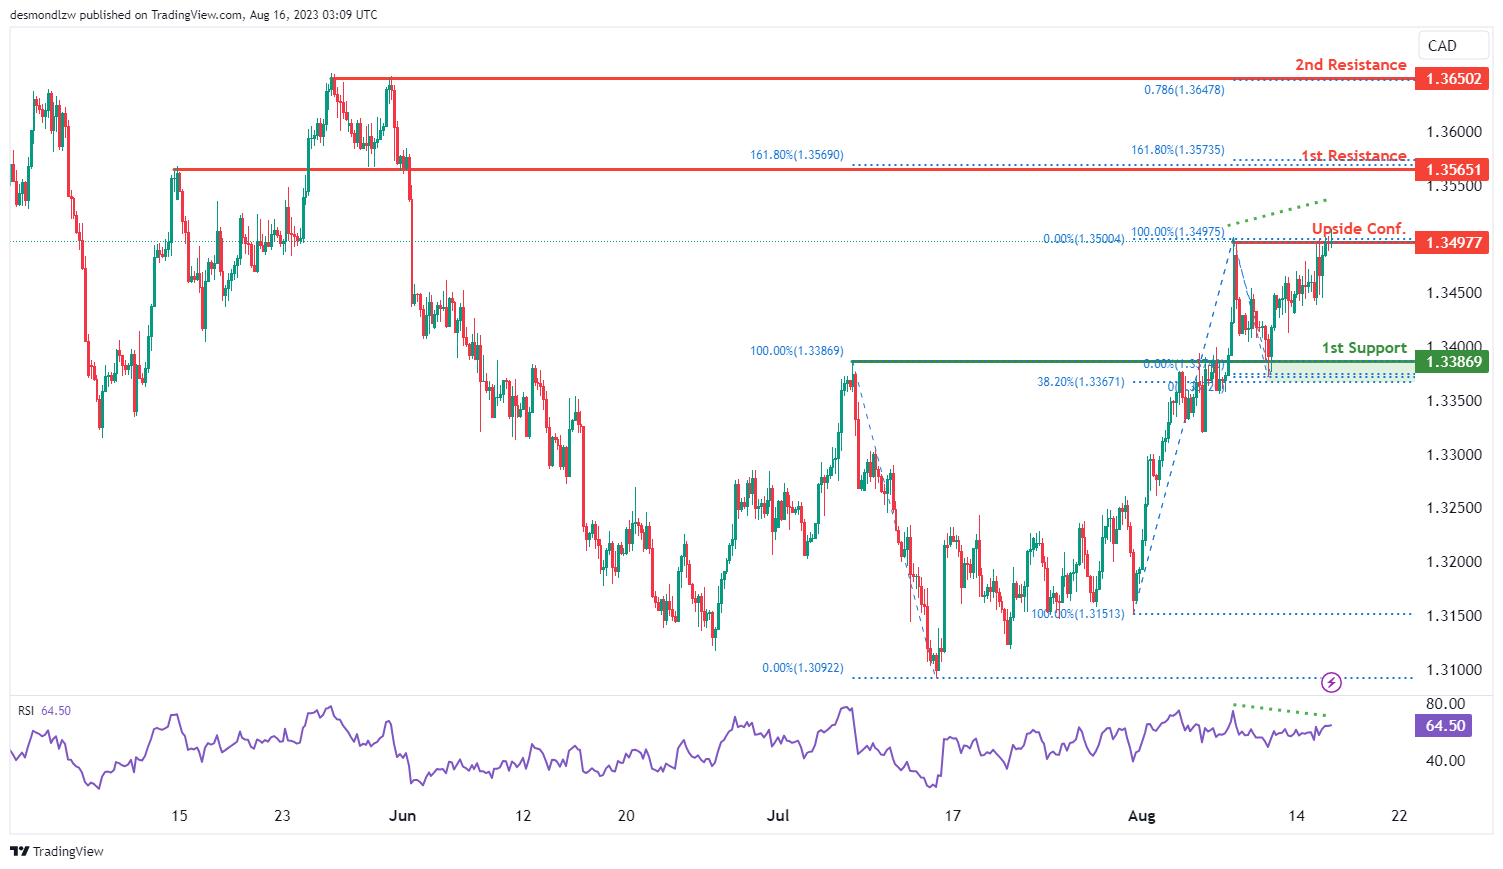
USD/CAD:
The current momentum of the USD/CAD chart is bullish, indicating a potential continuation of the upward trend should the price break through and stay above the upside confirmation level at 1.3498. Price could potentially climb towards the 1st resistance. However, do take note of the bearish RSI divergence that suggests that price could make a potential bearish reversal.
The 1st resistance at 1.3565 is significant due to its role as an overlap resistance and the presence of multiple Fibonacci confluence levels i.e. the double occurrence of the 161.80% Fibonacci extension levels. Furthermore, there is also a 2nd resistance at 1.3650 that is identified as an overlap resistance that aligns with the 78.60% Fibonacci projection level.
The 1st support level at 1.3387 is an overlap support that is reinforced by the 38.20% Fibonacci retracement level.
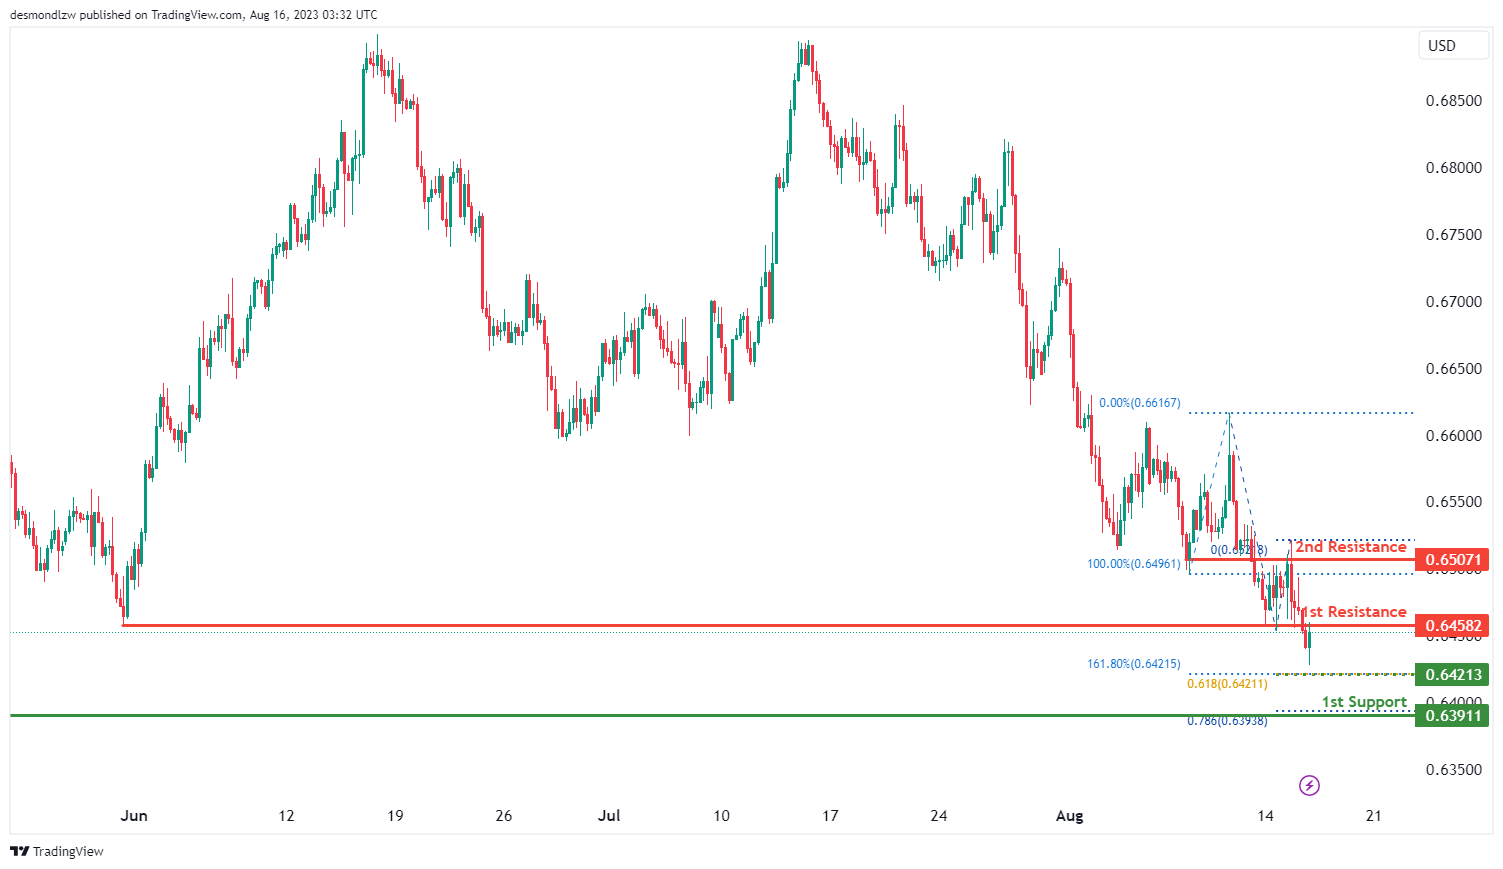
AUD/USD:
The current momentum of the AUD/USD chart is bearish, indicating a potential continuation of the downward trend.
There is a possibility that the price could experience a bearish reaction off the 1st resistance level at 0.6458 before moving down towards the intermediate support level at 0.6421. This level is supported by a confluence of Fibonacci levels i.e. the 61.80% projection and the 161.80% extension levels. Additionally, the 2nd support at 0.6391 is identified as a swing-low support that aligns with the 78.60% Fibonacci projection level.
To the upside, the 1st resistance at 0.6458 is identified as an overlap resistance. Furthermore, the 2nd resistance at 0.6507 is also identified as an overlap resistance.
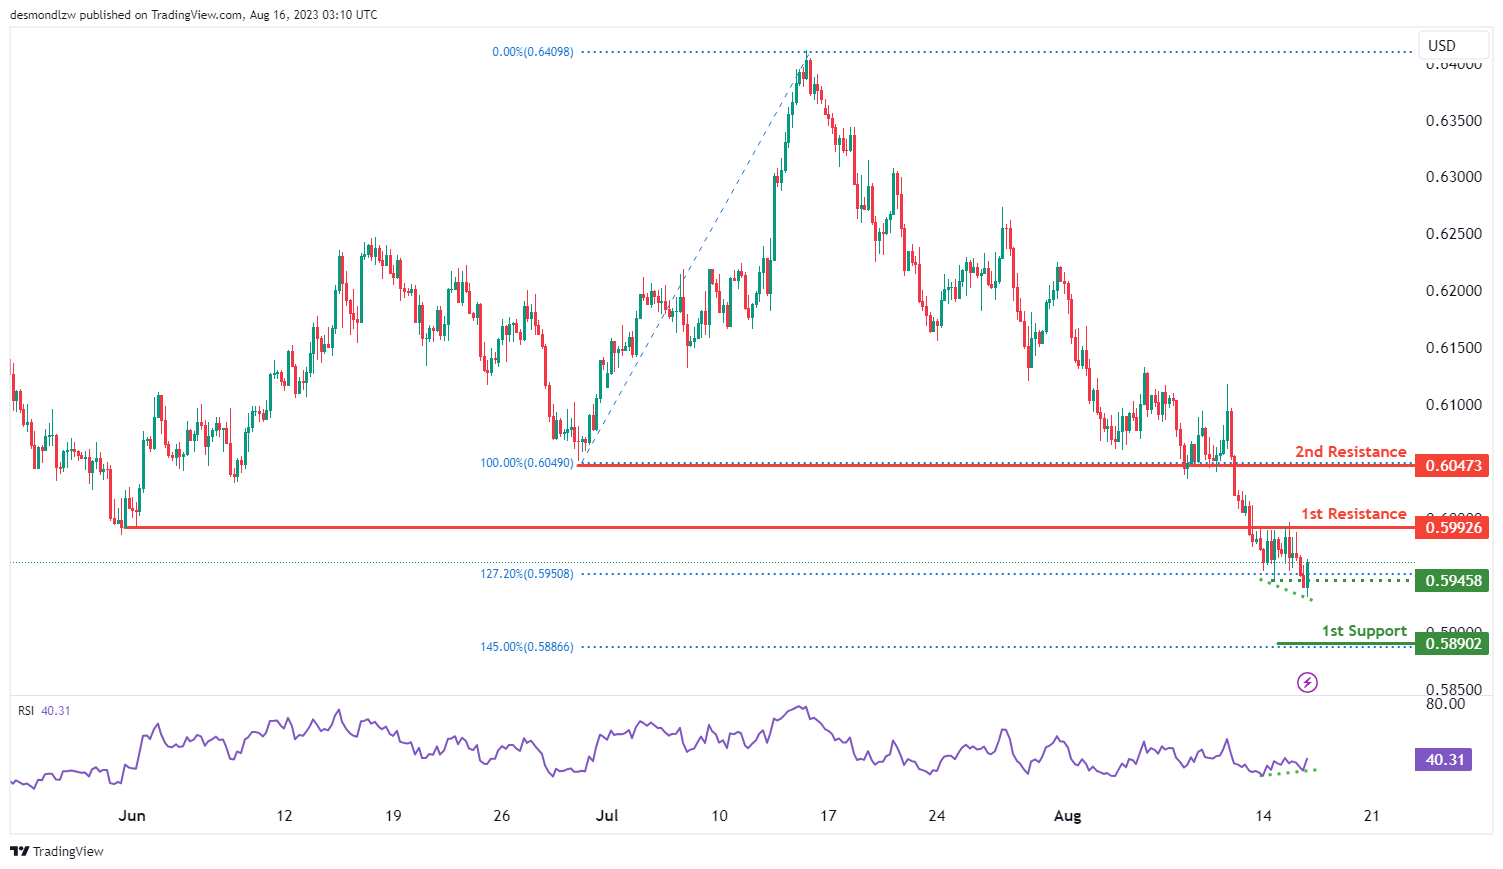
NZD/USD
The current chart for NZD/USD indicates a bullish momentum, suggesting a potential continuation of the upward trend. This momentum is supported by the presence of bullish divergence between the price and the RSI indicator.
There is a likelihood that the price could experience a bullish movement towards the 1st resistance level at 0.5993 that is identified as an overlap resistance. Additionally, the 2nd resistance at 0.6047 is also identified as an overlap resistance.
To the downside, the intermediate support level at 0.5946 aligns with the 127.20% Fibonacci extension level. Furthermore, the 1st support level at 0.5890 aligns with the 145.00% Fibonacci extension level.
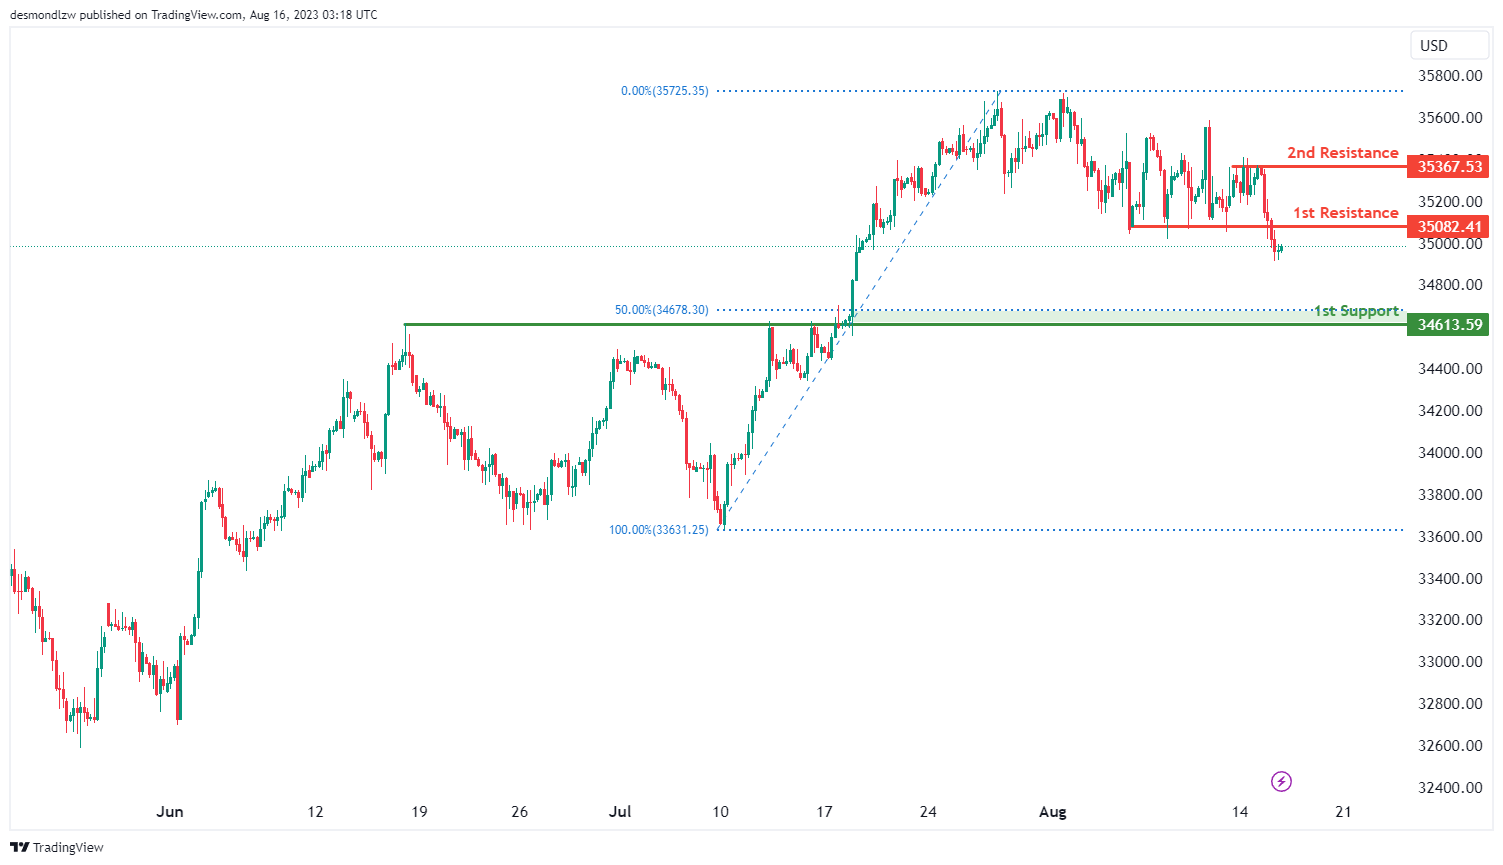
DJ30:
The current analysis of DJ30 indicates a bearish momentum, suggesting a potential continuation of the downward trend. There is a possibility for the price to experience a short-term upward movement towards the 1st resistance level at 35082.41 before reversing and heading towards the 1st support at 34613.59. The 1st support is supported by the presence of a 50% Fibonacci retracement level.
In addition, the 2nd resistance at 35367.53 is notable as a multi-swing high resistance, which could potentially act as a barrier to any further upward movement.
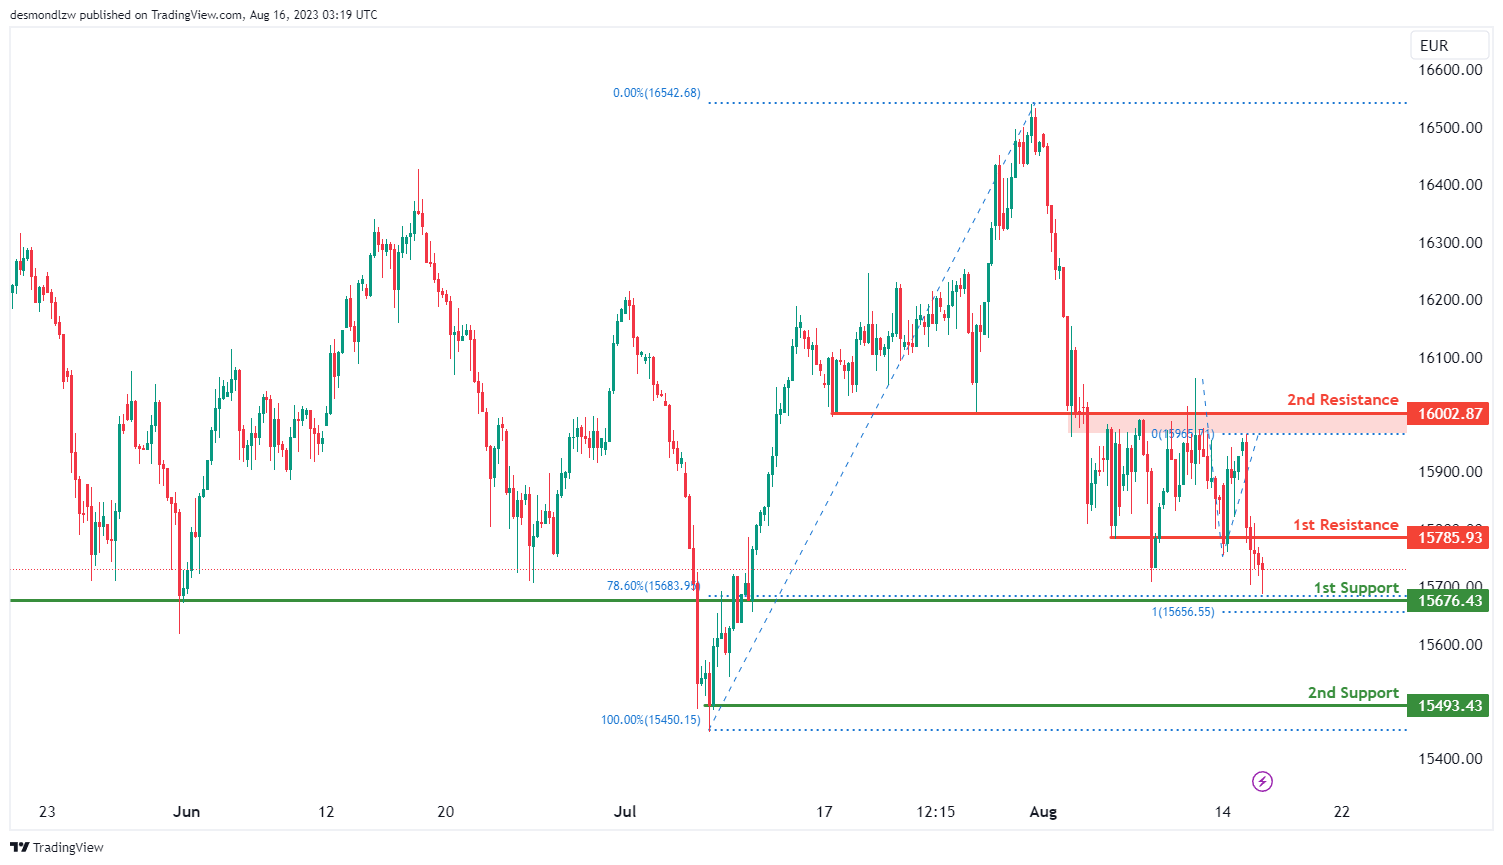
GER30:
The GER30 chart currently shows a bullish momentum, suggesting a potential continuation of the upward trend. There is a possibility that the price might bounce off the 1st support at 15676.43, which is supported by both a 78.60% Fibonacci retracement level and a 100% Fibonacci projection. Additionally, the 2nd support at 15493.43 serves as a potential level for a reversal.
On the other hand, the 1st resistance at 15785.93 is significant as an overlap resistance, which could pose a challenge for further upward movement. The 2nd resistance at 16002.87 also acts as a pullback resistance, adding to the resistance levels to watch for potential price movement.
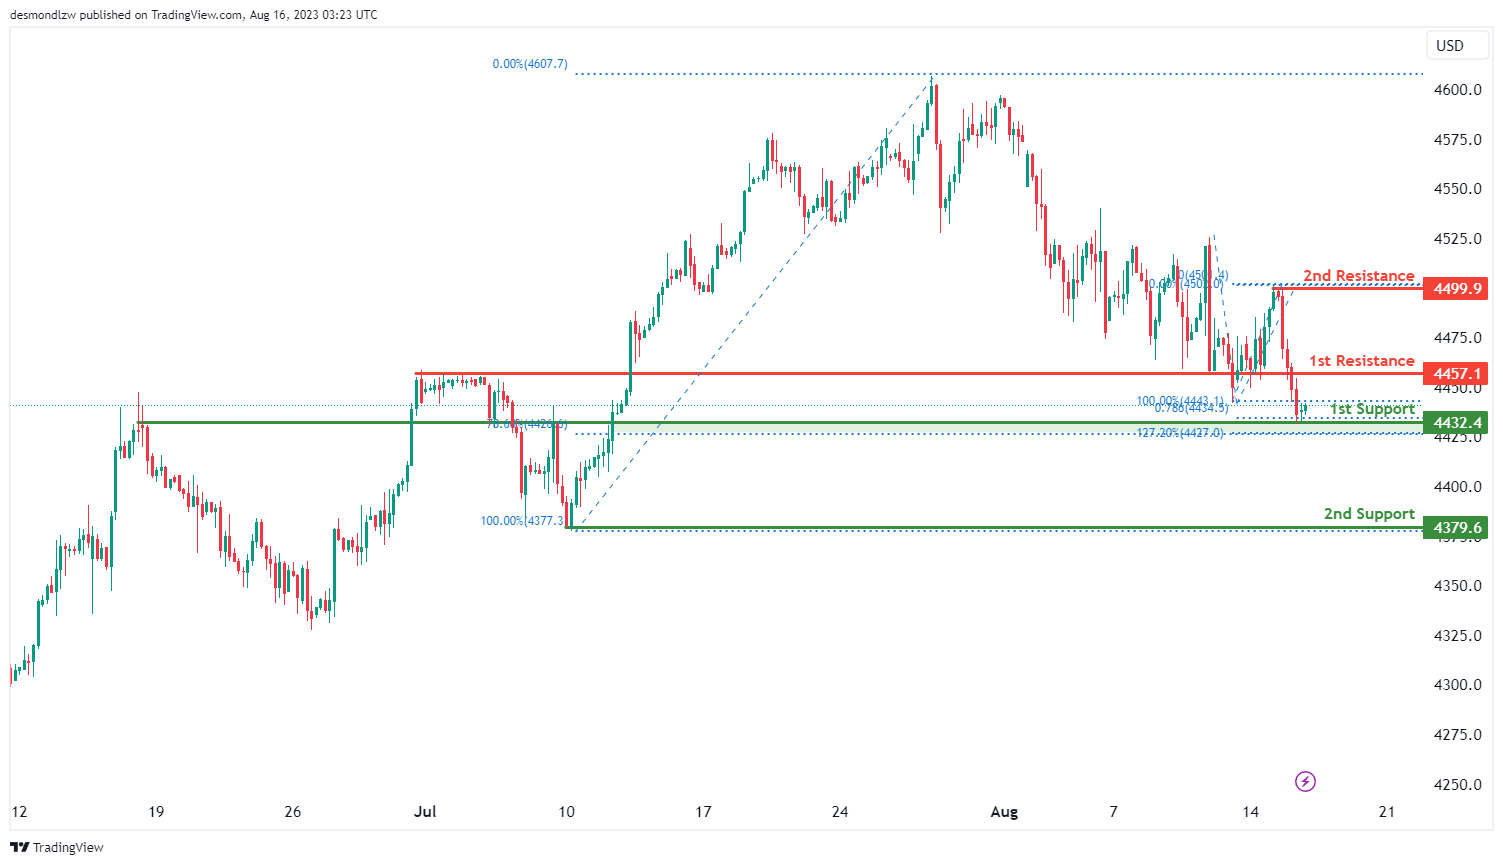
US500
The US500 chart currently reflects a bullish momentum, suggesting the potential for a continuation of the upward trend. It’s plausible that the price might experience a bullish bounce off the 1st support at 4432.4. This support level is significant as it aligns with both a 78.60% Fibonacci retracement and a 127.20% Fibonacci extension, highlighting a Fibonacci confluence and reinforcing its importance.
Furthermore, the 2nd support at 4379.6 adds to the potential for a rebound. On the resistance side, the 1st resistance at 4457.1 holds significance as an overlap resistance, which could impact upward movement. The 2nd resistance at 4499.9 serves as a notable swing high resistance, potentially influencing price behavior.
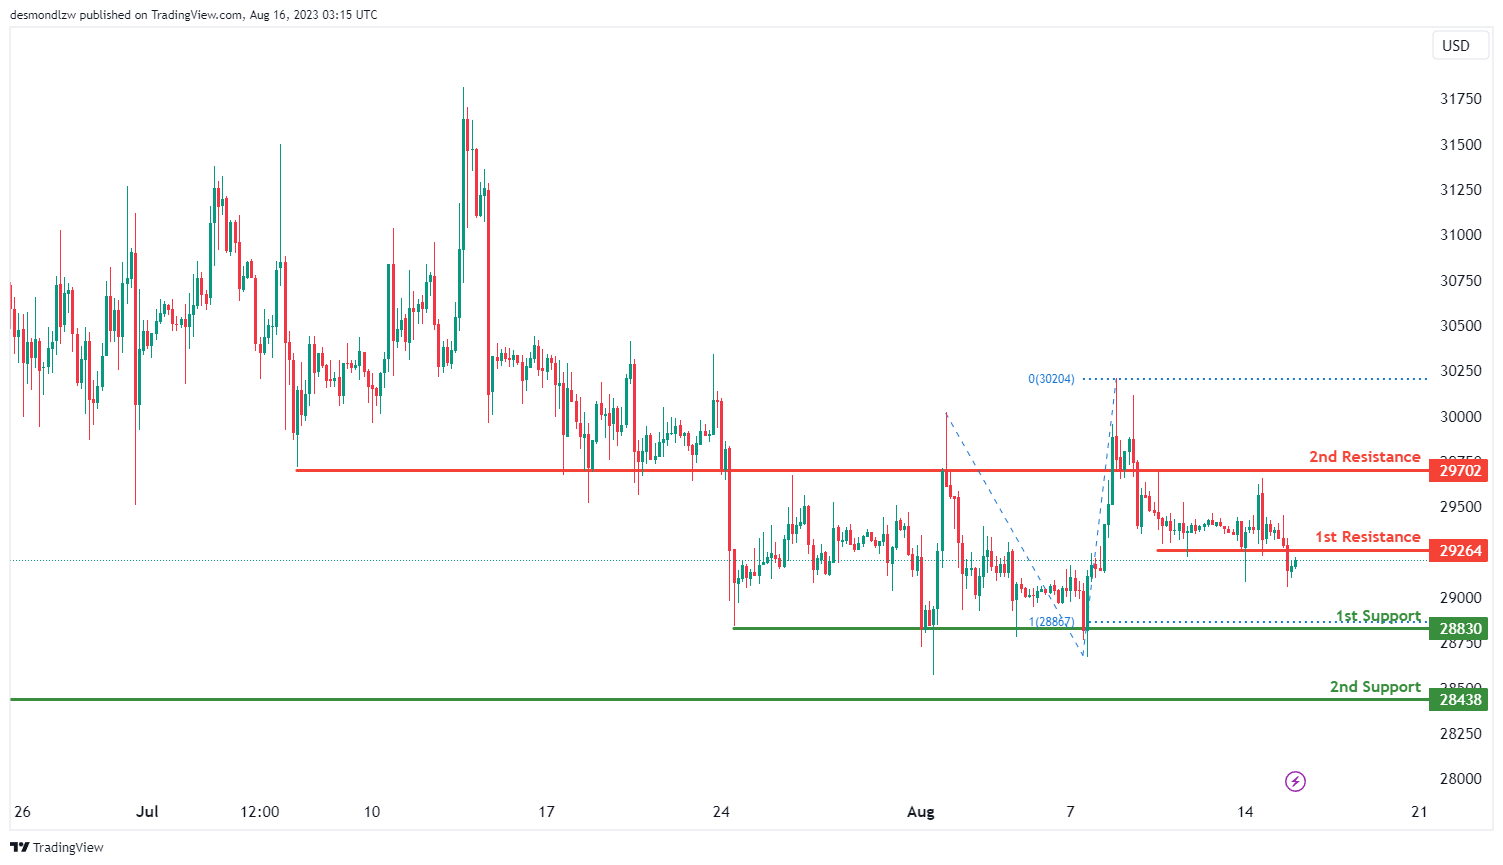
BTC/USD:
The current chart analysis of BTC/USD indicates a bearish momentum, suggesting a potential continuation of the downward trend. The price is expected to react bearishly upon reaching the 1st resistance level and move towards the 1st support level. The 1st support at 28830 is reinforced by a 100% Fibonacci Projection and can serve as a strong support level. The 2nd support at 28438 is also significant as an overlap support.
On the other hand, the 1st resistance at 29264 is noteworthy as it coincides with pullback resistance. Additionally, the 2nd resistance at 29702 is also important as an overlap resistance.
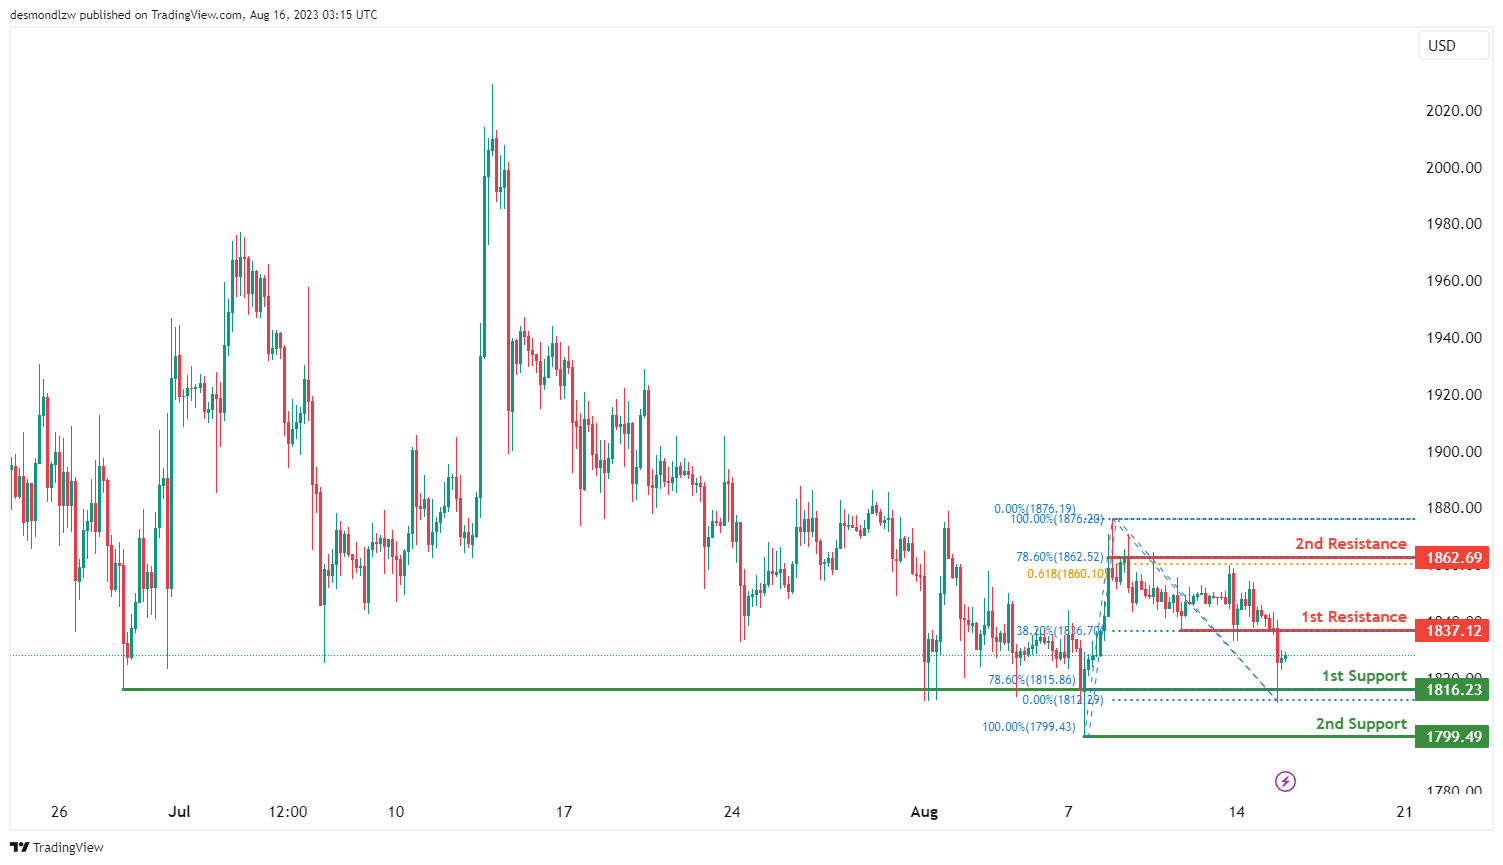
ETH/USD:
The current chart analysis of ETH/USD suggests a bearish momentum, indicating a potential continuation of the downward trend. The price may see a short-term rise towards the 1st resistance level at 1837.12 before reversing and heading towards the 1st support level at 1816.23. The 1st support is significant as it is a level of overlap and coincides with the 78.60% Fibonacci retracement. The 2nd support at 1799.49 is also important as a swing low support.
On the other hand, the 1st resistance at 1837.12 is significant due to its role as a pullback resistance. Additionally, the 2nd resistance at 1862.69 holds importance as it is a multi-swing high resistance and also coincides with the 78.60% Fibonacci retracement and 61.80% Fibonacci projection, indicating a potential area of resistance.
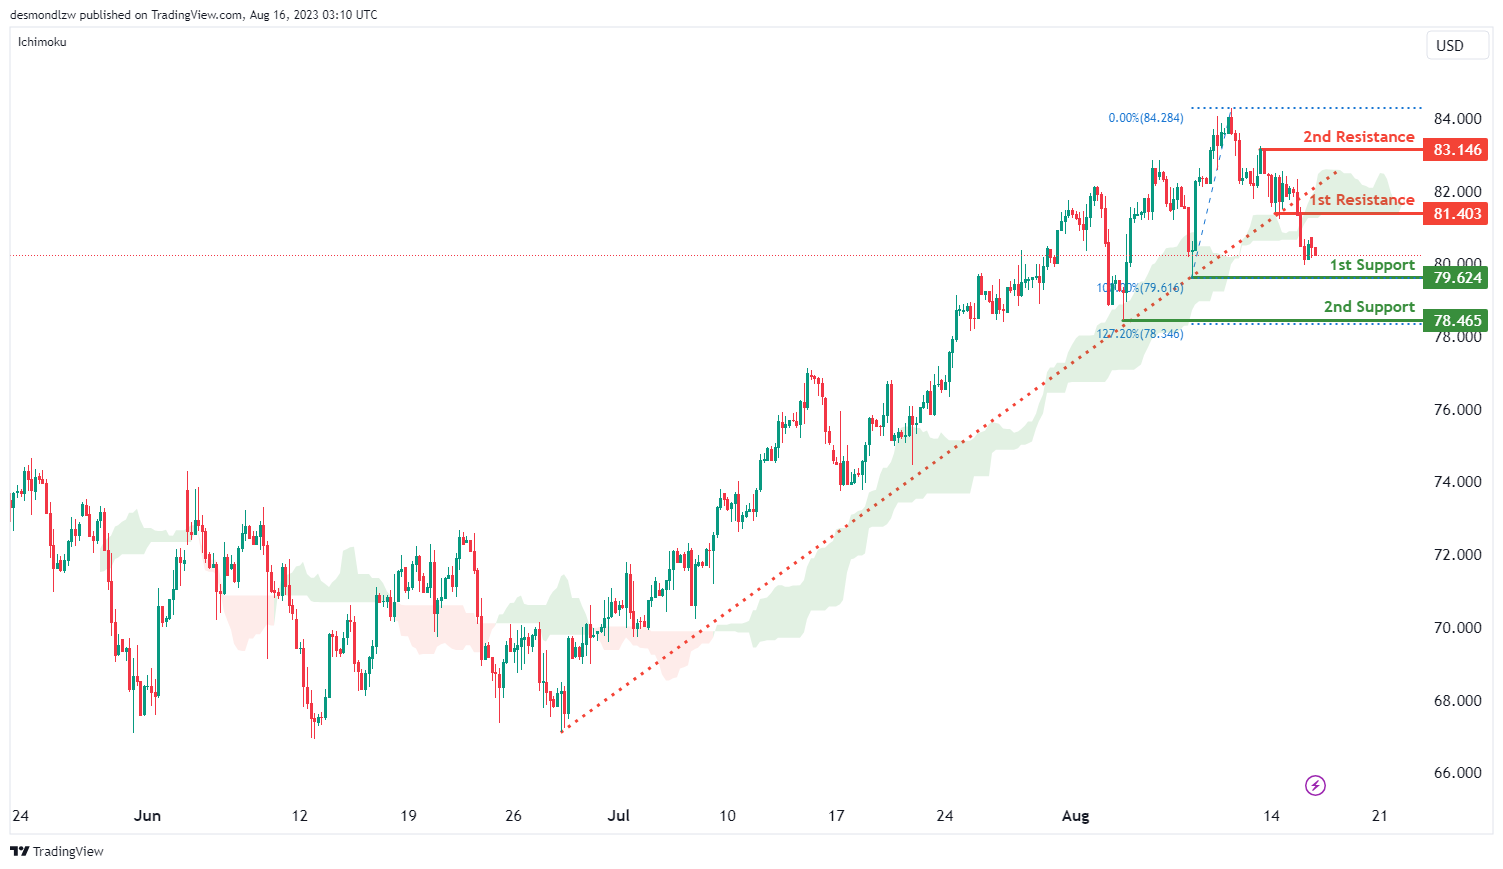
WTI/USD:
The current momentum of the WTI/USD chart is bearish, supported by the fact that the price has broken below an ascending support line as well as crossing below the Ichimoku cloud. This suggests the potential for a continued downward movement.
There is a possibility for the price to continue its bearish momentum towards the 1st support level at 79.62. The 2nd support at 78.465 is swing-low that aligns with the 127.20% Fibonacci extension level, adding to its significance.
To the upside, the 1st resistance level at 81.40 acts as a pullback resistance. Additionally, the 2nd resistance at 83.15 also functions as a pullback resistance should price reach this level.
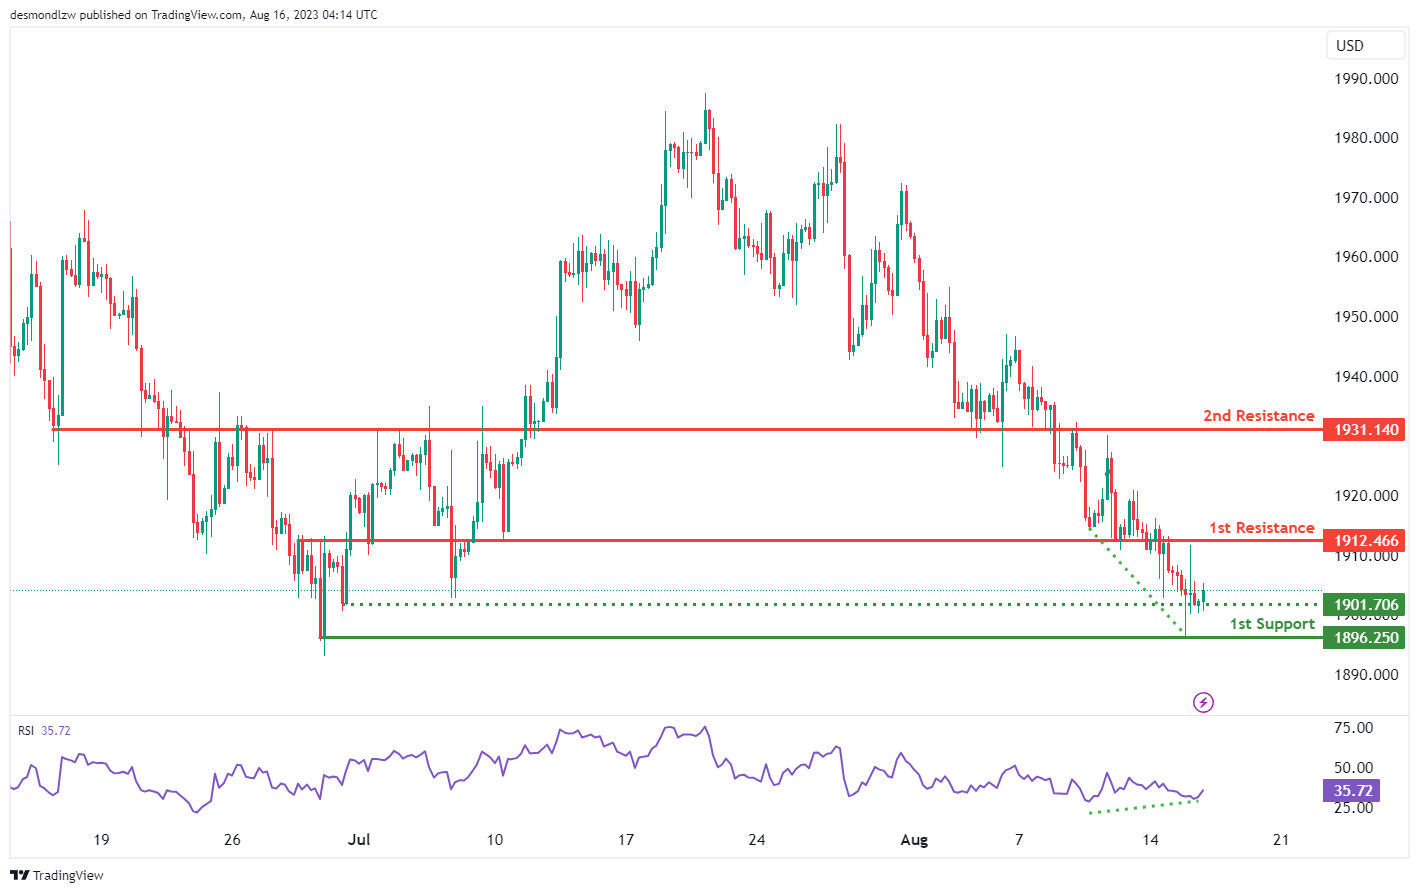
XAU/USD (GOLD):
The XAU/USD chart currently exhibits a bullish momentum, indicating a prevailing upward trend.
Within this bullish context, a potential scenario involves a bullish bounce off the 1st support level at 1896.25, which is considered a pullback support. This bounce could lead the price towards the 1st resistance level at 1912.46, characterized as an overlap resistance.
Providing additional support, the intermediate support at 1901.70 is identified as a multi-swing low support, potentially reinforcing the overall support structure.
On the resistance side, the 2nd resistance at 1931.14 is also an overlap resistance, adding to its significance as a potential barrier to upward movement.
It’s noteworthy that the Relative Strength Index (RSI) is currently situated on a major support level, suggesting the possibility of an upcoming bounce in the price.


