
DXY:
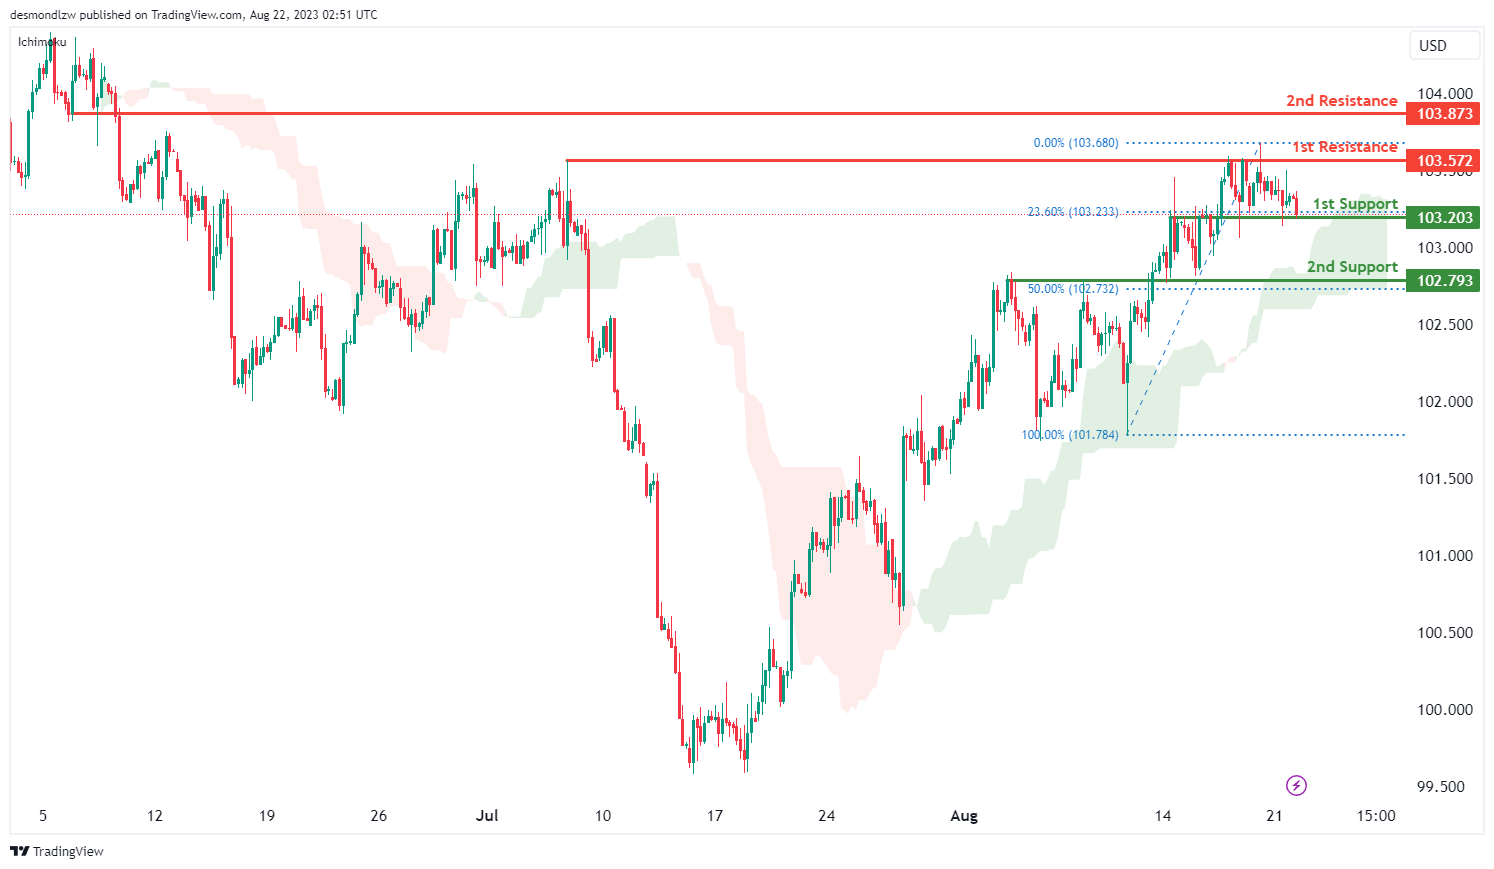
The DXY chart currently displays a bearish momentum, suggesting a prevailing downward trend. Given this momentum, there is a potential scenario where the price could undergo a bearish breakout from the 1st support level at 103.20, potentially leading to a decline towards the 2nd support at 102.79.
The 1st support at 103.20 is identified as an overlap support that aligns with the 23.60% Fibonacci retracement level. Similarly, the 2nd support at 102.79 is also identified as an overlap support that aligns with the 50.00% Fibonacci retracement level.
To the upside, the 1st resistance level at 103.57 is identified as an overlap resistance. Additionally, the 2nd resistance at 103.87 is also identified as another overlap resistance.
EUR/USD:
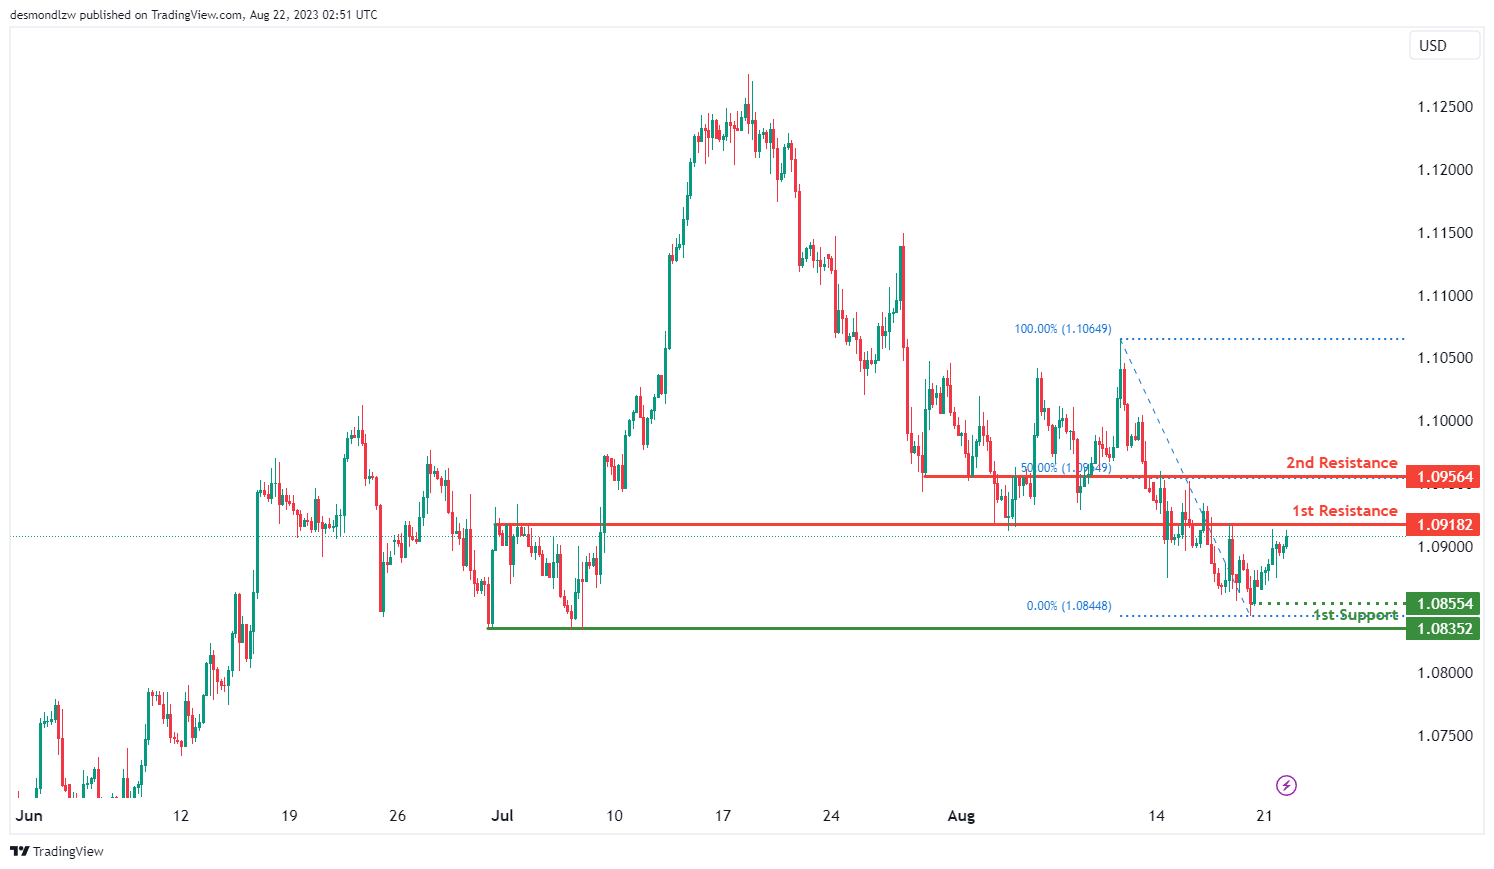
The EUR/USD chart is currently exhibiting a bullish momentum, there is a potential scenario where the price might experience a bullish continuation towards the 1st resistance at 1.0918.
This 1st resistance at 1.0918 is identified as an overlap resistance. Furthermore, the 2nd resistance at 1.0956 is also identified as an overlap resistance that aligns with the 50.00% Fibonacci retracement level.
To the downside, the intermediate support at 1.0855 is identified as a swing-low support while the 1st support at 1.0835 gains importance due to its identification as a multiple swing-low support.
EUR/JPY:
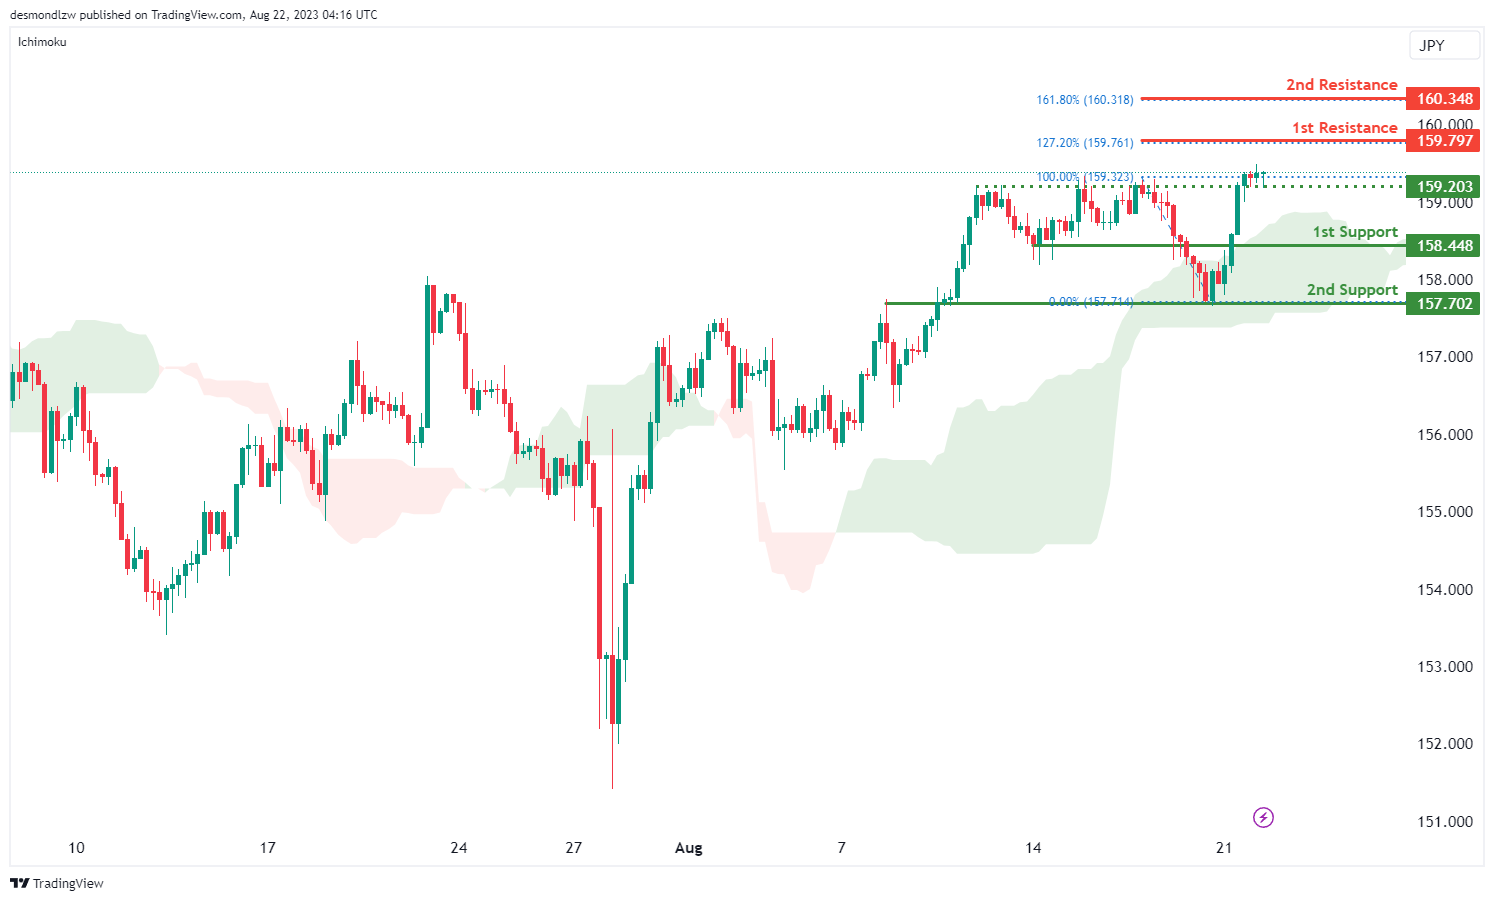
The EUR/JPY chart indicates a bullish overall momentum, and this momentum is further supported by the fact that the price is currently above the bullish Ichimoku cloud.
There is a potential scenario where the price might continue in a bullish direction towards the 1st resistance level.
The 1st support is positioned at 158.44 and is considered advantageous due to its overlap support characteristics. Additionally, the 2nd support at 157.70 is valuable as it represents a pullback support.
On the resistance side, the 1st resistance level at 159.79 is noteworthy and is associated with a 127.20% Fibonacci Extension. Furthermore, the 2nd resistance at 160.34 is significant due to its 161.80% Fibonacci Extension attribute. Additionally, there is an intermediate support at 159.20, which further adds to the potential bullish scenario.
EUR/GBP:
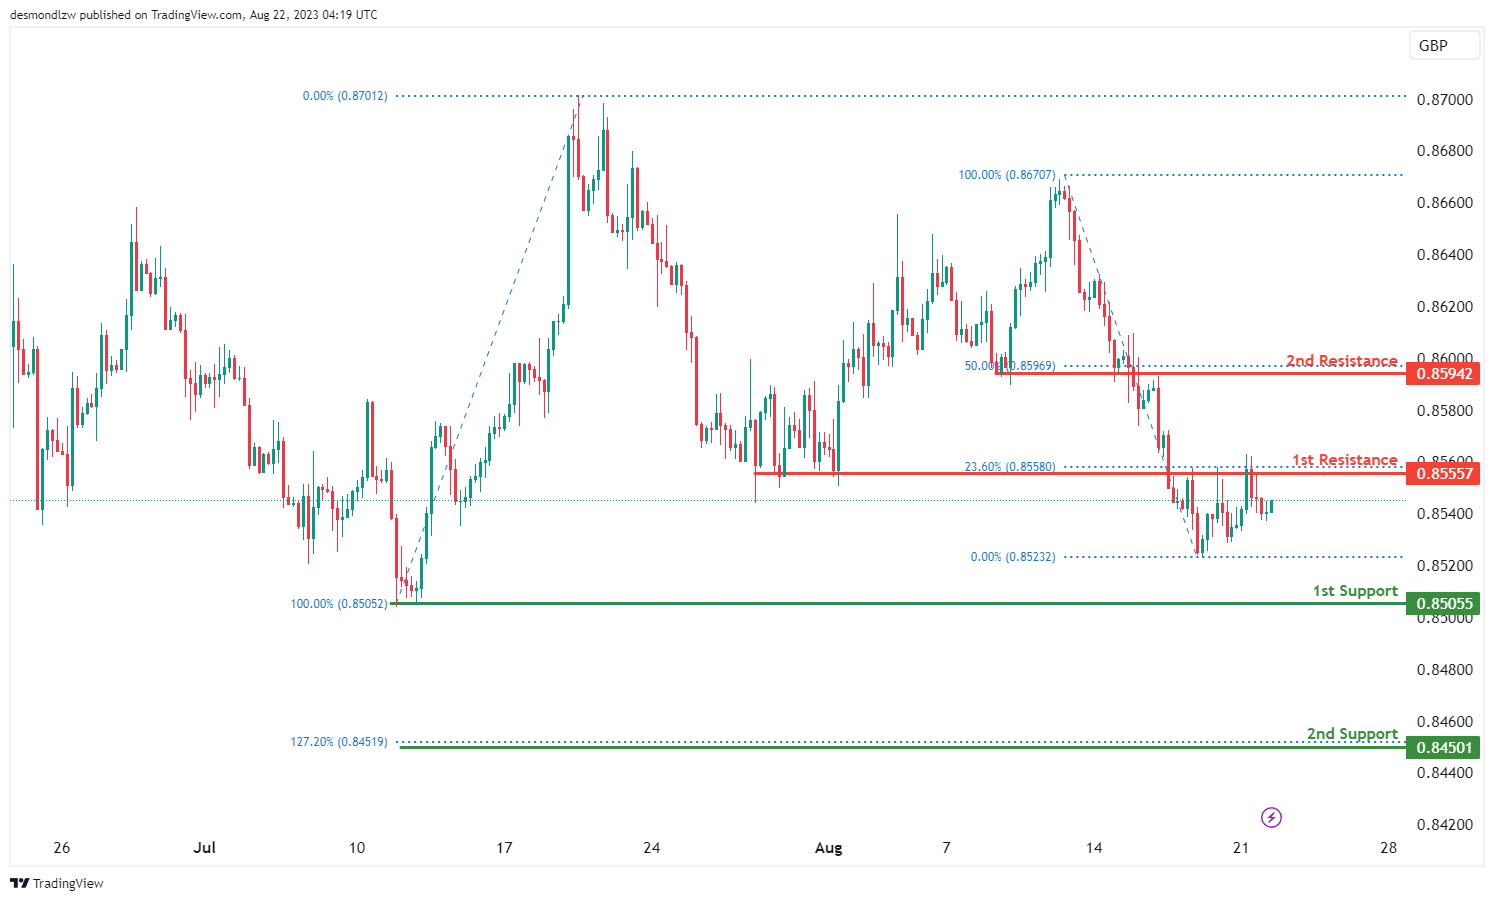
The EUR/GBP chart indicates a bearish overall momentum. There is a potential scenario where the price might rise towards the 1st resistance level in the short term, but then reverse off it and drop towards the 1st support.
The 1st support is located at 0.8505 and is considered advantageous due to its swing low support characteristics. Additionally, the 2nd support at 0.8450 is valuable as it is associated with a 127.20% Fibonacci Extension.
On the resistance side, the 1st resistance level at 0.8555 is noteworthy as it represents a pullback resistance, along with a 23.60% Fibonacci Retracement. Furthermore, the 2nd resistance at 0.8594 is significant due to its pullback resistance attributes and its association with the 50% Fibonacci Retracement.
GBP/USD:
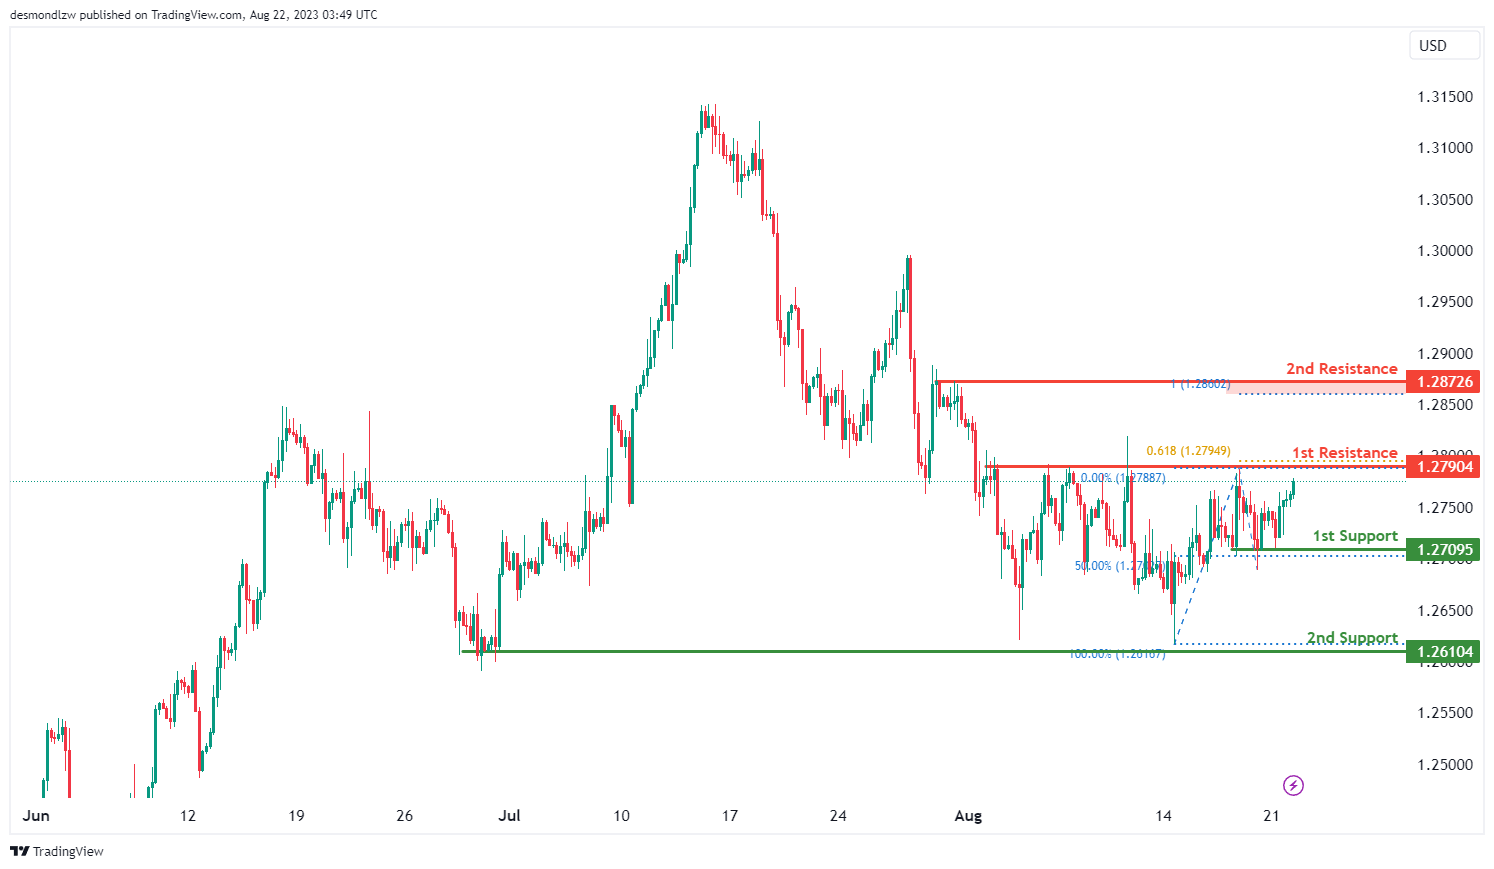
The GBP/USD chart currently displays a bullish momentum, indicating a prevalent upward trend. There is a potential scenario where price could experience a bullish continuation towards the 1st resistance at 1.2790.
This 1st resistance at 1.2790 is identified as an overlap resistance that aligns with the 61.80% Fibonacci projection level. In addition, the 2nd resistance at 1.2873 is identified as a pullback resistance that aligns with the 100.00% Fibonacci projection level.
To the downside, the 1st support at 1.2709 is identified as a multiple swing-low support that aligns with the 50.00% Fibonacci retracement level. Additionally, the 2nd support at 1.2610 is identified as an overlap support.
GBP/JPY:
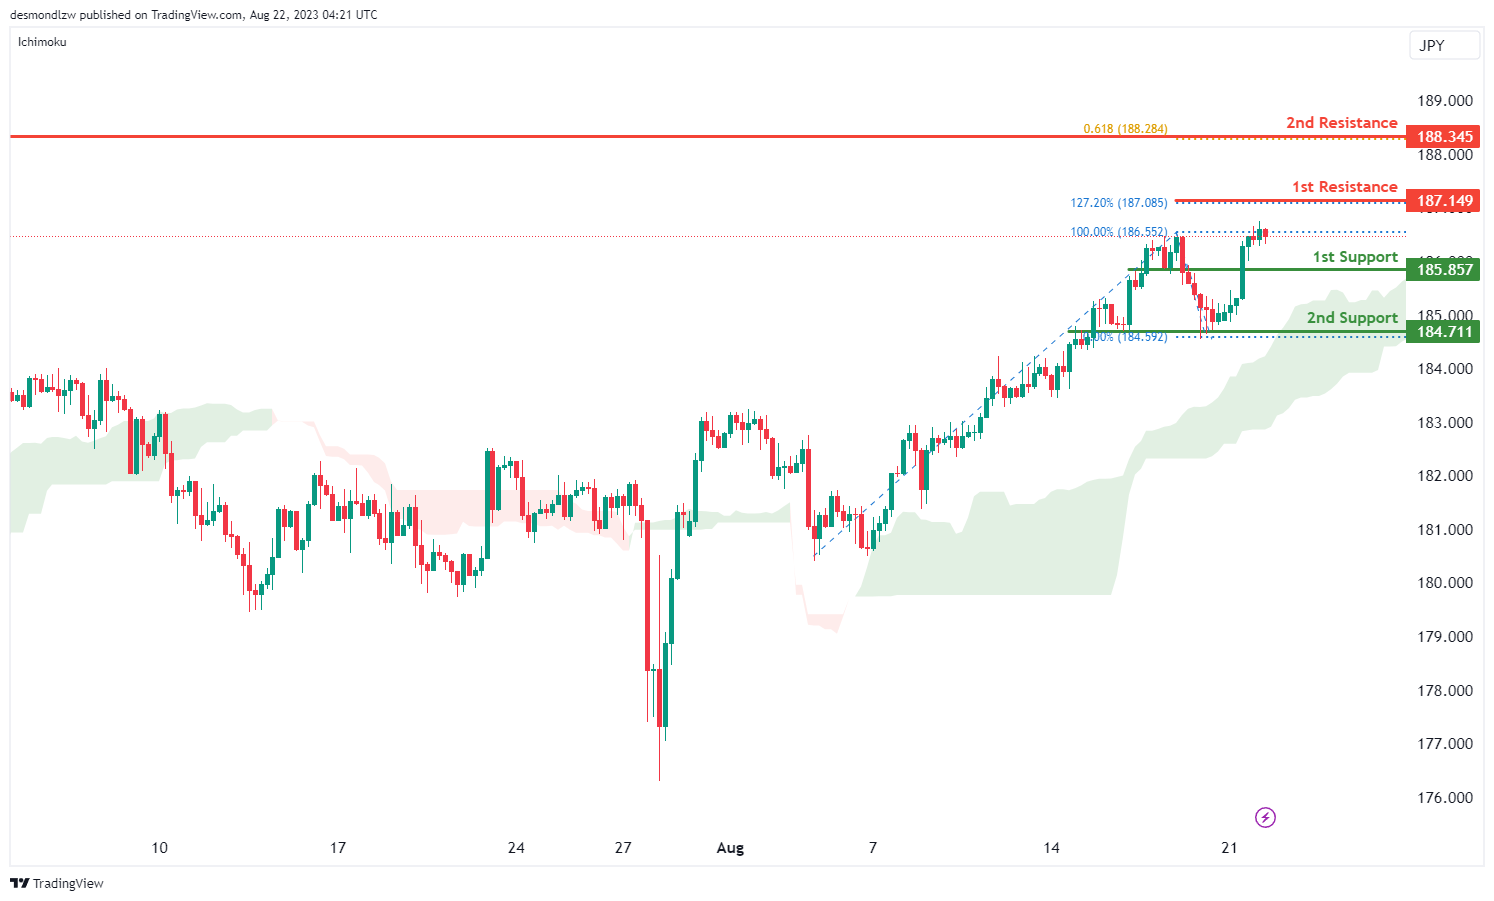
The GBP/JPY chart indicates a bullish overall momentum. There is a potential scenario where the price might continue in a bullish direction towards the 1st resistance level.
The 1st support is positioned at 185.85 and is considered advantageous due to its overlap support characteristics. Additionally, the 2nd support at 184.71 is valuable as it represents a pullback support.
On the resistance side, the 1st resistance level at 187.14 is noteworthy and is associated with a 127.20% Fibonacci Extension. Furthermore, the 2nd resistance at 188.34 is significant due to its swing high resistance attributes and its association with the 61.80% Fibonacci Projection.
USD/CHF:
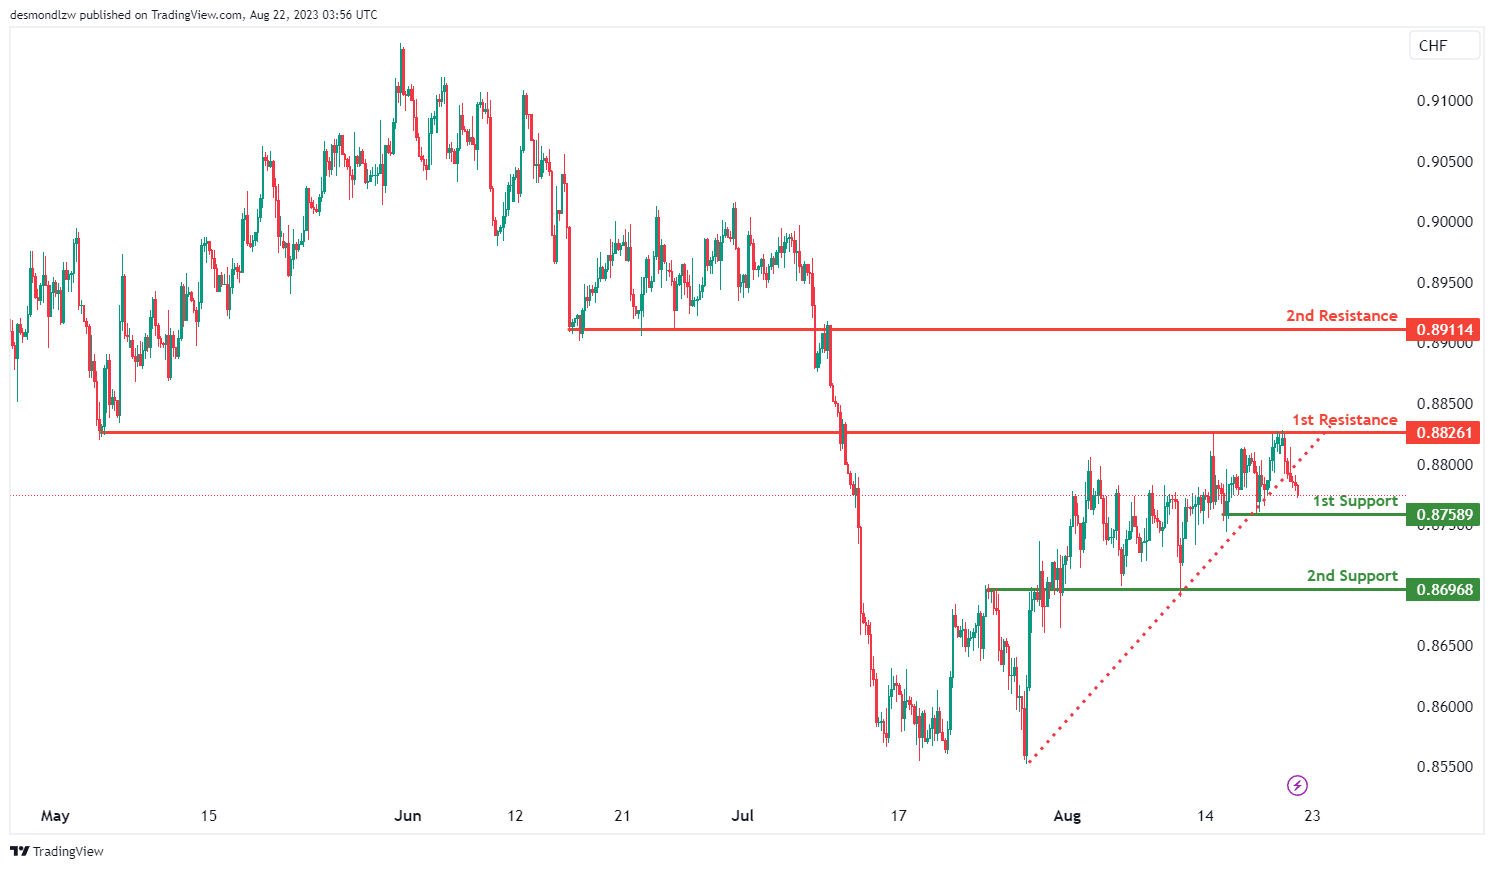
The USD/CHF chart’s overall momentum reflects a bearish trend, which is supported by the fact that price has broken below an ascending support line, signaling a potential for further downward movement. There is a possibility that price could continue its bearish movement towards the 1st support at 0.8759.
This 1st support at 0.8759 is identified as a multiple swing-low support. Additionally, the 2nd support at 0.8697 is identified as an overlap support.
To the upside, the 1st resistance at 0.8826 and the 2nd resistance at 0.8911 are both identified as overlap resistances, which could potentially act as barriers to upward price movement.
USD/JPY:
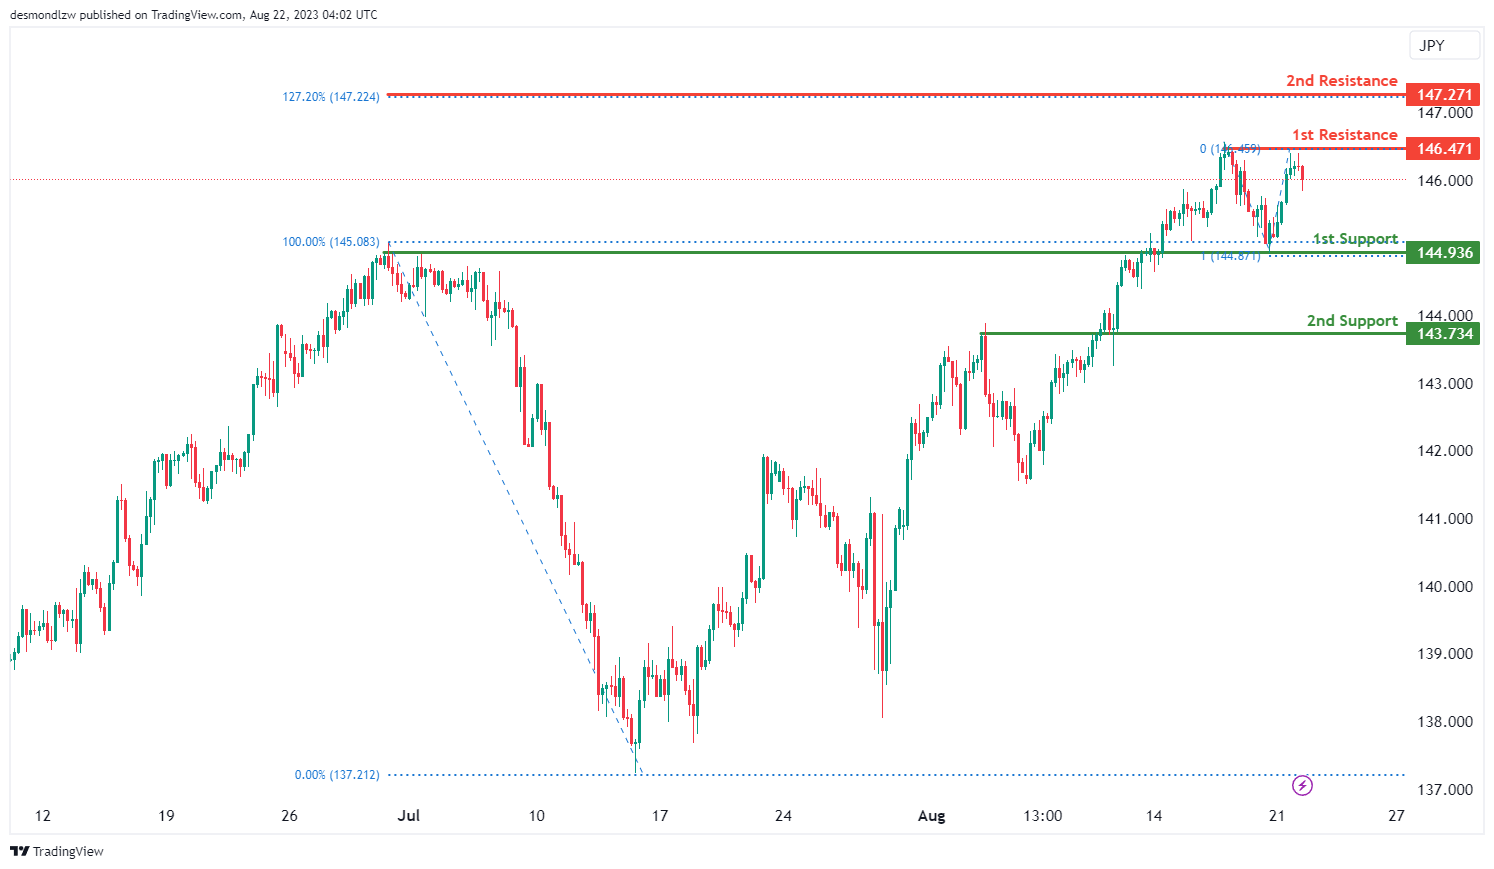
The current chart momentum indicates a neutral trend in the market, with neither strong bullish nor bearish indications. There is a potential scenario for price to fluctuate between the 1st resistance and the 1st support levels.
The 1st support at 144.94 is identified as an overlap support that aligns with the 100.00% Fibonacci projection level. Similarly, the 2nd support at 143.73 is also identified as an overlap support.
To the upside, the 1st resistance at 146.47 is identified as a multiple swing-high resistance while the 2nd resistance at 147.27 is identified as a resistance level that aligns with the 127.20% Fibonacci extension level.
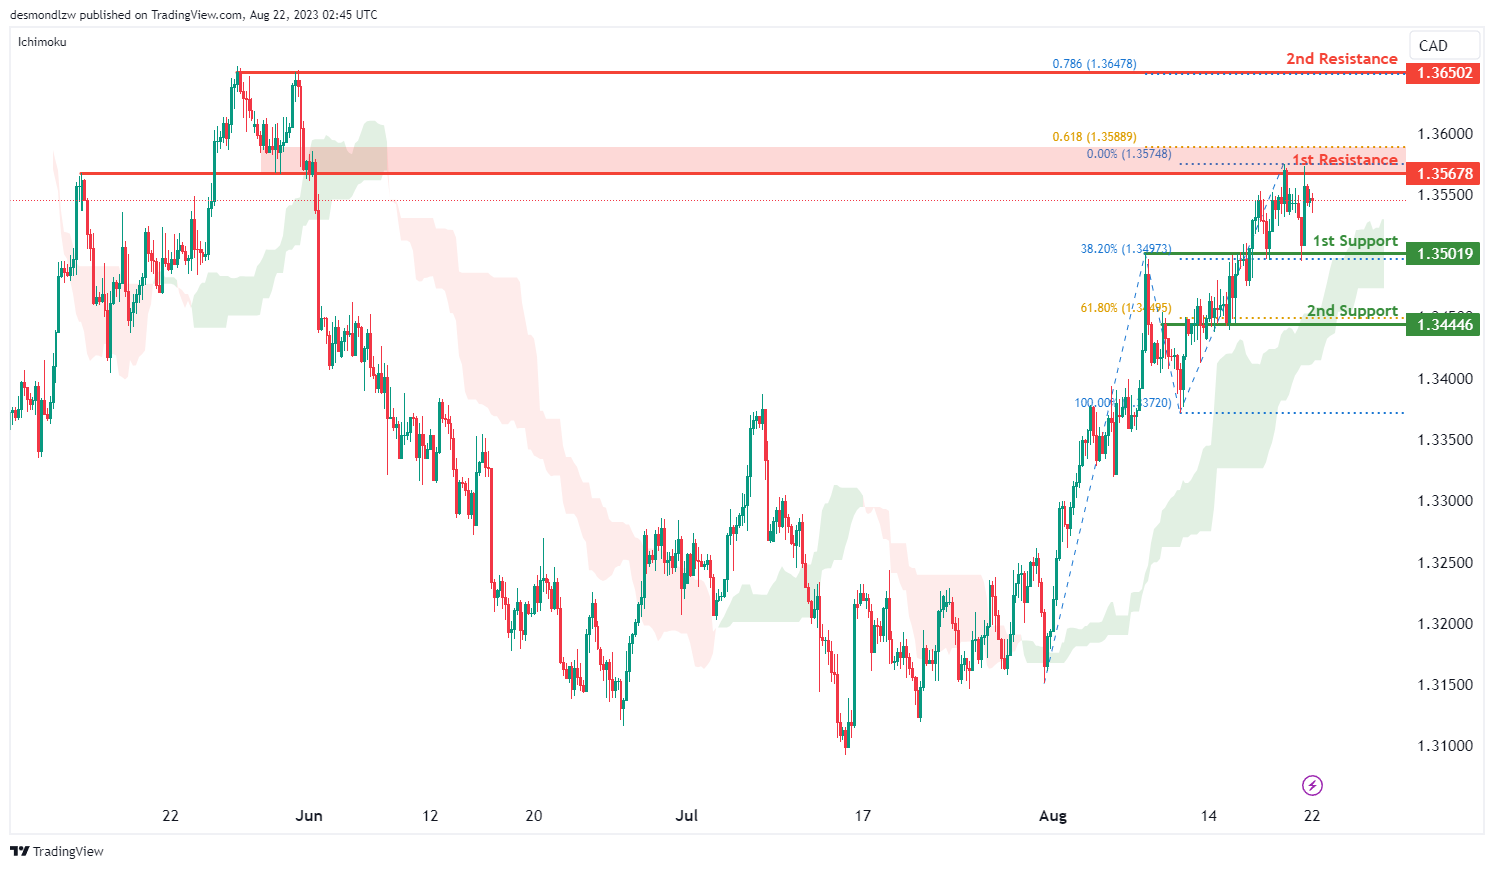
USD/CAD:
The USD/CAD chart currently shows a weak bullish momentum with low confidence, indicating a potential upward trend. The momentum is based on the factor that the price is positioned above the bullish Ichimoku cloud, suggesting a potential for upward movement.
There is a possibility that the price could continue its bullish trajectory towards the 1st resistance level at 1.3568. This level is recognized as an overlap resistance that aligns close to the 61.80% Fibonacci projection level. Furthermore, the 2nd resistance at 1.3650 is a multiple swing-high that aligns with the 78.60% Fibonacci projection level
The 1st support at 1.3502 is identified as an overlap support that aligns with the 38.20% Fibonacci retracement level. Additionally, the 2nd support at 1.3445 is also identified as an overlap support that aligns with the 61.80% Fibonacci retracement level.
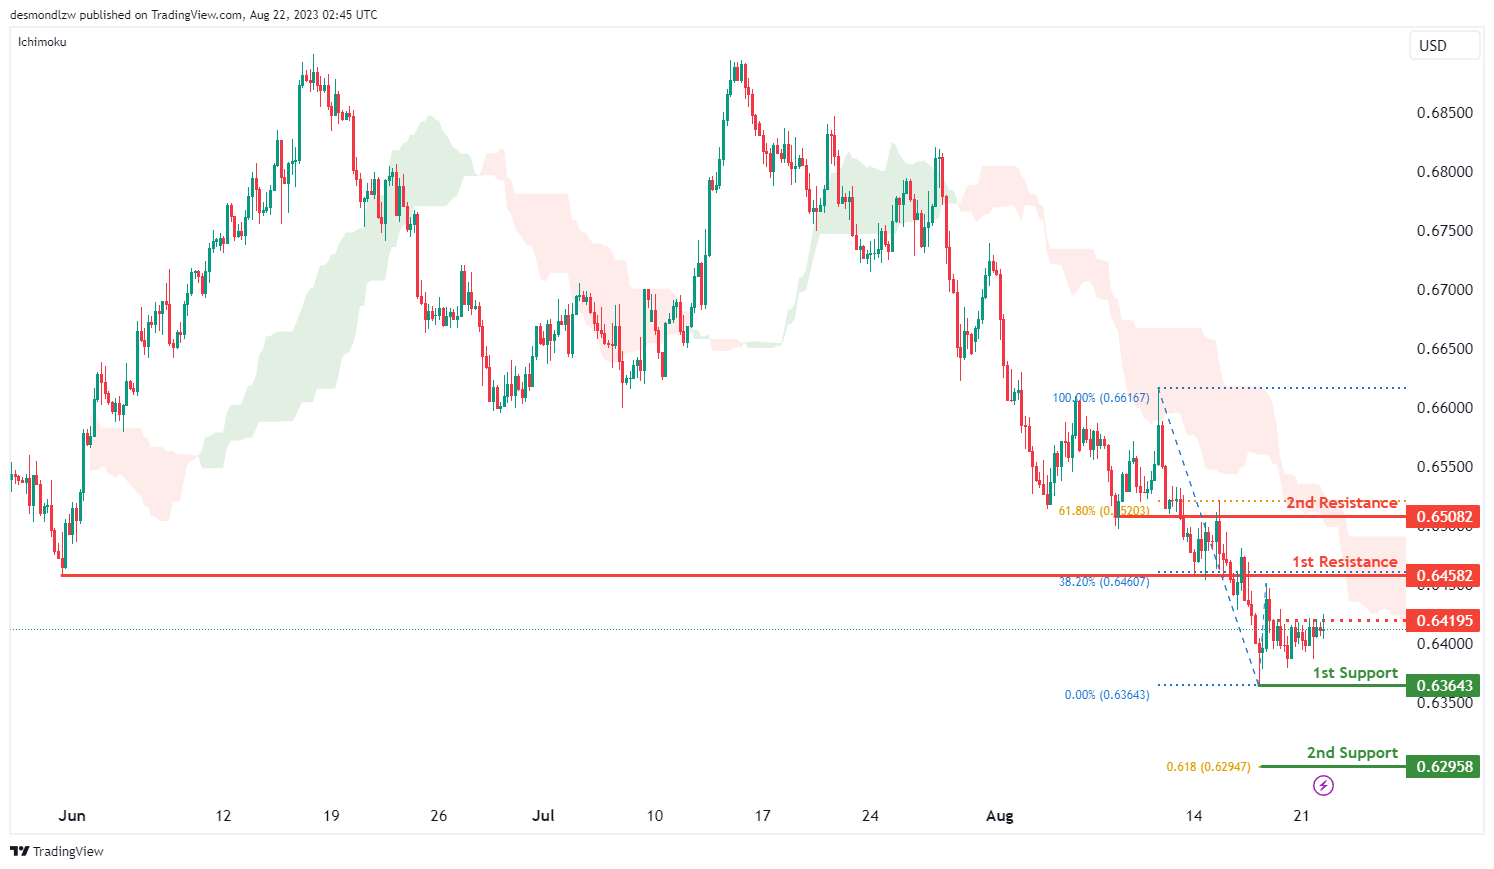
AUD/USD:
The AUD/USD chart is currently displaying a bearish momentum, indicating a potential downward trend as price is positioned below the bearish Ichimoku cloud, indicating a likelihood of continued downward movement. However, there is a potential for a bearish reaction off the 1st resistance level.
The 1st resistance level at 0.6458 is identified as a pullback resistance that aligns with the 38.20% Fibonacci retracement level. There is also an intermediate resistance at 0.6419 that is identified as a pullback resistance. Furthermore, the 2nd resistance at 0.6508 is identified as an overlap resistance that aligns with the 61.80% Fibonacci retracement level.
To the downside, the 1st support level at 0.6364 is identified as a swing-low support. Furthermore, the 2nd support at 0.6296 is identified as a support level that aligns with the 61.80% Fibonacci projection level.
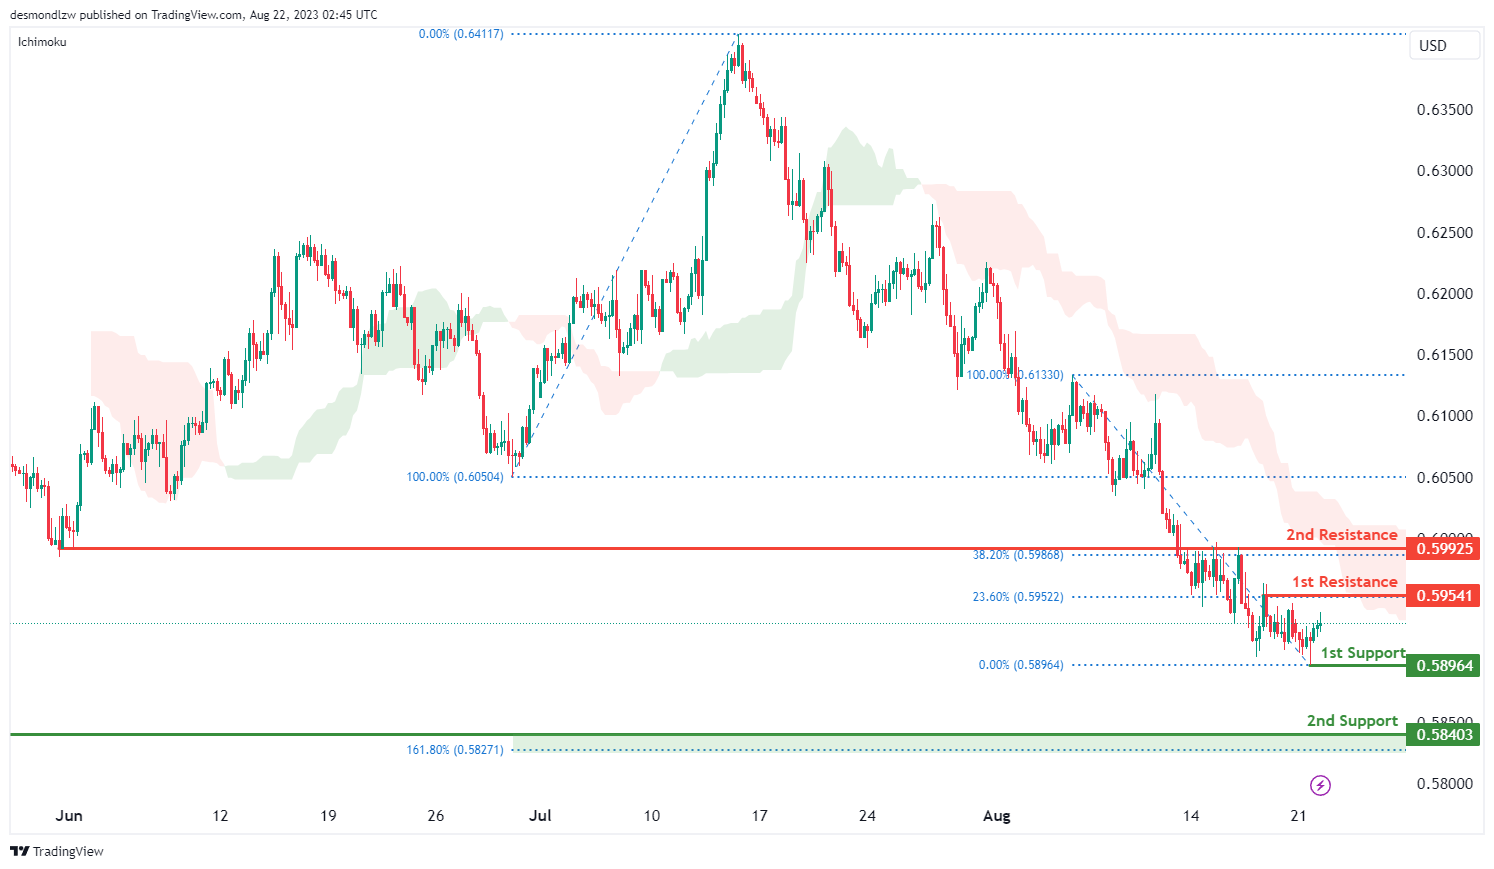
NZD/USD
The NZD/USD chart currently displays a bearish momentum, indicating a prevailing downward trend as price is positioned below the bearish Ichimoku cloud, indicating a likelihood of continued downward movement. However, there is a potential for a bearish reaction off the 1st resistance level.
The 1st resistance level at 0.5954 is identified as a pullback resistance that aligns with the 23.60% Fibonacci retracement level. Furthermore, the 2nd resistance at 0.5993 is identified as an overlap resistance that aligns with the 38.20% Fibonacci retracement level.
The 1st support at 0.5896 is identified as a swing-low support. Additionally, the 2nd support at 0.5840 is identified as a pullback support that aligns close to the 161.80% Fibonacci extension level.
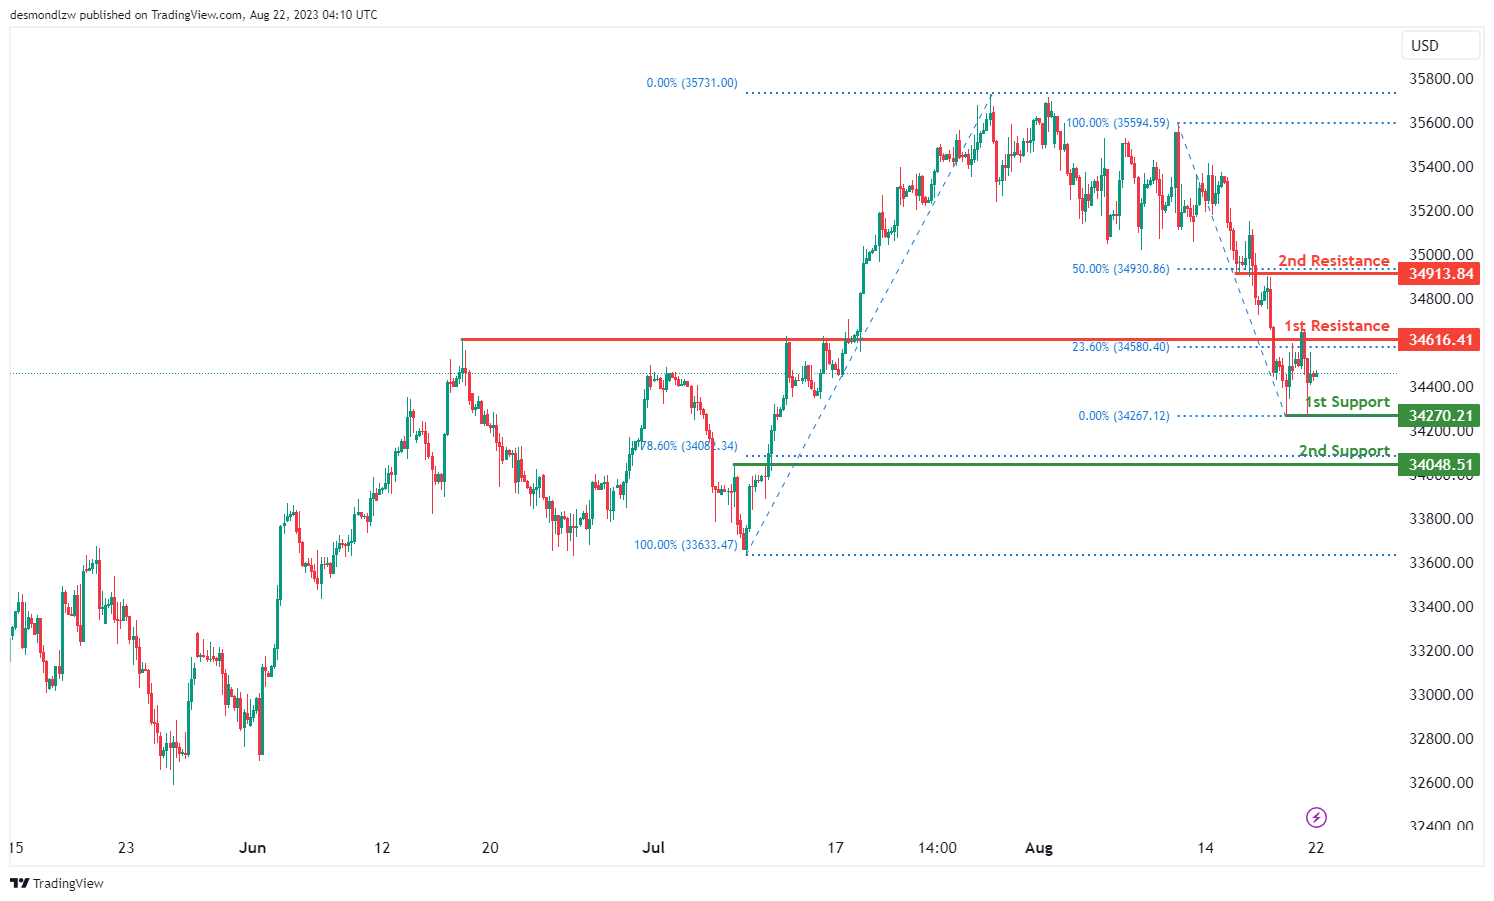
DJ30:
The DJ30 chart indicates a bullish overall momentum. There is a potential for a bullish continuation towards the 1st resistance level.
The 1st support is positioned at 34270.21 and is considered advantageous due to its multi-swing low support characteristics. Additionally, the 2nd support at 34048.51 is valuable as it represents a pullback support, along with a 78.60% Fibonacci Retracement.
On the resistance side, the 1st resistance level at 34616.41 is noteworthy as it represents an overlap resistance, along with a 23.60% Fibonacci Retracement. Furthermore, the 2nd resistance at 34913.84 is significant as it represents a pullback resistance and has a 50% Fibonacci Retracement association.
GER30:
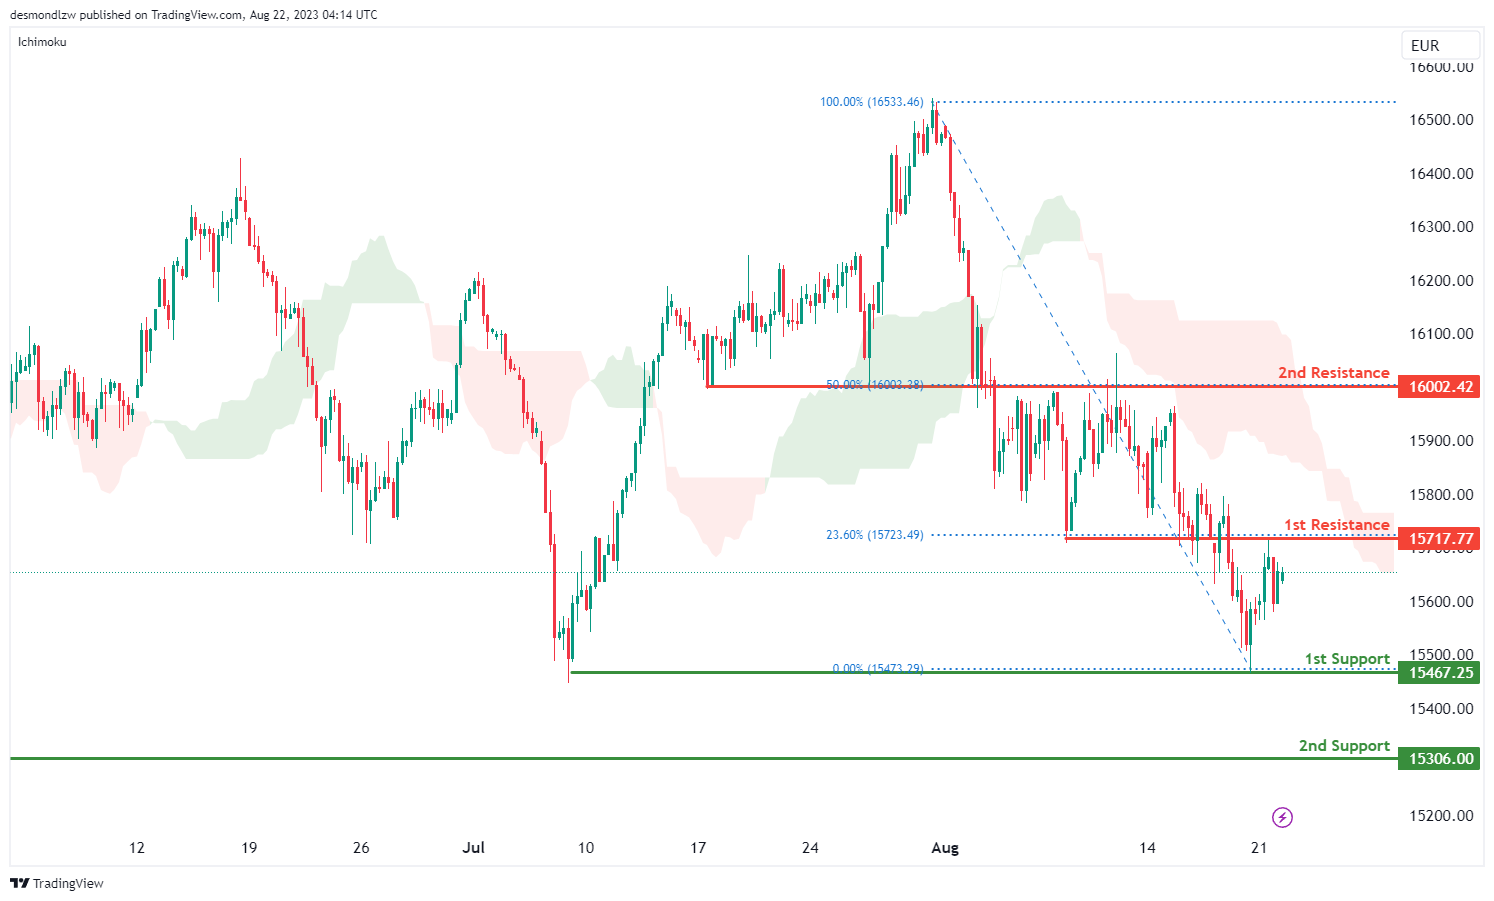
The GER30 chart indicates a bearish overall momentum. The contributing factor to this momentum is that the price is currently below the bearish Ichimoku cloud, which suggests a bearish market trend.
There is a potential scenario where the price might rise towards the 1st resistance level in the short term, but then reverse off it and drop towards the 1st support.
The 1st support is located at 15467.25 and is considered advantageous due to its multi-swing low support characteristics. Additionally, the 2nd support at 15306.00 is valuable as it represents a pullback support.
On the resistance side, the 1st resistance level at 15717.77 is noteworthy as it represents an overlap resistance. Furthermore, the 2nd resistance at 16002.42 is significant due to its pullback resistance attributes, as well as its association with the 50% Fibonacci Retracement.
US500
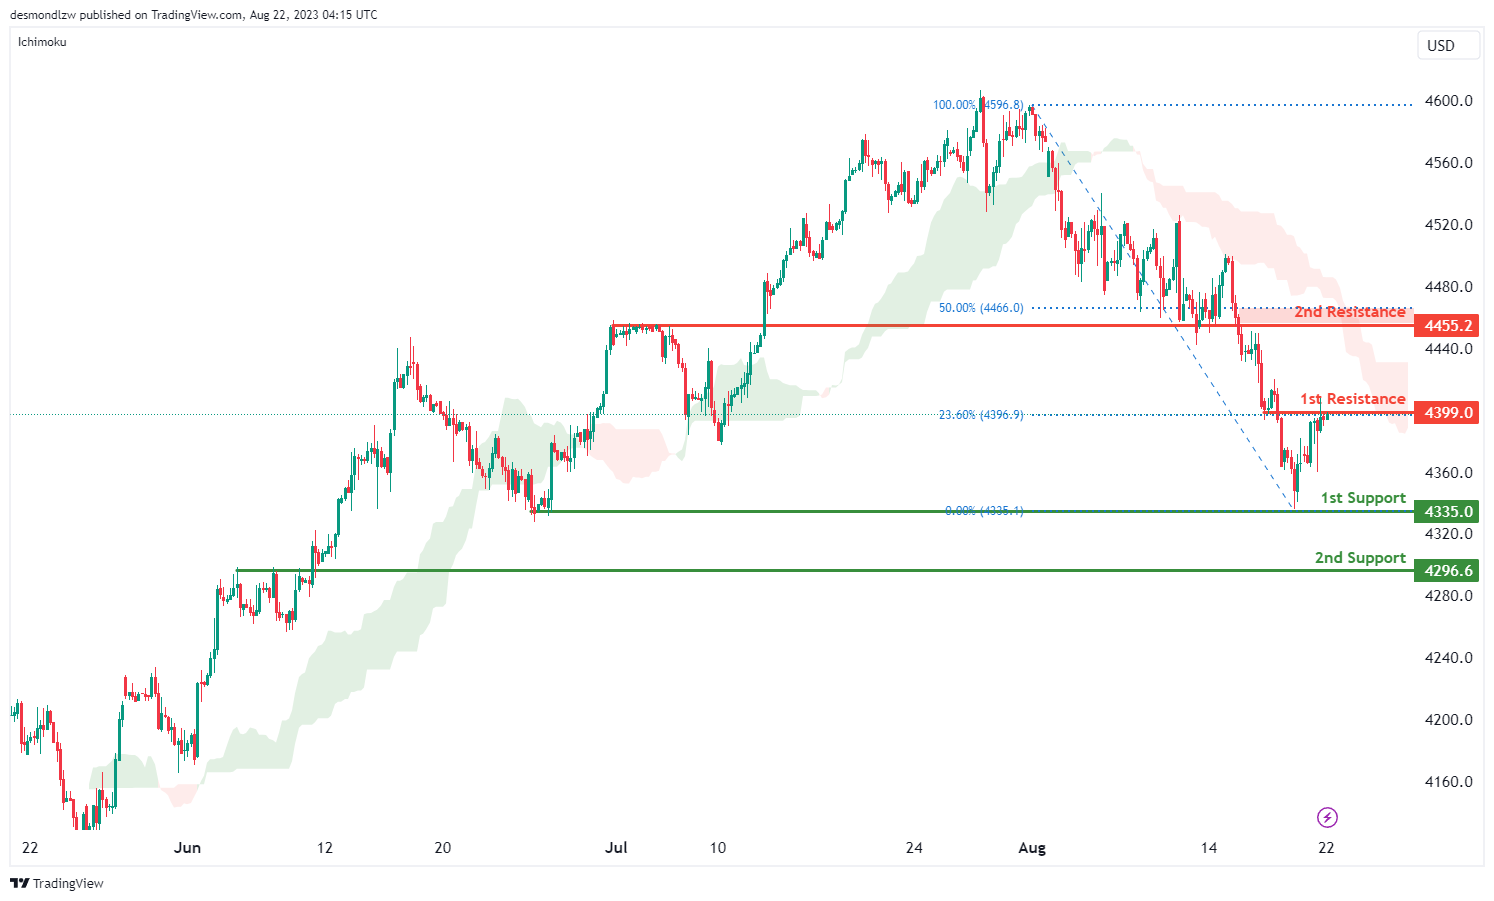
The US500 chart indicates a bearish overall momentum, and this is reinforced by the fact that the price is currently below the bearish Ichimoku cloud.
There is a potential for a bearish reaction off the 1st resistance level, leading the price to drop towards the 1st support.
The 1st support is located at 4335.0 and is considered advantageous due to its multi-swing low support characteristics. Additionally, the 2nd support at 4296.6 is valuable as it represents a pullback support.
On the resistance side, the 1st resistance level at 4399.0 is noteworthy as it represents a pullback resistance, along with a 23.60% Fibonacci Retracement. Furthermore, the 2nd resistance at 4455.2 is significant due to its overlap resistance attributes, as well as its association with the 50% Fibonacci Retracement.
BTC/USD:
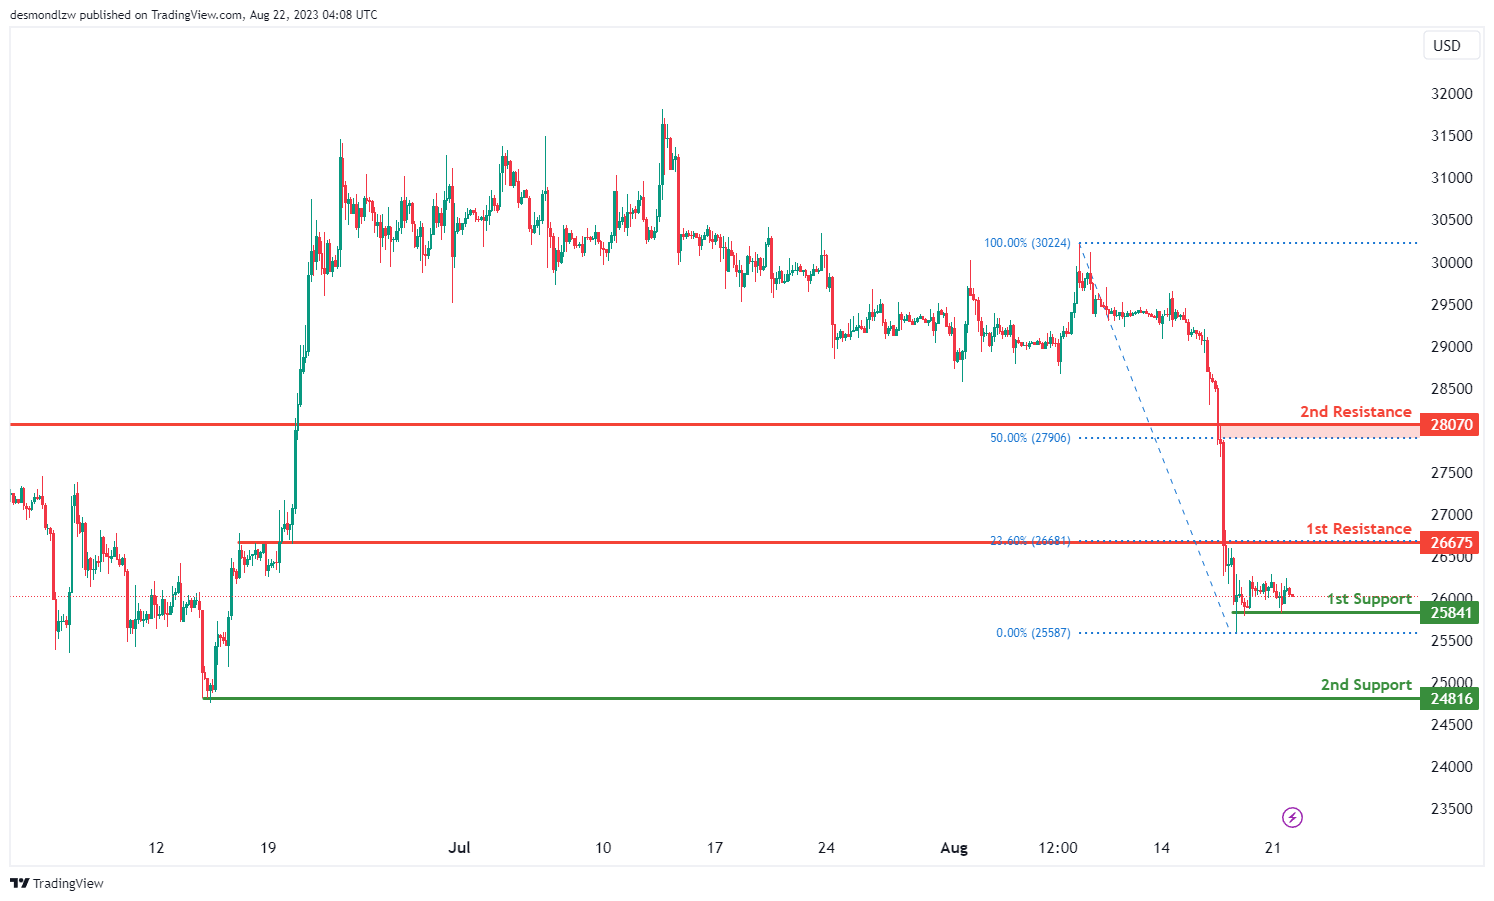
The BTC/USD chart indicates a bearish overall momentum. There is a potential for a bearish continuation towards the 1st support level.
The 1st support is positioned at 25841 and is considered advantageous due to its multi-swing low support characteristics. Additionally, the 2nd support at 24816 is valuable as it represents a swing low support.
On the resistance side, the 1st resistance level at 26675 is noteworthy as it represents an overlap resistance, along with a 23.60% Fibonacci Retracement. Furthermore, the 2nd resistance at 28070 is significant due to its overlap resistance attributes, as well as its association with the 50% Fibonacci Retracement.
ETH/USD:
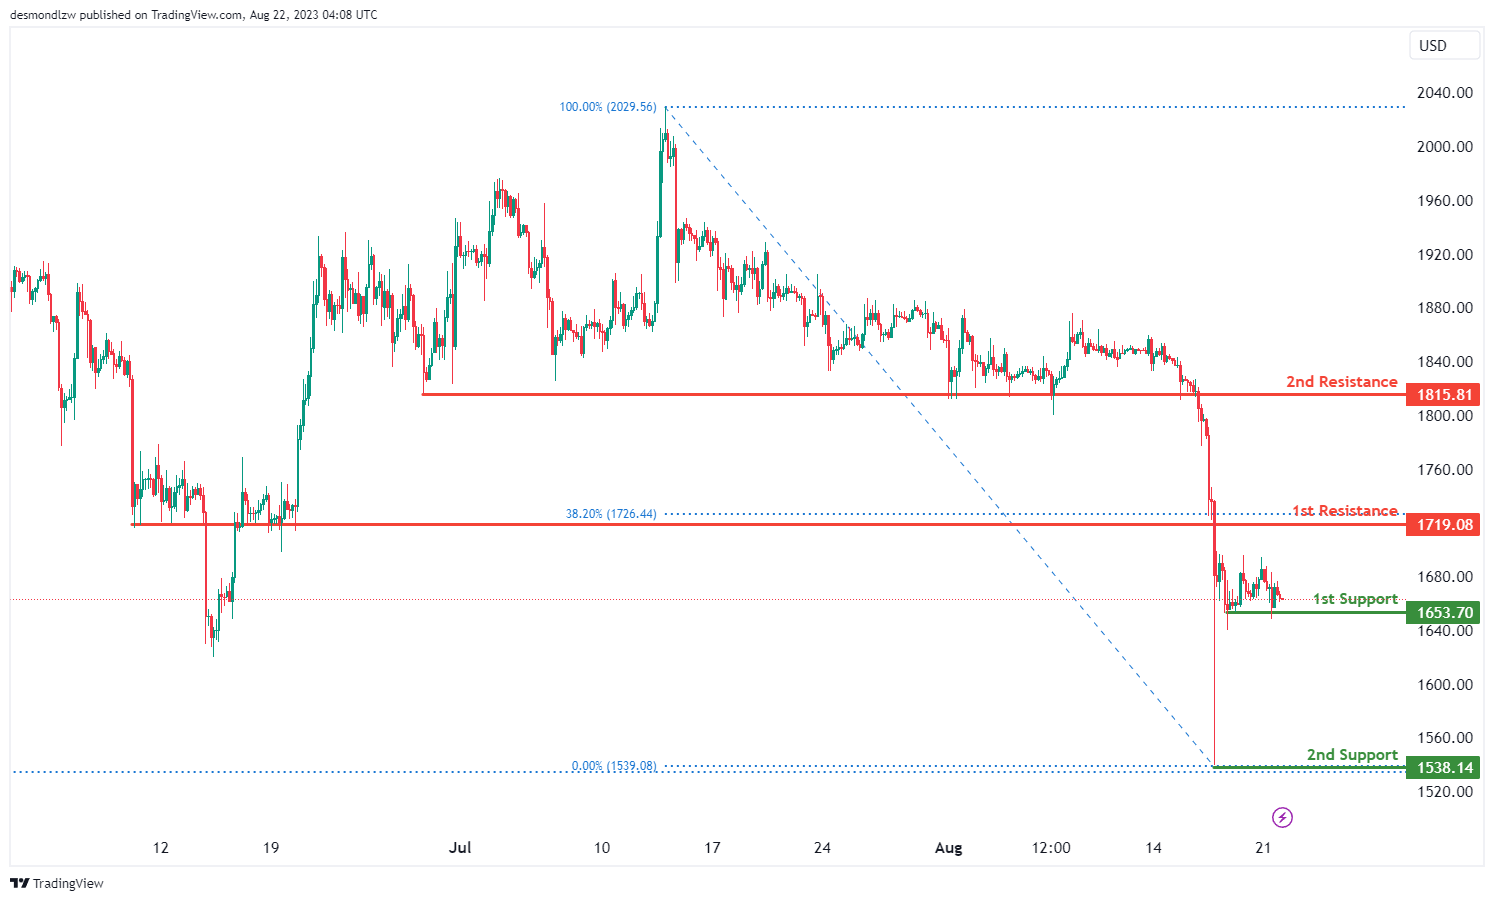
The ETH/USD chart indicates a bearish overall momentum. There is a potential for a bearish continuation towards the 1st support level.
The 1st support is located at 1653.70 and is considered advantageous due to its multi-swing low support characteristics. Additionally, the 2nd support at 1538.14 is valuable as it represents a swing low support.
On the resistance side, the 1st resistance level at 1719.08 is noteworthy as it represents an overlap resistance, along with a 38.20% Fibonacci Retracement. Furthermore, the 2nd resistance at 1815.81 is significant as it represents a pullback resistance.
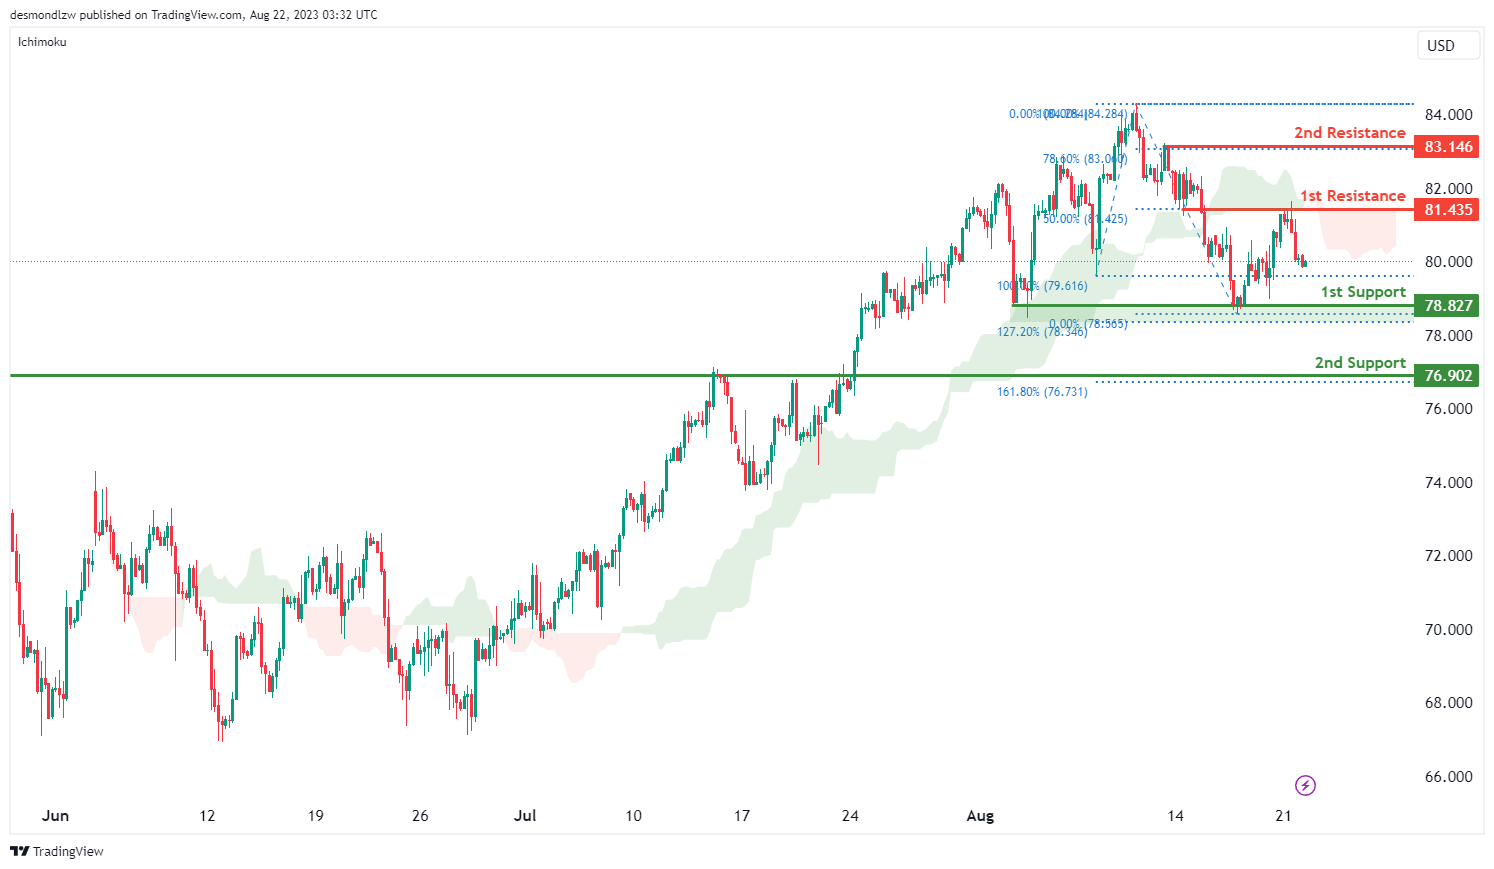
WTI/USD:
The WTI/USD chart currently exhibits a bearish momentum, indicating a prevailing downward trend that is attributed to price being positioned below the bearish Ichimoku cloud.
The 1st support level at 78.83 is identified as an overlap support that aligns with the 127.20% Fibonacci extension level. Similarly, the 2nd support at 76.90 is also identified as an overlap support that aligns with the 161.80% Fibonacci extension level.
To the upside, the 1st resistance level at 81.44 is identified as an overlap resistance that aligns with the 50.00% Fibonacci retracement level. Furthermore, the 2nd resistance at 83.15 is identified as a pullback resistance that coincides with the 78.60% Fibonacci retracement level.
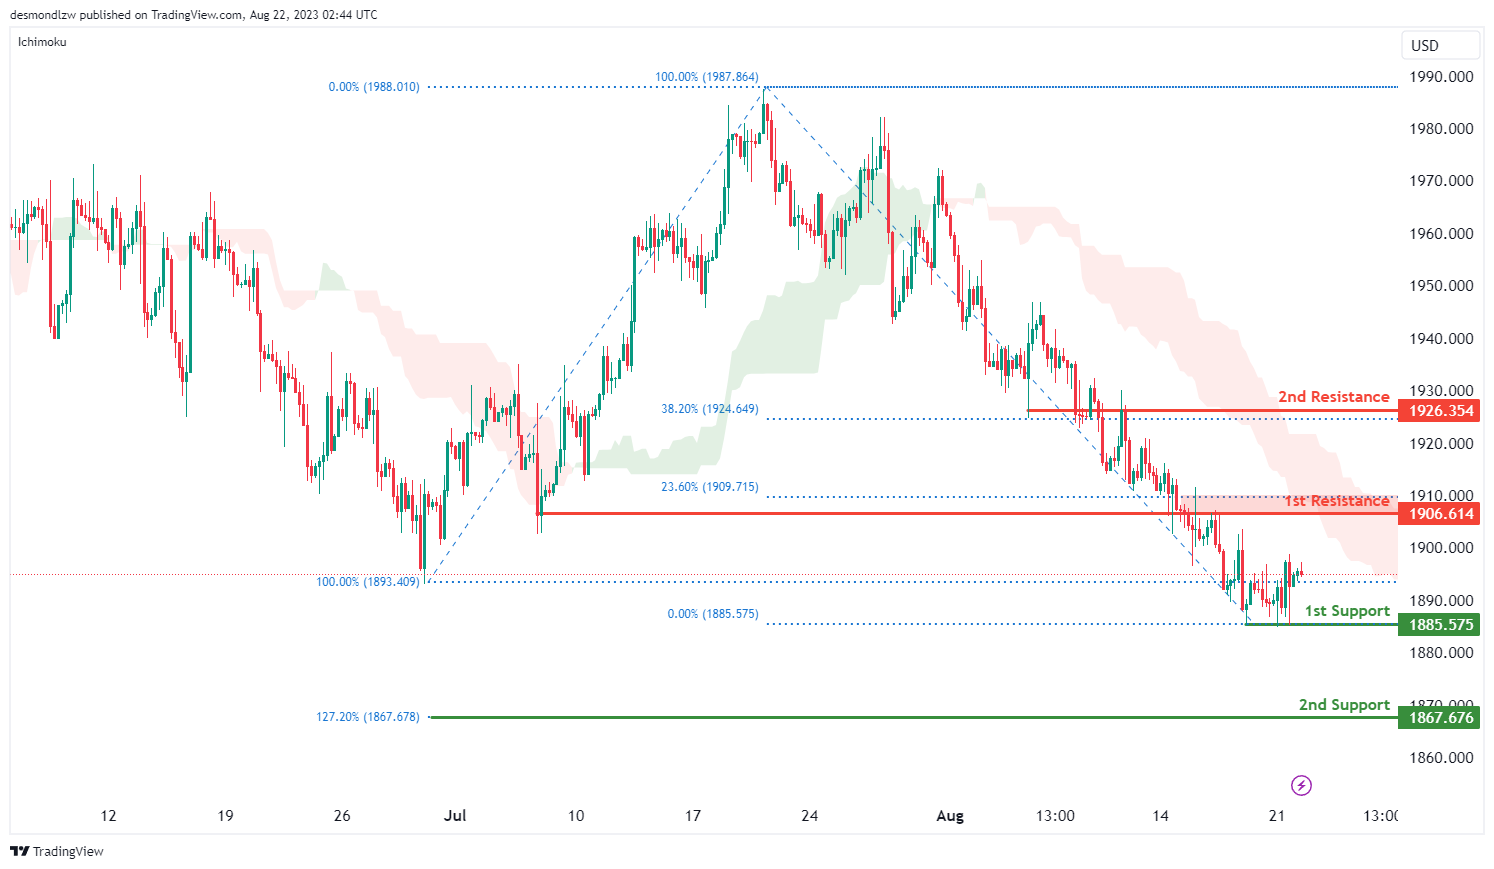
XAU/USD (GOLD):
The current chart momentum suggests a neutral trend in the market, with no clear indications of strong bullish or bearish movements. There is a possibility that price could fluctuate between the 1st resistance and the 1st support levels.
The 1st support at 1885.58 is identified as a multiple swing-low support. Additionally, the 2nd support at 1867.68 is identified as a support level that aligns with the 127.20% Fibonacci extension level.
To the upside, the 1st resistance at 1906.61 is identified as an overlap resistance that aligns with the 23.60% Fibonacci retracement level. Similarly, the 2nd resistance at 1926.35 is also identified as an overlap resistance that aligns with a 38.20% Fibonacci retracement level.


