
DXY:
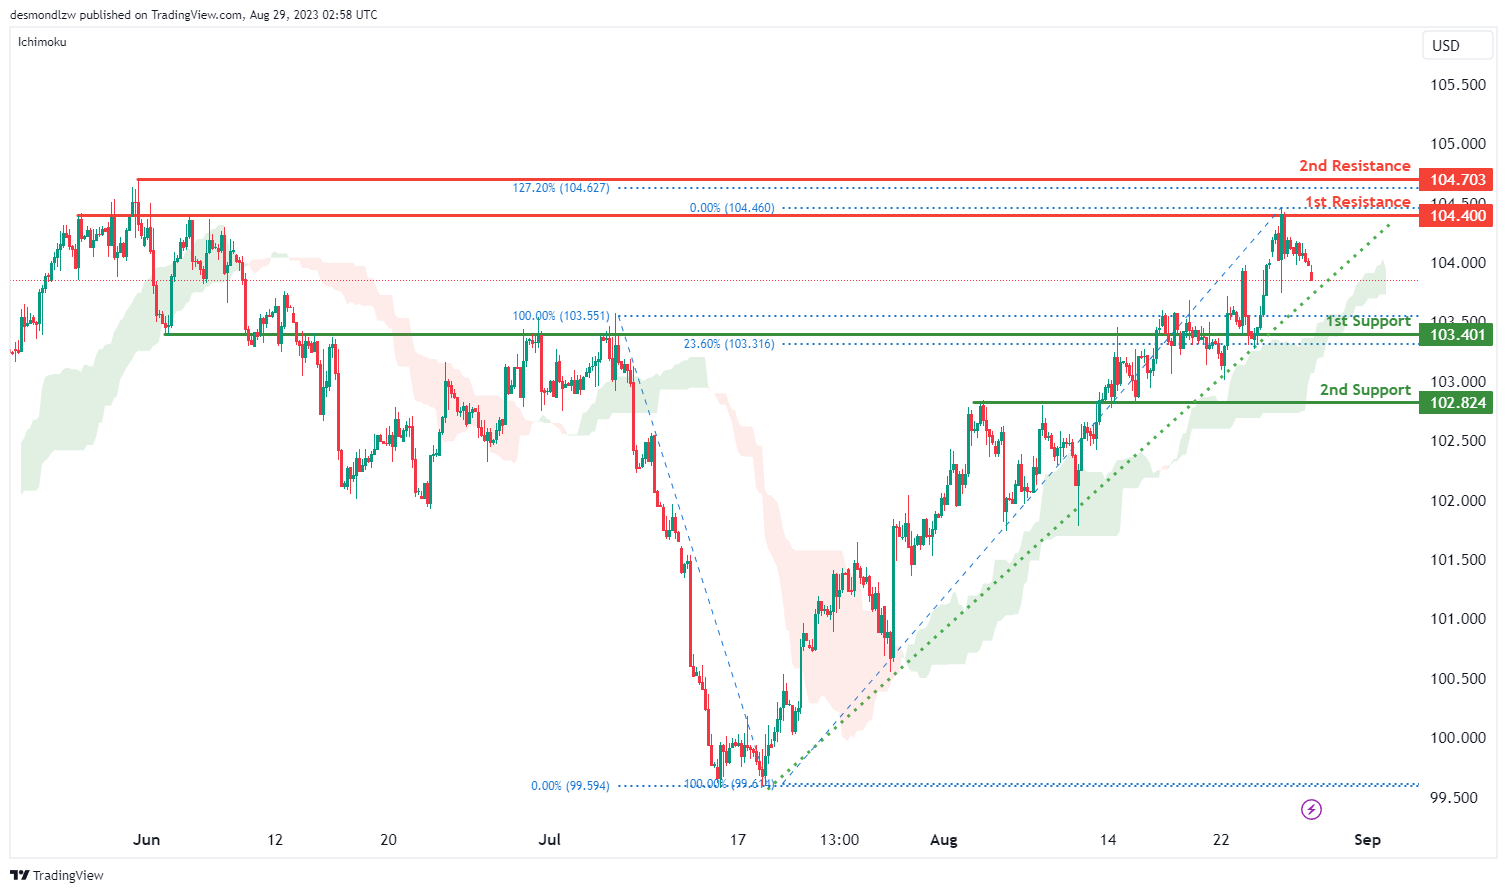
The DXY (US Dollar Index) chart is currently showing bullish overall momentum, suggesting a potential upward trend in the price. The price is above a major ascending trend line, indicating the possibility of further bullish movement, and it’s also above the bullish Ichimoku cloud, which reinforces the bullish sentiment.
There is a potential price movement scenario: a short-term drop to the 1st support level before a bounce and a subsequent rise to the 1st resistance level.
The 1st support level at 103.40 is considered as pullback support. This suggests that if the price experiences a temporary decline, it might find support around this level due to the historical significance of pullback support zones.
The 2nd support level at 102.82 is an overlap support, indicating that this level has acted as support in the past. This adds to the potential strength of this support level, especially since it aligns with the ascending trend line and the Ichimoku cloud, both of which could act as additional support factors.
On the bullish side, the 1st resistance level at 104.40 is marked as an overlap resistance. This means that historical price action has encountered resistance around this level, making it a potentially important area for the price to overcome.
EUR/USD:
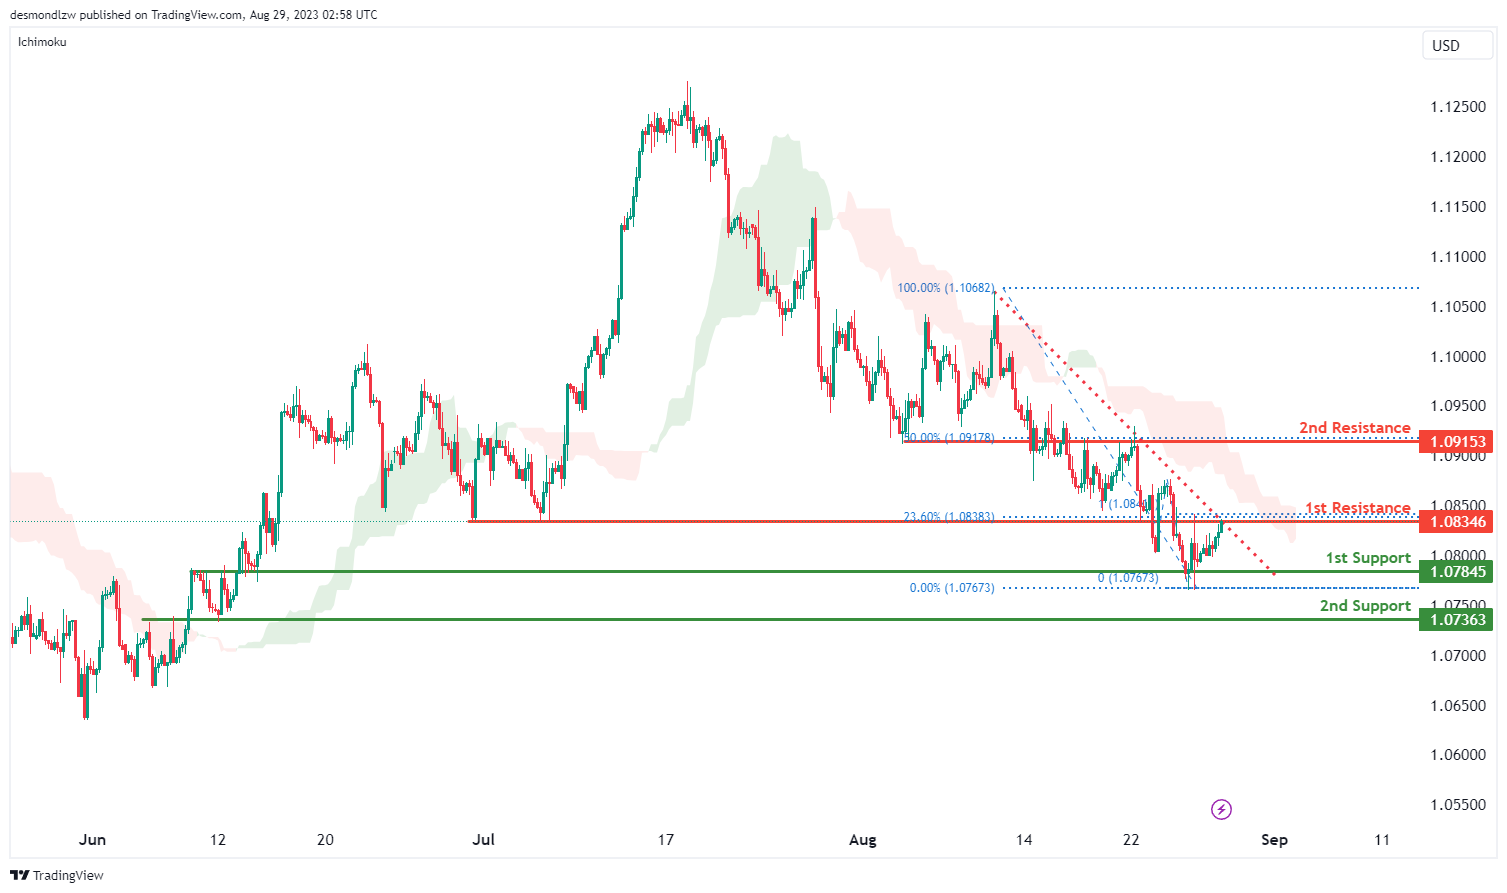
The EUR/USD chart is currently displaying bearish overall momentum, indicating the potential for a downward trend in the price. Additionally, the price is below a major descending trend line, suggesting the presence of bearish momentum. It is positioned just below the bearish Ichimoku cloud, which commonly implies a possible price reversal from that level.
A potential price movement scenario could involve a bearish reaction off the 1st resistance level, leading to a drop towards the 1st support level.
The 1st support level at 1.0736 is identified as an overlapping support. This suggests that historical price action has found support around this level in the past.
The 2nd support level at 1.0736 is also an overlapping support. This further reinforces the potential significance of this level as a support zone.
On the resistance side, the 1st resistance level at 1.0834 is marked as an overlapping resistance. Historical price action has encountered resistance around this level previously, which could make it an important barrier.
The 2nd resistance level at 1.0915 is identified as an overlapping resistance as well as a 50% Fibonacci Retracement level. These factors together contribute to its significance as a potential resistance area.
EUR/JPY:
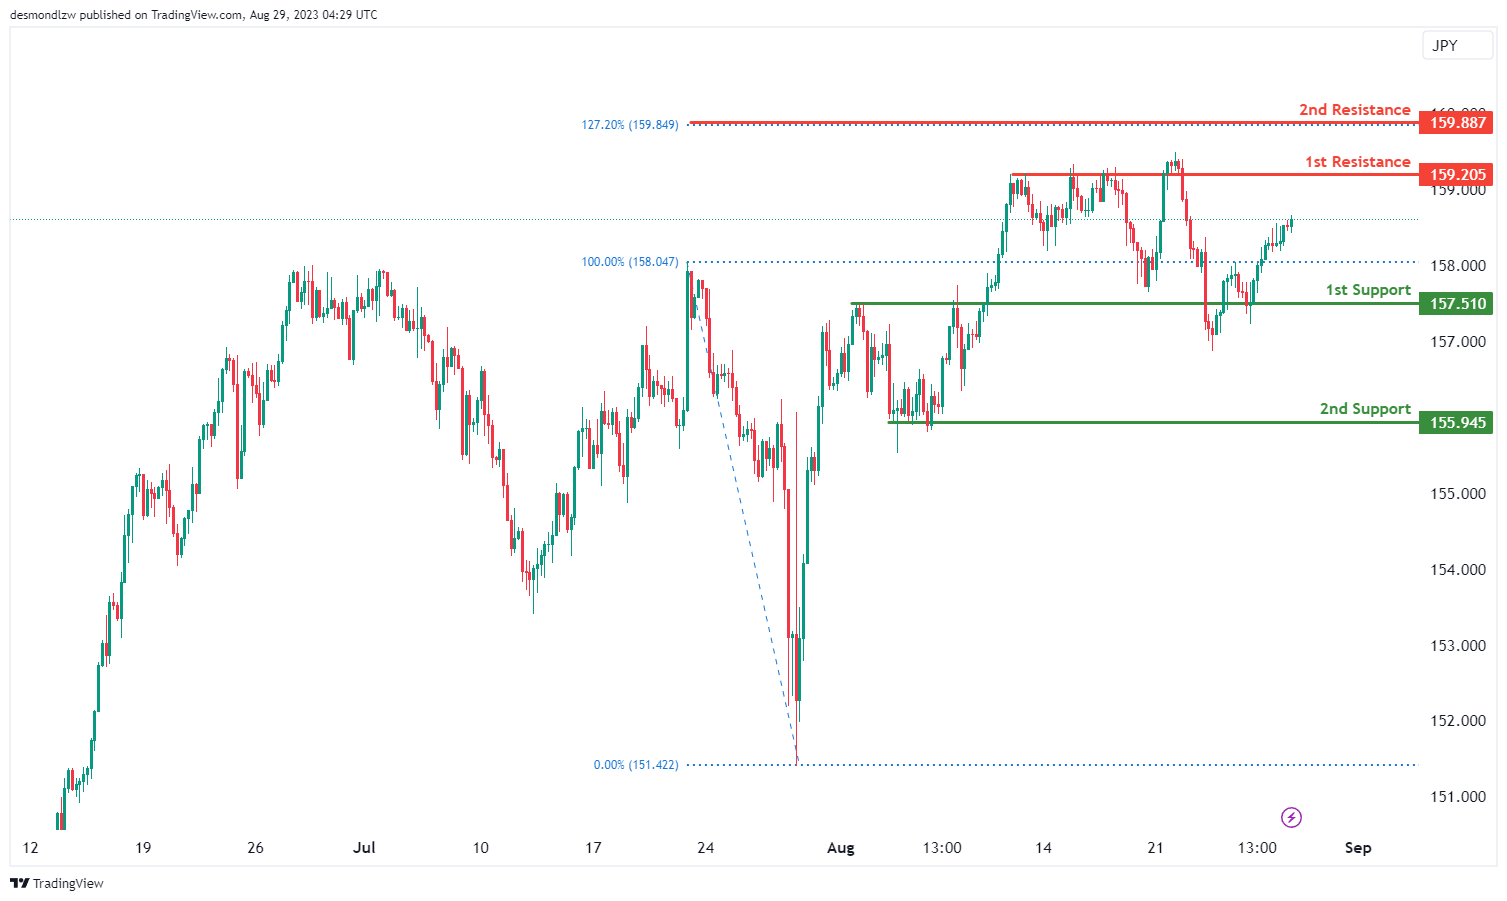
The EUR/JPY chart indicates a bullish overall momentum. Based on the analysis, there is potential for a bullish continuation towards the 1st resistance level.
The 1st support at 157.51 is an overlap support.
The 2nd support at 155.94 is significant due to its multi-swing low support characteristics.
On the resistance side, the 1st resistance at 159.20 is an overlap resistance.
The 2nd resistance at 159.88 is noteworthy as it represents a 127.20% Fibonacci Extension.
EUR/GBP:
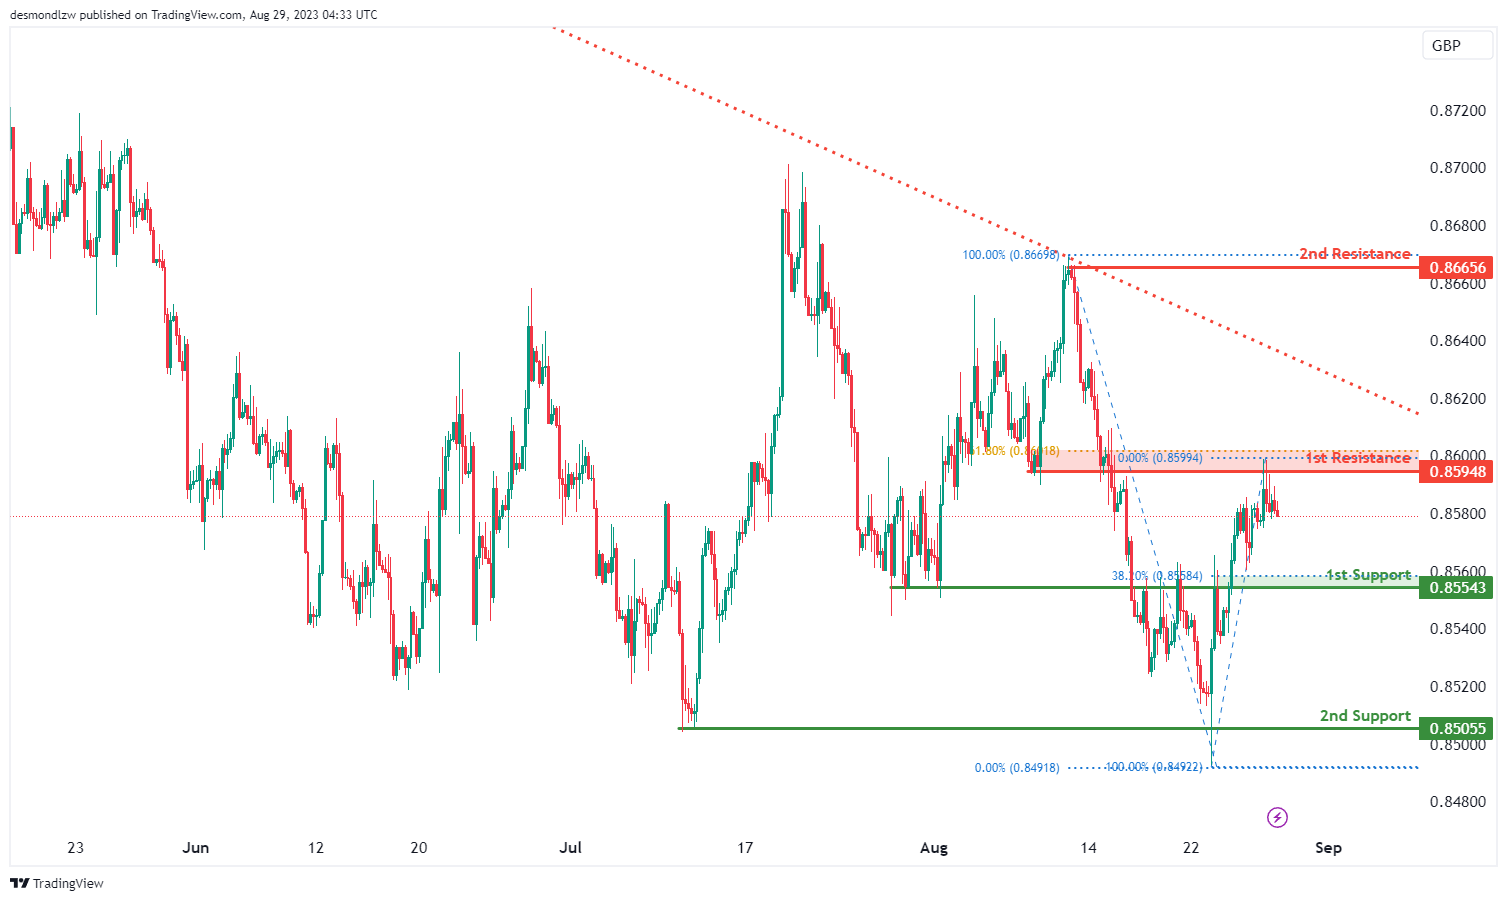
The EUR/GBP chart suggests a bearish overall momentum, with the price below a major descending trend line, indicating the potential for further bearish movement.
The 1st support level at 0.8554 is considered an overlap support.
The 2nd support level at 0.8505 is important due to its characteristics as a swing low support.
On the resistance side, the 1st resistance level at 0.8594 is an overlap resistance.
The 2nd resistance level at 0.8665 is significant as it represents a swing high resistance.
GBP/USD:
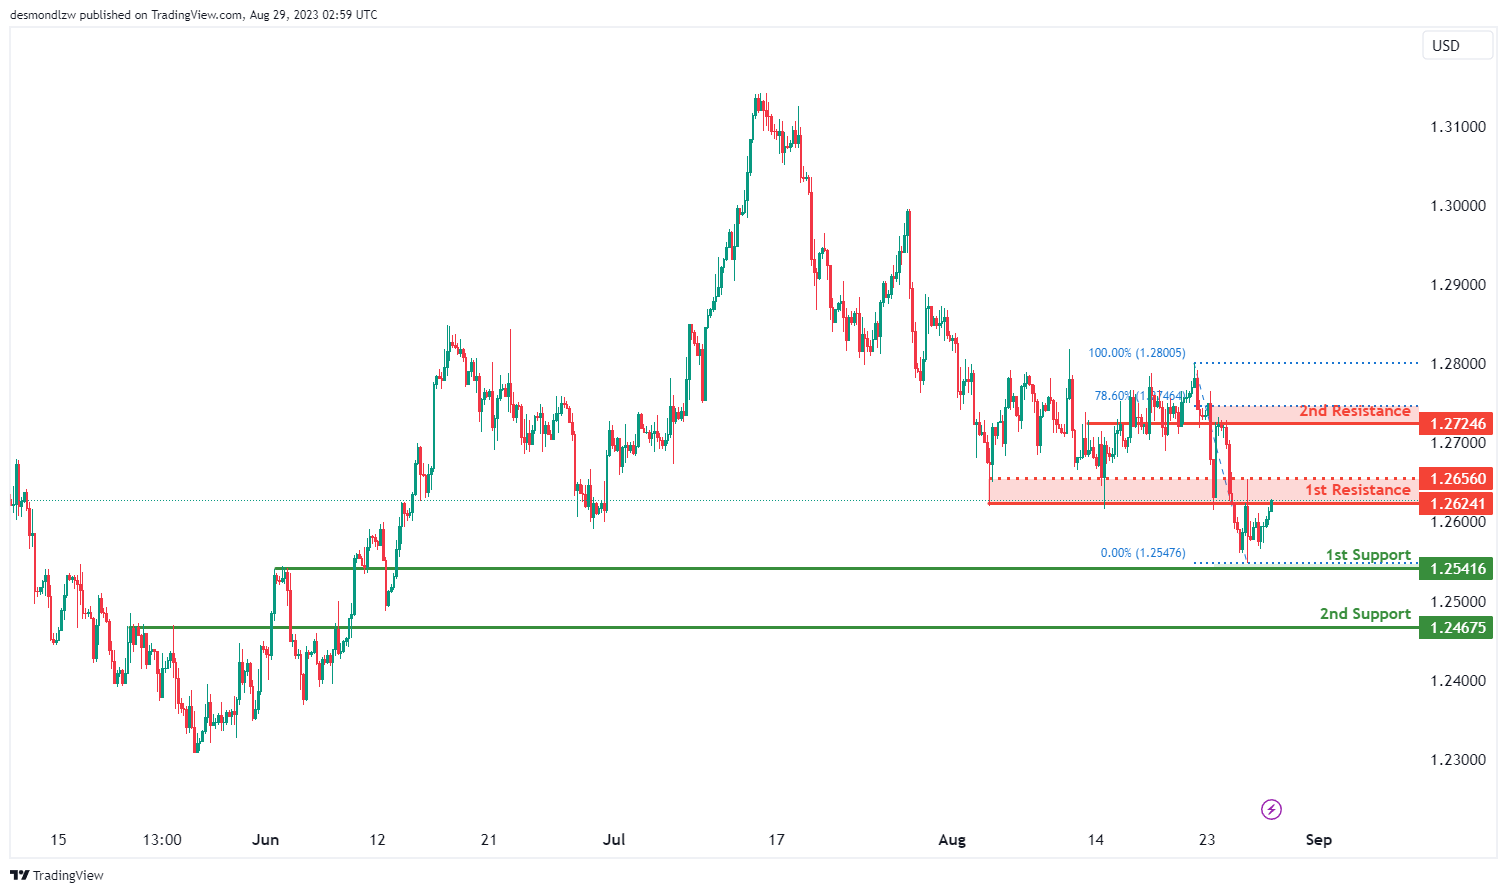
The GBPUSD chart is demonstrating a bearish overall momentum The potential price movement scenario suggests a bearish reaction could occur off the 1st resistance level, leading to a drop in price towards the 1st support level. The 1st support level at 1.2541 is considered significant due to it being an overlap support, indicating historical instances of price finding support around this level.
Additionally, the 2nd support level at 1.2467 is recognized as a pullback support, further enhancing its potential as a level of price support. On the resistance side, the 1st resistance level at 1.2624 holds importance as an overlap resistance, signifying historical instances of price encountering resistance at this level. The 2nd resistance level at 1.2724 is notable for being an overlap resistance as well as representing the 78.60% Fibonacci Retracement level. These factors combine to emphasize the significance of the 2nd resistance level as a potential area of resistance.
GBP/JPY:
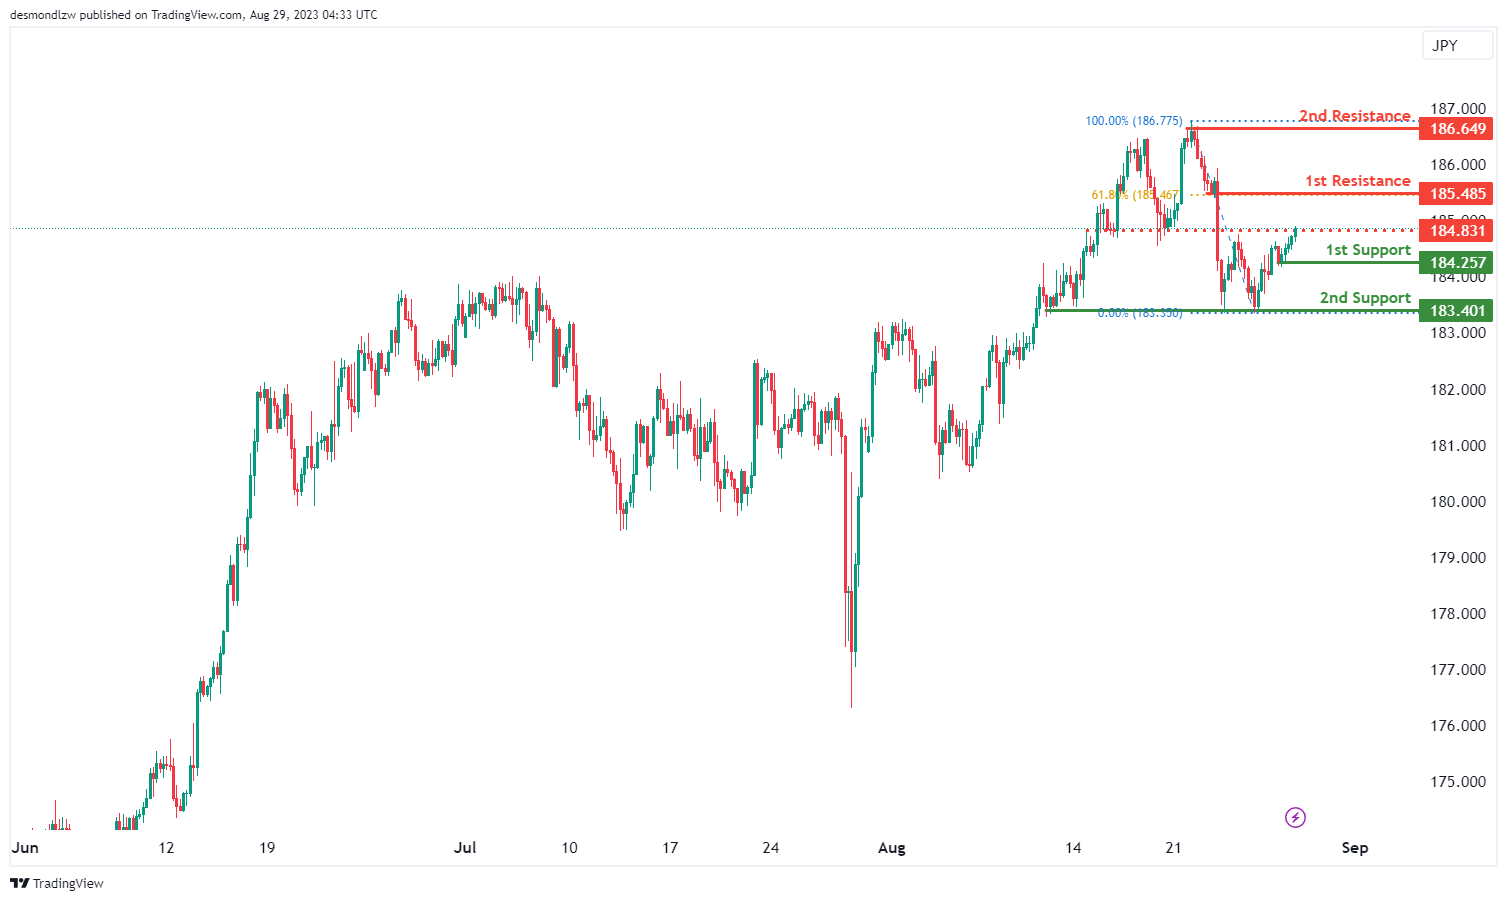
The GBP/JPY chart suggests a bullish overall momentum.
The 1st support level at 184.25 is important as it is a swing low support. The 2nd support level at 183.40 gains significance due to its characteristics as a multi-swing low support.
On the resistance side, the 1st resistance level at 185.48 is considered a pullback resistance and coincides with the 61.80% Fibonacci retracement level. The 2nd resistance level at 186.64 is a significant swing high resistance.
An intermediate resistance at 184.83, being an overlap resistance, adds to the overall analysis.
USD/CHF:
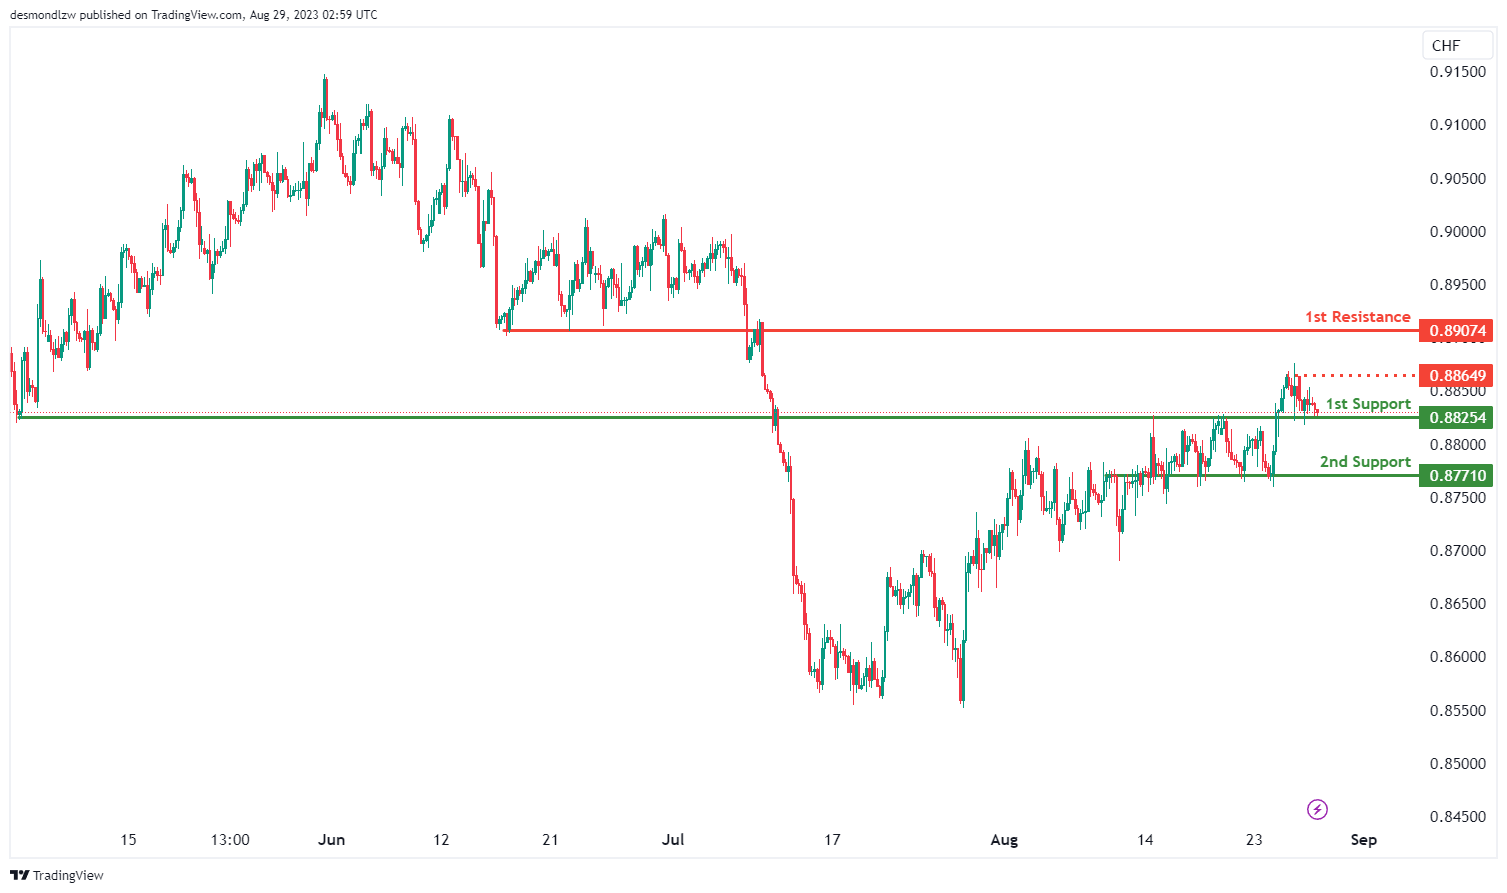
The USD/CHF chart is demonstrating a bullish momentum. A potential price movement scenario suggests the possibility of a bullish bounce occurring off the 1st support level, leading the price towards the 1st resistance level. The significance of these levels is as follows:
The 1st support level at 0.8825 holds importance due to being an overlap support, indicating instances in the past where the price found support around this level. Similarly, the 2nd support level at 0.8771 is also considered significant as an overlap support, further strengthening its potential as a level of price support.
On the resistance side, the 1st resistance level at 0.8907 is noteworthy for being a pullback resistance, suggesting historical occurrences of the price encountering resistance at this level after a pullback. Additionally, the intermediate resistance at 0.8864 is identified as a swing high resistance, implying that the price previously faced resistance around this level during swing highs.
USD/JPY:
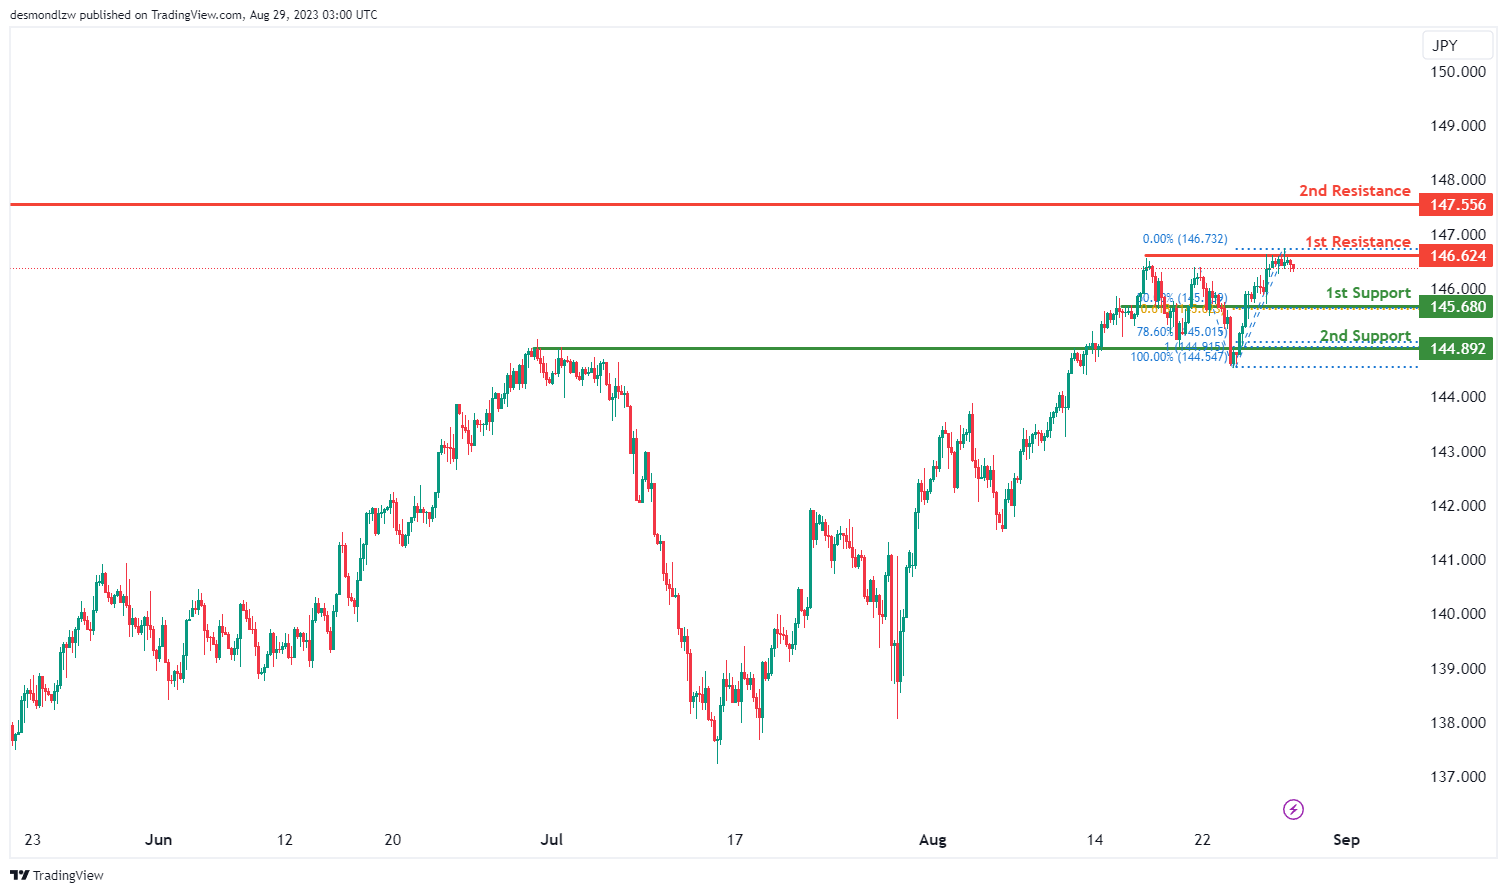
The USD/JPY chart currently displays a bearish momentum. A potential price movement scenario suggests the potential for a bearish continuation. The 1st support level at 145.68 is considered significant due to being an overlap support, indicating historical instances where the price found support around this level. Moreover, this level aligns with the 50% Fibonacci Retracement and the 61.80% Fibonacci Projection, adding to its significance as a potential support area.
The 2nd support level at 144.89 is identified as a pullback support, suggesting that the price might experience support around this level, particularly given its alignment with the 78.60% Fibonacci Retracement.
On the resistance side, the 1st resistance level at 146.62 is noted for being a multi-swing high resistance. This implies that the price has previously encountered resistance around this level during multiple swing highs.
Similarly, the 2nd resistance level at 147.55 is recognized as a swing high resistance, indicating instances where the price faced resistance around this level during past swing highs.
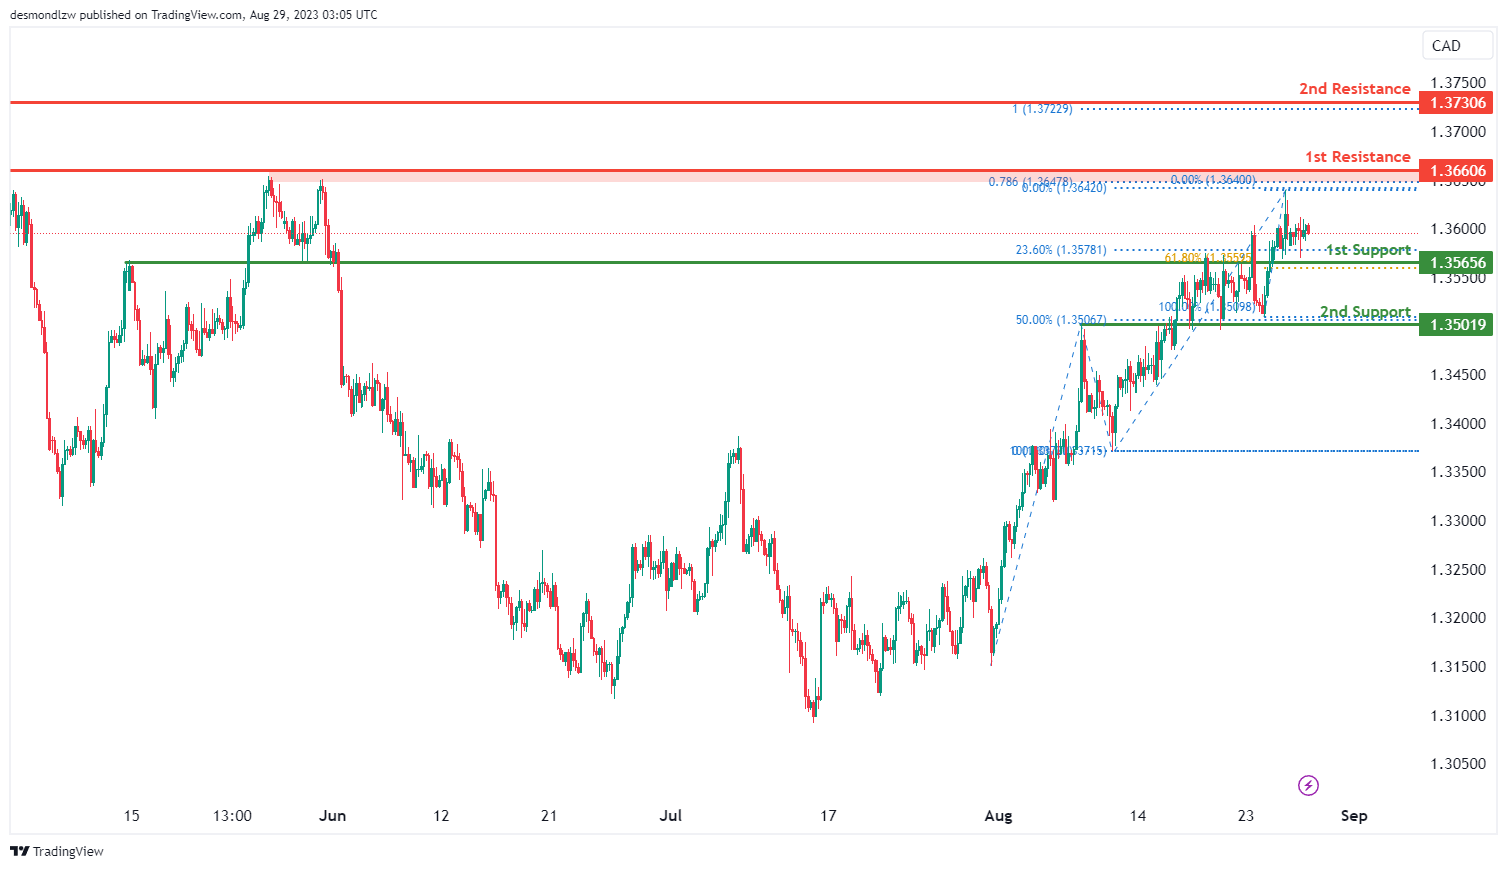
USD/CAD:
The USD/CAD chart is currently exhibiting an overall bearish momentum, implying a downward trend in price. In this scenario, there is potential for price to continue its bearish movement and potentially reach the 1st support level.
The 1st support level at 1.3566 is identified as an overlap support that aligns with a confluence of Fibonacci levels i.e. the 23.60% and the 61.80% retracement levels. In addition, the 2nd support level at 1.3502 is also identified as an overlap support that coincides with the 50.00% Fibonacci retracement level.
To the upside, the 1st resistance level at 1.3661 is identified as an overlap resistance that aligns with the 78.60% Fibonacci projection level. Furthermore, the 2nd resistance level at 1.3731 is also identified as an overlap resistance that aligns with the 100.00% Fibonacci projection level.
AUD/USD:
The AUD/USD chart is currently showing an overall bullish momentum, indicating an upward trend in price. Within this context, there is potential for price to continue its bullish movement and potentially reach the 1st resistance level.
The 1st resistance level at 0.6463 is identified as an overlap resistance that aligns with the 23.60% Fibonacci retracement level. In addition, the 2nd resistance level at 0.6506 is also identified as an overlap resistance that aligns with the 100.00% Fibonacci projection level.
To the downside, the 1st support level at 0.6386 is identified as an overlap support while the 2nd support level at 0.6338 is identified as a support level that aligns with the 127.20% Fibonacci extension level.

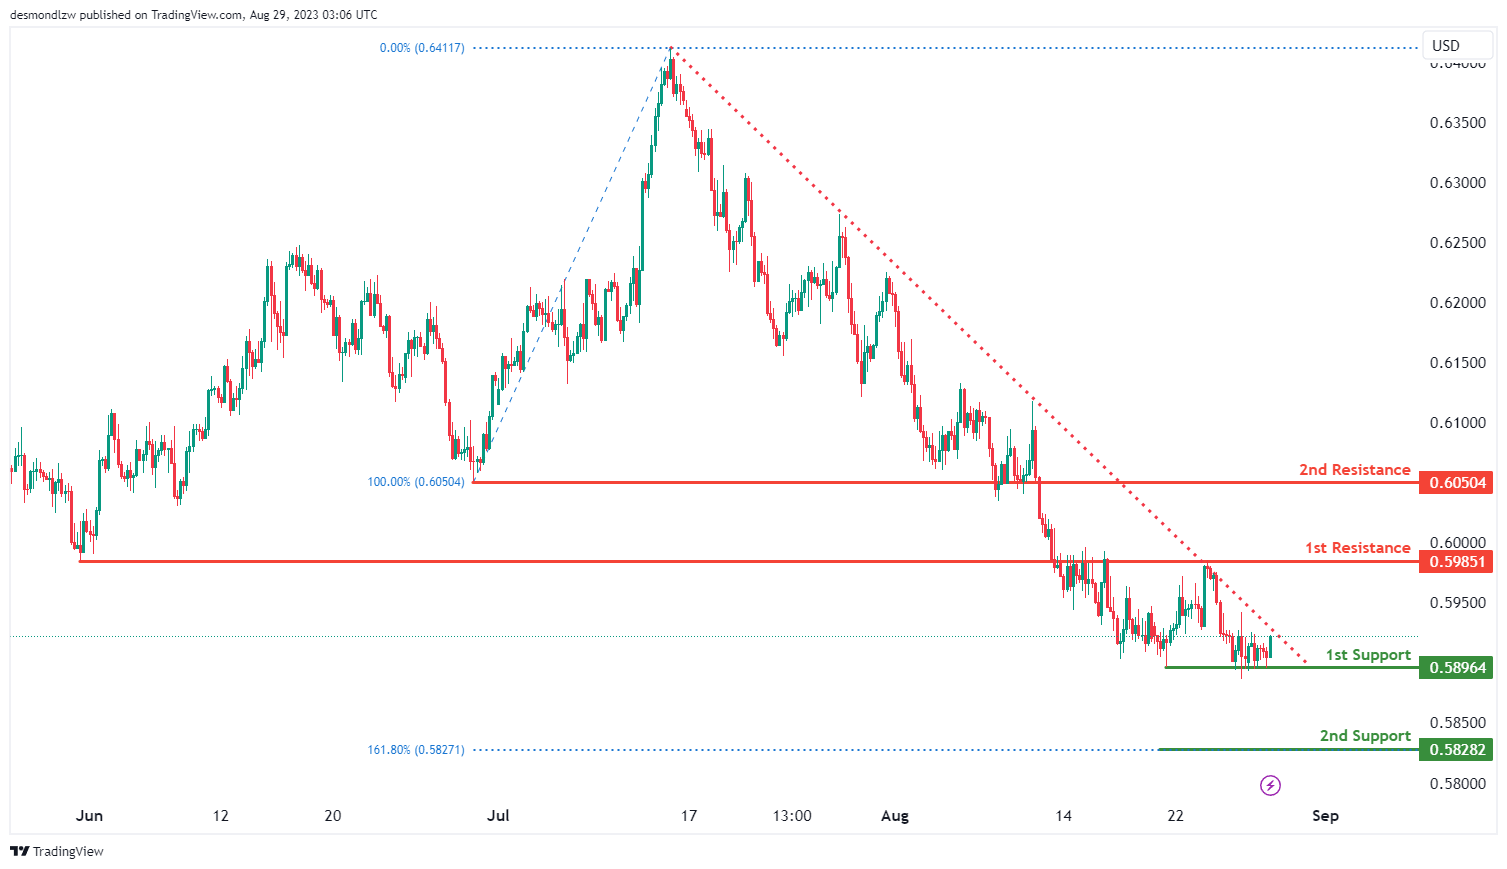
NZD/USD
The NZD/USD chart is currently experiencing a bullish overall momentum with price attempting to breakout above a descending resistance line. This potential breakout could initiate a bullish price movement towards the 1st resistance.
The 1st resistance level at 0.5985 is identified as an overlap resistance. Similarly, the 2nd resistance level at 0.6050 is also identified as an overlap resistance.
To the downside, the 1st support level at 0.5896 is identified as a multiple swing-low support. Furthermore, the 2nd support level at 0.5828 is identified as a support level that aligns with the 161.80% Fibonacci extension level that strengthens its relevance as a pullback support.
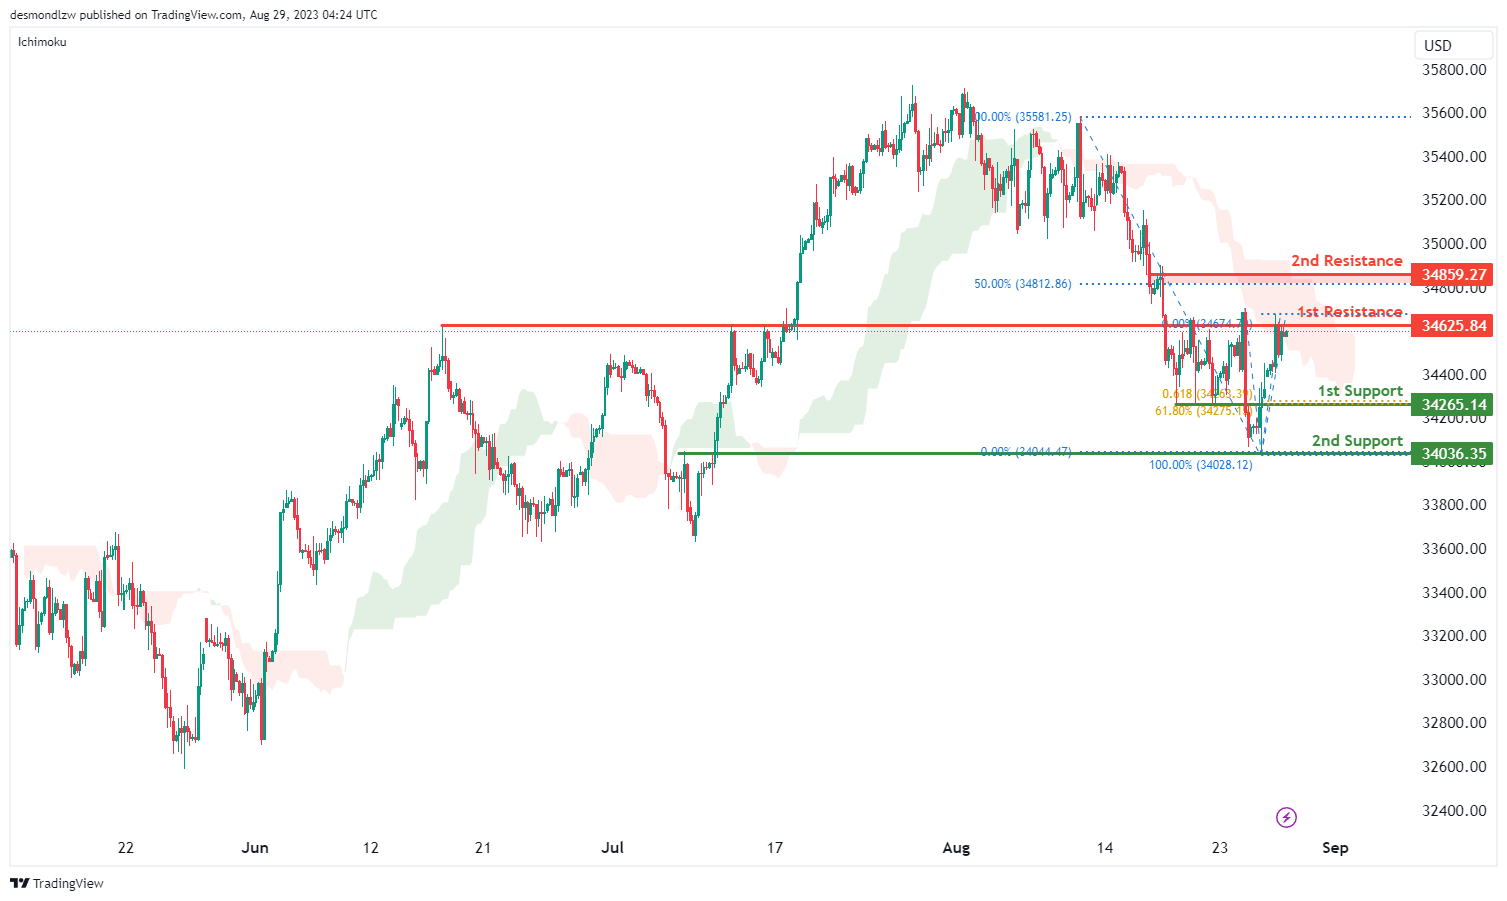
DJ30:
The DJ30 chart currently indicates a bearish overall momentum, with the price being within the bearish Ichimoku cloud. Based on the analysis, there’s potential for a bearish continuation towards the 1st support level.
The 1st support at 34265.14 is noteworthy due to its overlap support features, and it also coincides with both the 61.80% Fibonacci Retracement and the 61.80% Fibonacci Projection, suggesting a Fibonacci confluence.
The 2nd support at 34036.35 is also significant as it represents an overlap support.
On the resistance side, the 1st resistance at 34265.84 is identified as an overlap resistance. The 2nd resistance at 34859.27 is seen as pullback resistance.
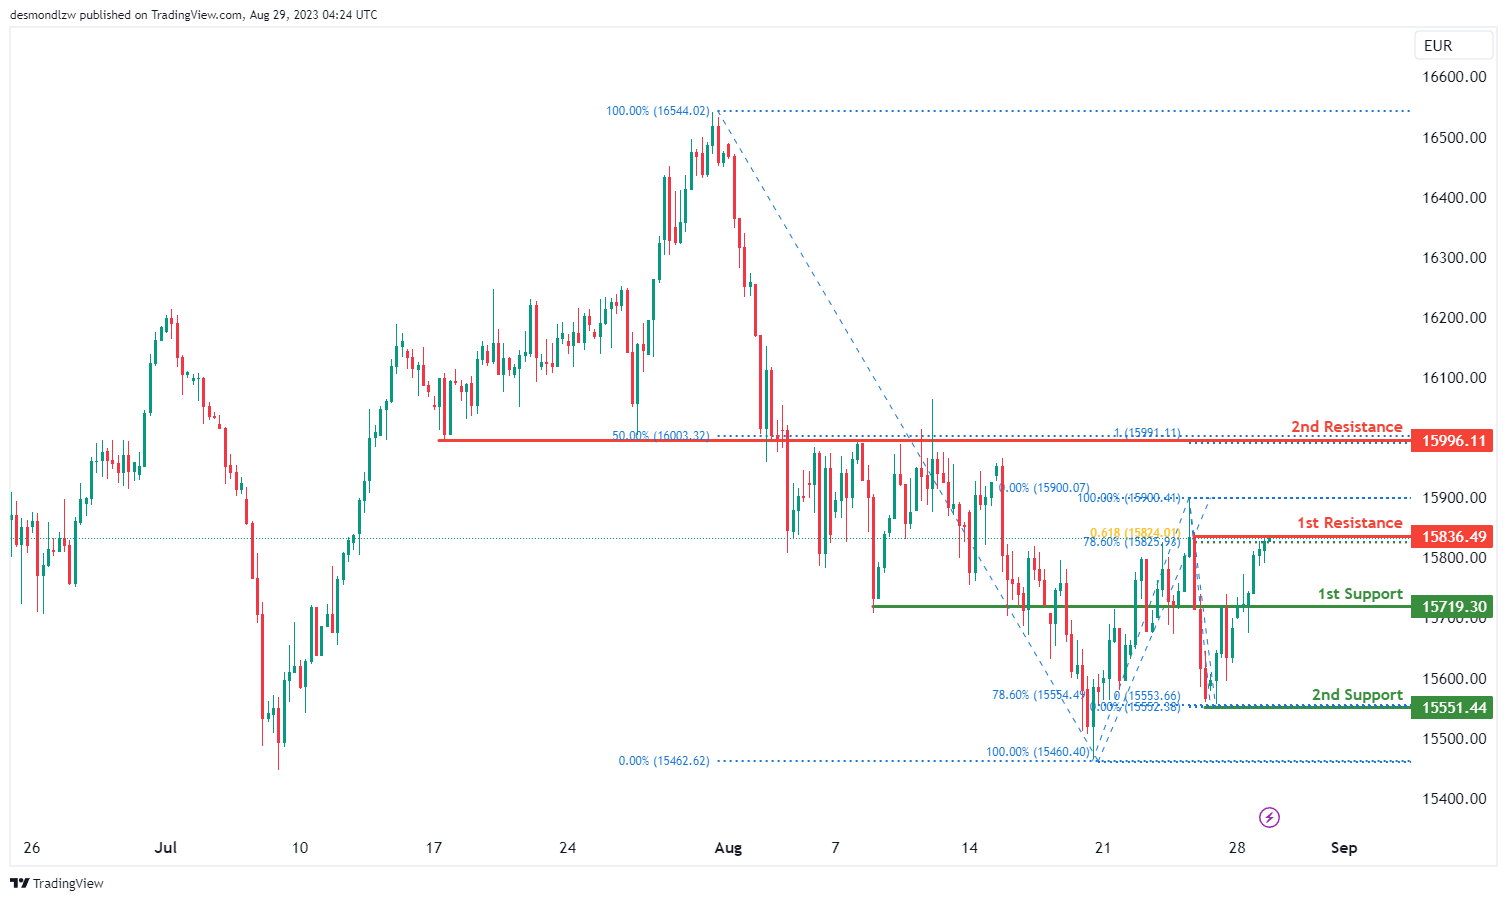
GER30:
The GER30 (Germany 30) chart currently shows a bearish overall momentum. Based on the analysis, there is a possibility for a bearish reaction off the 1st resistance level, leading to a potential drop towards the 1st support level.
The 1st support at 15719.30 is considered advantageous as it represents an overlap support.
The 2nd support at 15551.44 is significant due to its overlap support characteristics and also coincides with the 78.60% Fibonacci Retracement.
On the resistance side, the 1st resistance at 15836.49 is a swing high resistance, and it also coincides with both the 78.60% Fibonacci Retracement and the 61.80% Fibonacci Projection, suggesting a Fibonacci confluence.
The 2nd resistance at 15996.11 is also noteworthy as it represents an overlap resistance and coincides with both the 50% Fibonacci Retracement and the 100% Fibonacci Projection, indicating another Fibonacci confluence.
US500
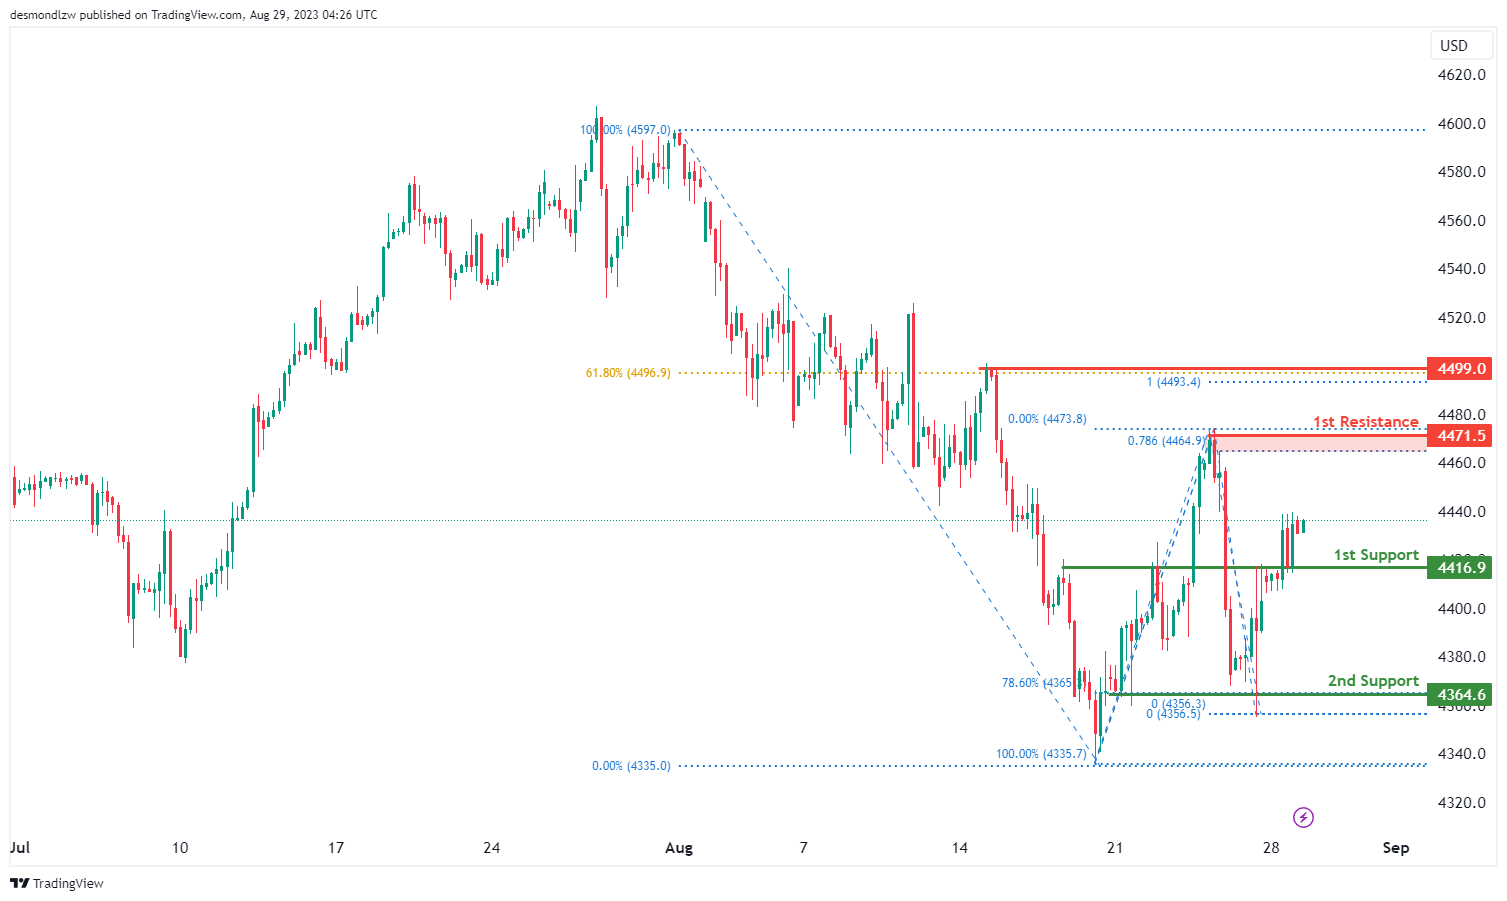
The US500 (U.S. 500) chart indicates a bullish overall momentum. Based on the analysis, there is potential for a bullish continuation towards the 1st resistance level.
The 1st support at 4416.9 is considered an overlap support.
The 2nd support at 4364.6 is significant due to its multi-swing low support characteristics and it also coincides with the 78.60% Fibonacci Retracement.
On the resistance side, the 1st resistance at 4471.5 is a swing high resistance, and it coincides with the 78.60% Fibonacci Projection.
The 2nd resistance at 4499.0 is also noteworthy as it represents a swing high resistance. Moreover, it coincides with both the 61.80% Fibonacci Retracement and the 100% Fibonacci Projection, suggesting a Fibonacci confluence.
BTC/USD:
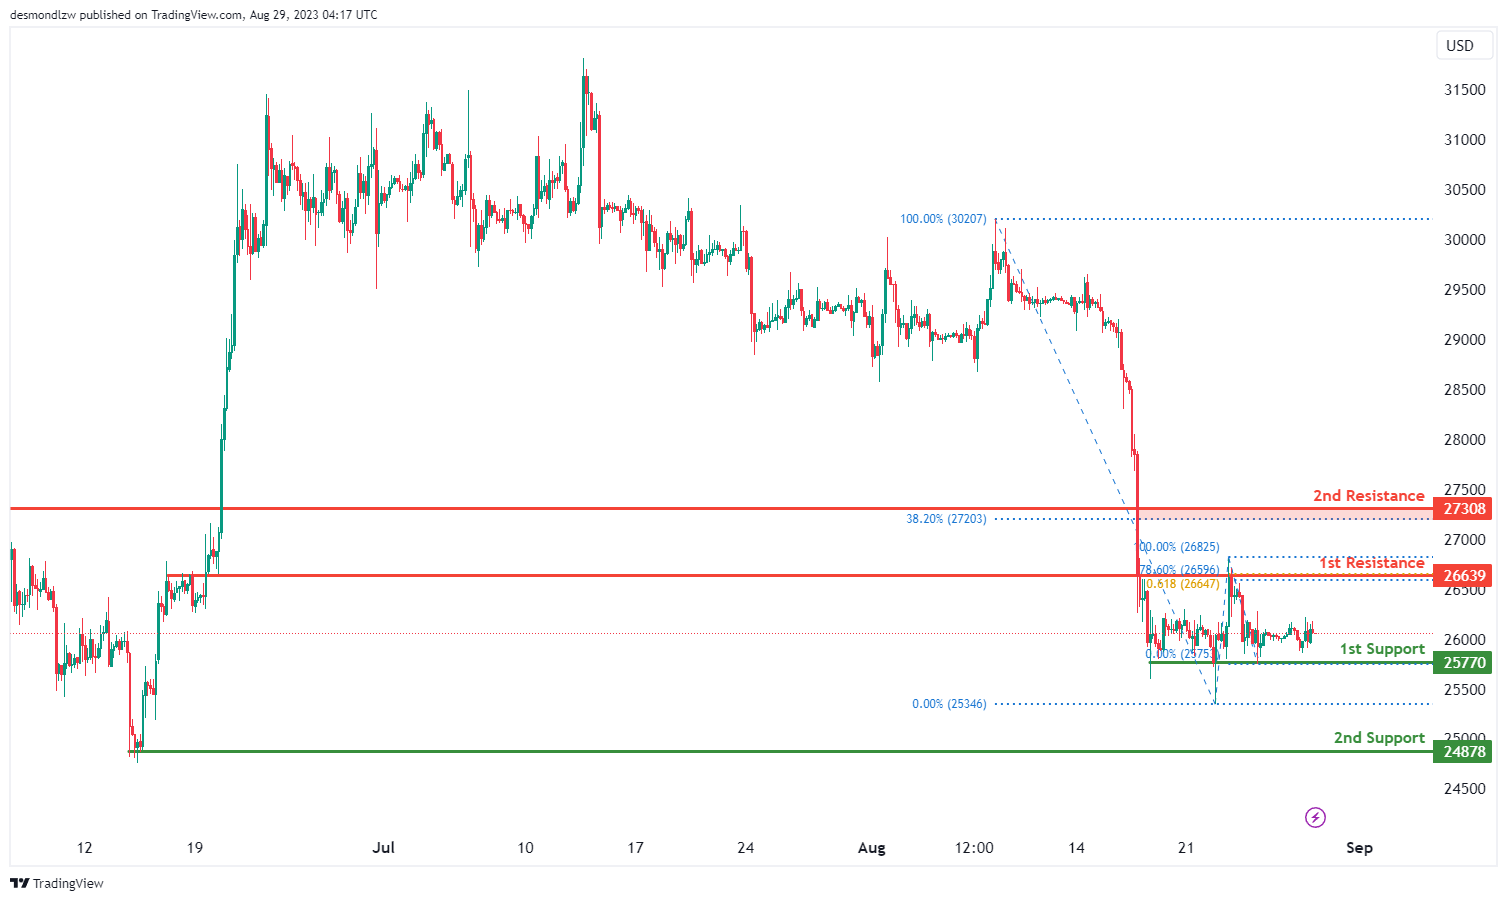
The BTC/USD chart is currently indicating a bullish overall momentum. Based on the analysis, there’s potential for a bullish continuation towards the 1st resistance level.
The 1st support at 25770 holds significance due to its multi-swing low support characteristics.
The 2nd support at 24878 is also notable as it represents a swing low support.
On the resistance side, the 1st resistance at 26639 stands out due to its overlap resistance features, as well as the confluence of the 78.60% Fibonacci Retracement and the 61.80% Fibonacci Projection.
The 2nd resistance at 27308 is significant due to its overlap resistance features and its alignment with the 38.20% Fibonacci Retracement.
ETH/USD:
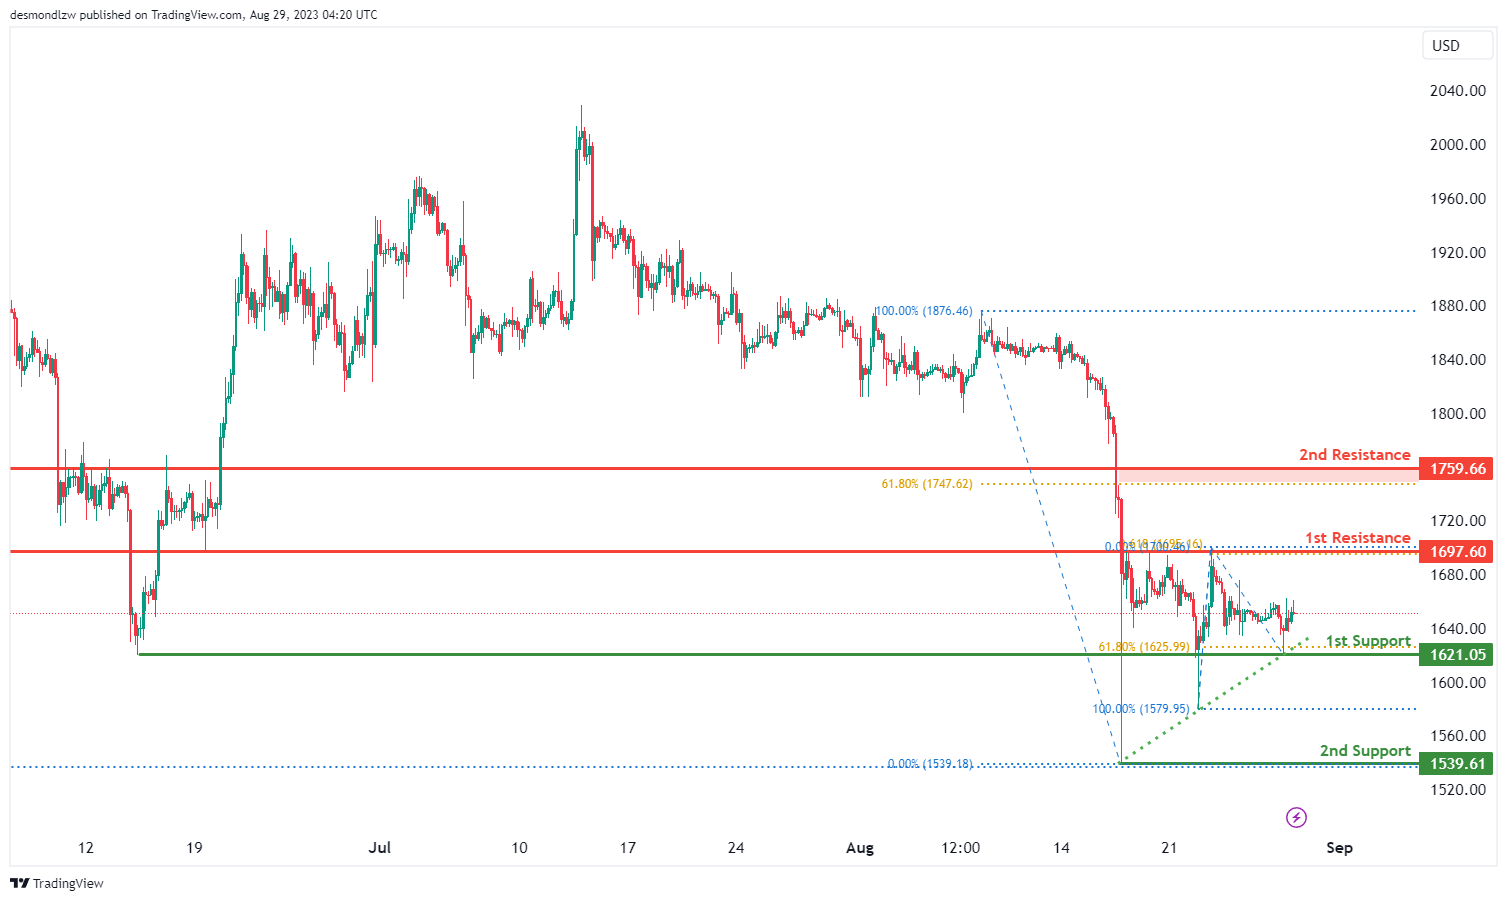
The ETH/USD chart currently displays a bullish overall momentum. Based on the analysis, there’s potential for a bullish continuation towards the 1st resistance level.
The 1st support at 1621.05 is considered significant due to its multi-swing low support characteristics and its alignment with the 61.80% Fibonacci Retracement.
The 2nd support at 1539.61 is also noteworthy as it represents a swing low support.
On the resistance side, the 1st resistance at 1697.60 stands out due to its overlap resistance features and its alignment with the 61.80% Fibonacci Projection.
The 2nd resistance at 1759.66 is significant due to its overlap resistance features and its alignment with the 61.80% Fibonacci Retracement.
WTI/USD:
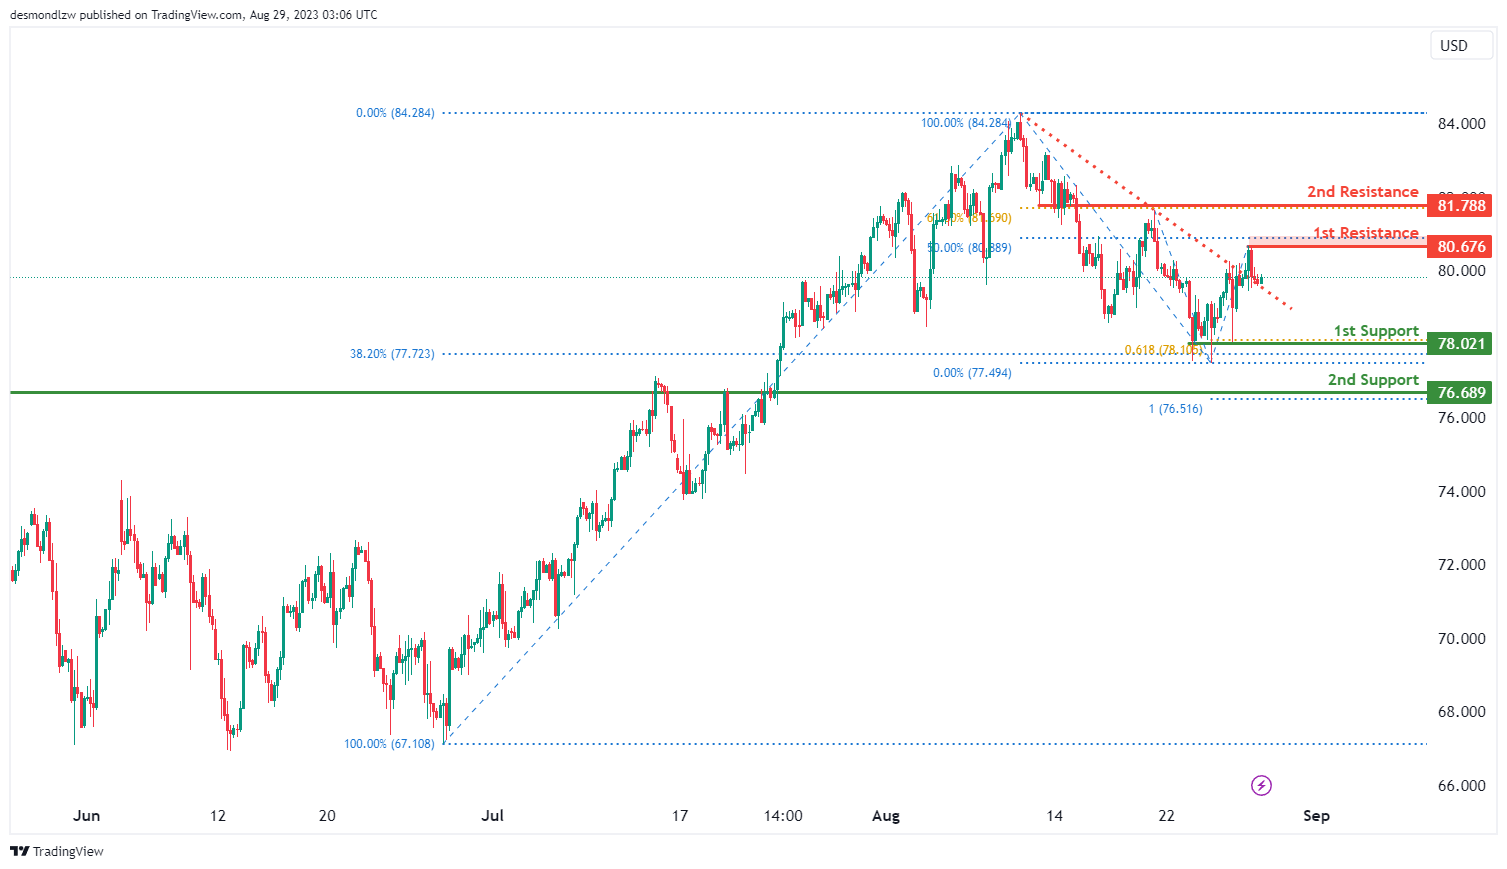
The WTI chart currently exhibits a weak bearish momentum with low confidence, indicating a tentative downward trend in the price movement. There is potential for a bearish continuation towards the 1st support level.
The 1st support level at 78.02 is identified as a multiple swing-low support that aligns with a confluence of Fibonacci levels i.e. the 38.20% retracement and the 61.80% projection levels. In addition, the 2nd support level at 76.69 is identified as an overlap support that coincides with the 100.00% Fibonacci projection level.
To the upside, the 1st resistance at 80.68 is marked as pullback resistance that aligns with the 50.00% Fibonacci retracement level. Furthermore, the 2nd resistance level at 81.79 is identified as an overlap resistance that aligns with the 61.80% Fibonacci retracement level.
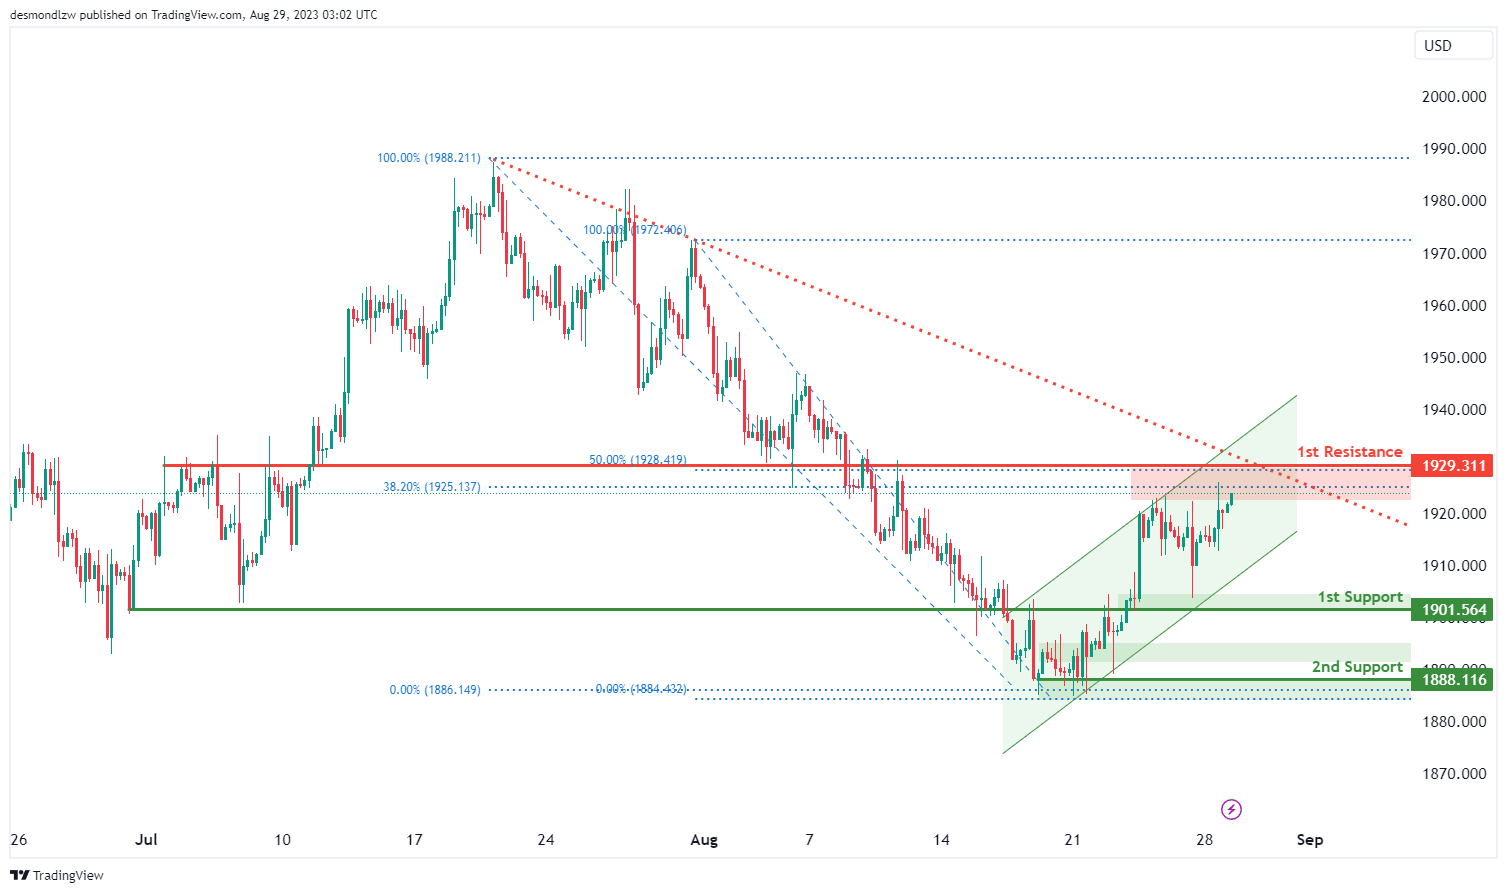
XAU/USD (GOLD):
The XAUUSD chart currently exhibits bearish momentum, with the price positioned below a major descending trend line, indicating the presence of bearish momentum. However, it’s also worth noting that the price is within a bullish ascending channel, which could lead to a potential rise towards the 1st resistance before a potential reversal. There’s a likelihood of a bearish reaction occurring off the 1st resistance level, causing the price to decline towards the 1st support level. Here’s an analysis of these levels:
The 1st support level at 1901.56 holds significance due to its role as an overlap support, pointing to instances in the past where the price found support around this level.
The 2nd support level at 1888.11 is identified as a multi-swing low support, indicating historical price action has found support around this level during multiple instances of swing lows.
On the resistance side, the 1st resistance level at 1929.31 is noteworthy for being an overlap resistance. Additionally, this level aligns with both the 50% Fibonacci Retracement and the 38.20% Fibonacci Retracement, indicating a Fibonacci confluence.


