
- The recent three weeks of -13.90% decline has reached a key medium-term support level of 17,530.
- The latest reading of its daily MACD trend indicator has indicated a possible pause in the medium-term downtrend movement.
- Key short-term support to watch will be at 17,970 with intermediate resistances at 18,600 and 18,910.
The Hang Seng Index is set to record its worst monthly performance since October 2022 as it recorded a month-to-date loss of -9.70% as of yesterday, 28 August 2023, on the track to be one of the worst-performing major benchmark stock indices in August.
The current medium-term bearish onslaught has been primarily attributed to a heightened deflationary risk spiral in China and contagion risk from indebted property developers coupled with a lack of material stimulus measures to negate these negative repercussions.
In the lens of technical analysis, price actions of liquid tradable financial assets do not move in a vertical movement where there are certain periods of time, consolidation or countertrend movements can occur within a longer period of trending phases as market participants infer and digest new information.
Interestingly, the current price actions of the Hong Kong 33 Index (a proxy of the Hang Seng Index futures) are suggesting a potential countertrend movement may be taking shape within a medium-term downtrend phase that is still intact since the 27 January 2023 high of 22,688.
Price actions tested key medium-term support with positive elements
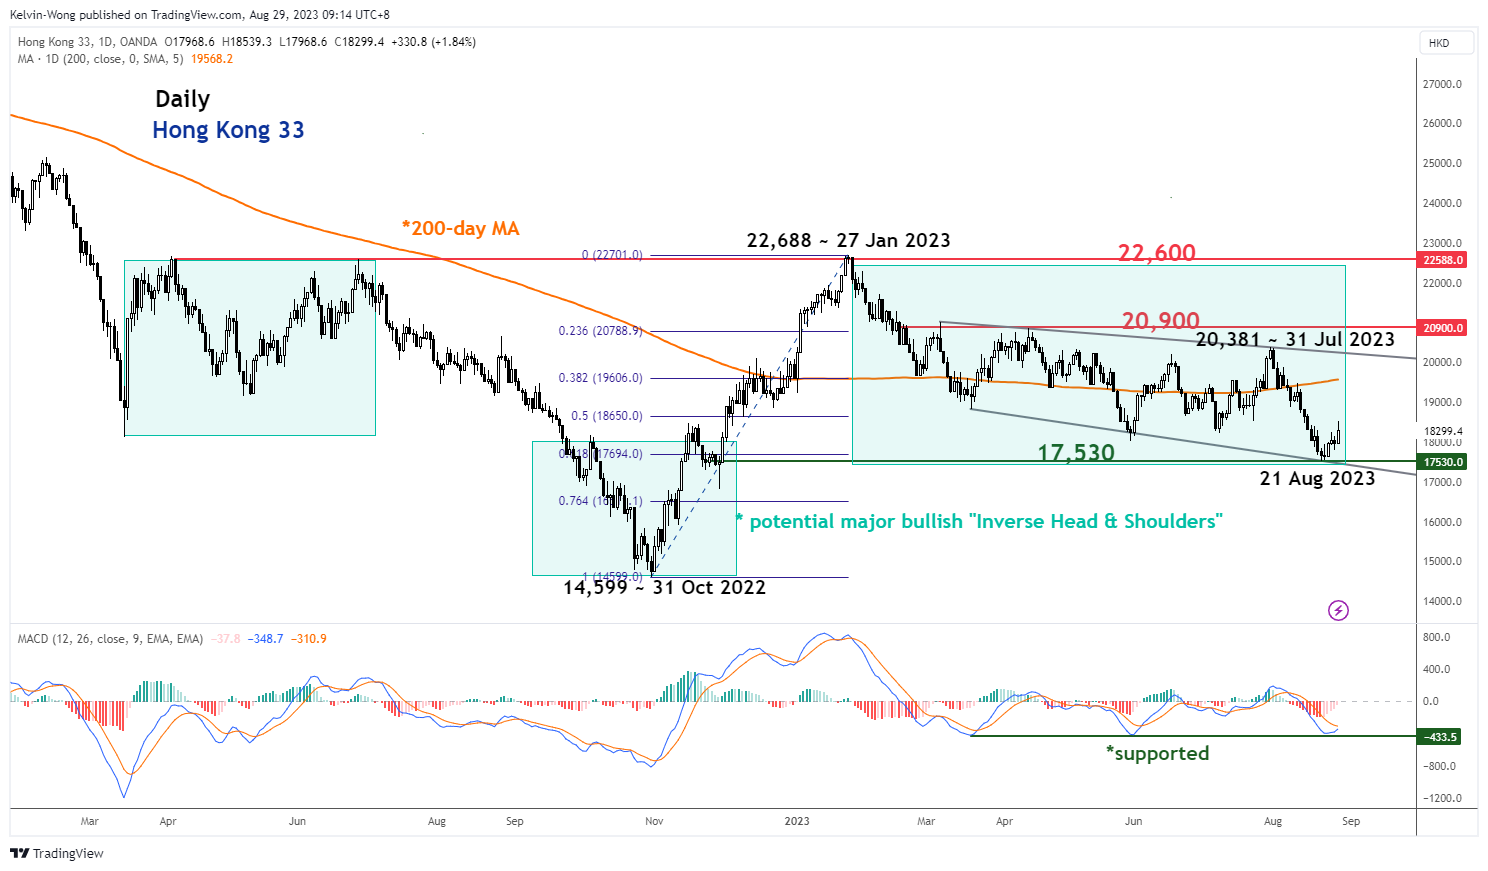
Fig 1: Hong Kong 33 medium-term trend as of 29 Aug 2023 (Source: TradingView, click to enlarge chart)
The recent three weeks of -13.90% decline seen in the Hong Kong 33 Index from its 31 July high of 20,381 has managed to stall and rebounded from a key medium-term support of 17,530 that is being confluence by several different elements; the 28 November 2022 swing low, lower boundary of the “Expanding Wedge” configuration, 76.4% Fibonacci retracement of the prior medium-term up move from 31 October 2022 to 27 January 2023 high.
In addition, the daily MACD trend indicator has managed to stall at parallel horizontal support (bullish divergence) while price actions traced out “lower lows” over a similar period. These observations suggest a possible slowdown in medium-term downside momentum which in turn increases the odds of a countertrend rebound scenario.
Watch the 17,970 key short-term support
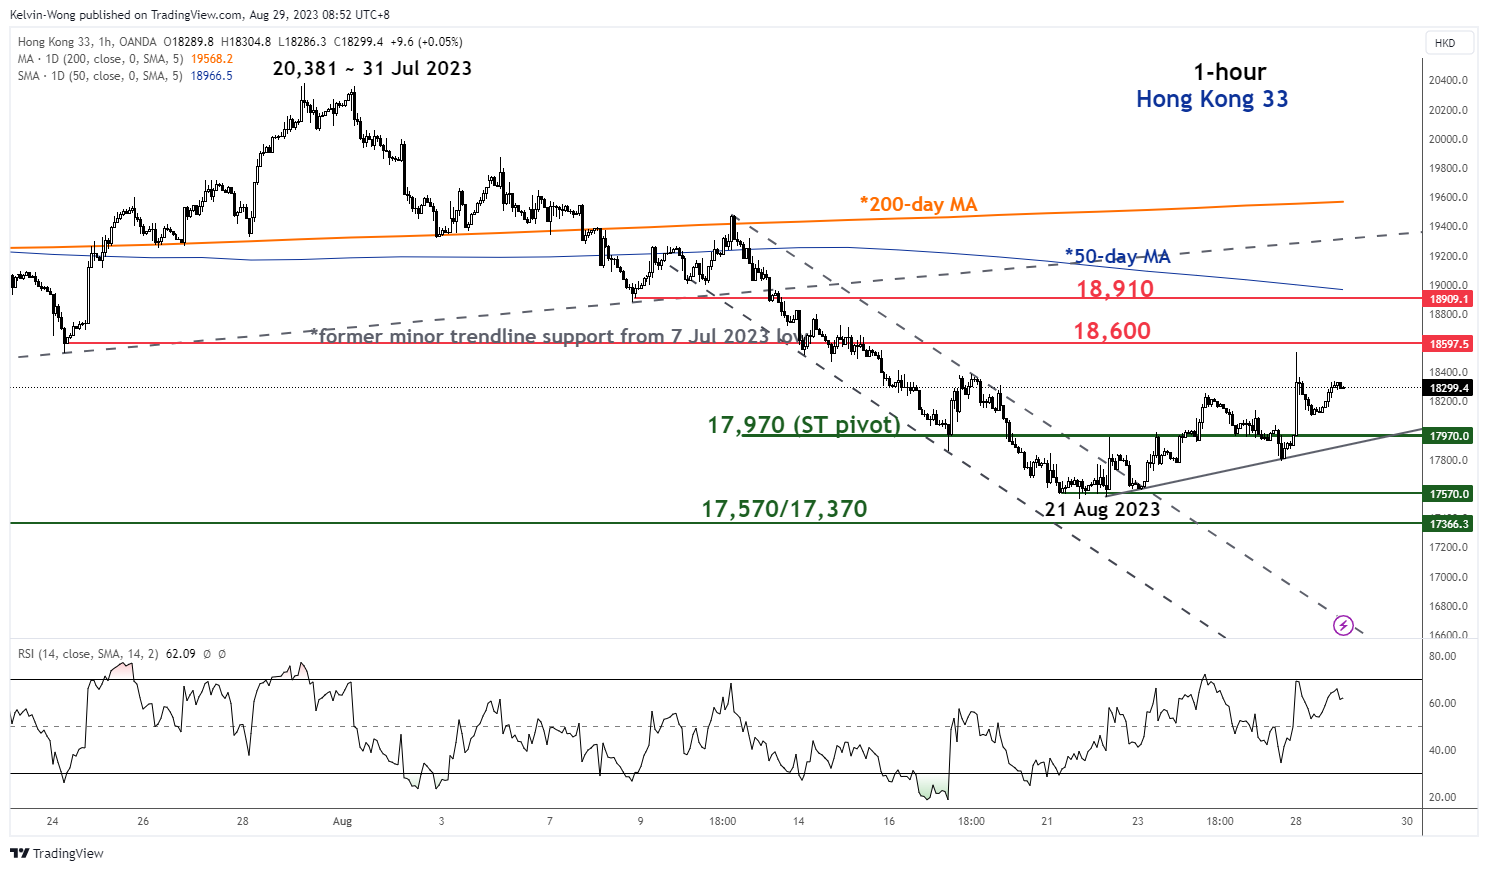
Fig 2: Hong Kong 33 minor short-term trend as of 29 Aug 2023 (Source: TradingView, click to enlarge chart)
The Index has staged a minor rebound of +5.65% from its 21 August 2023 low to print an intraday high of 18,539 yesterday, 28 August on the backdrop of a positive new measure to boost short-term investors’ sentiment in the China stock market where policymakers enacted a 50% reduction to stock trading levy, its first cut since 2008 Great Financial Crisis.
If the 17,970 short-term pivotal support manages to hold ground, the Index may see a further bounce within its ongoing minor countertrend rebound phase towards the next intermediate resistances at 18,600 and 18,910 (also the 50-day moving average).
On the flip side, a break below 17,970 invalidates the countertrend rebound scenario to expose the next immediate support at 17,570/17,370.


