
DXY:
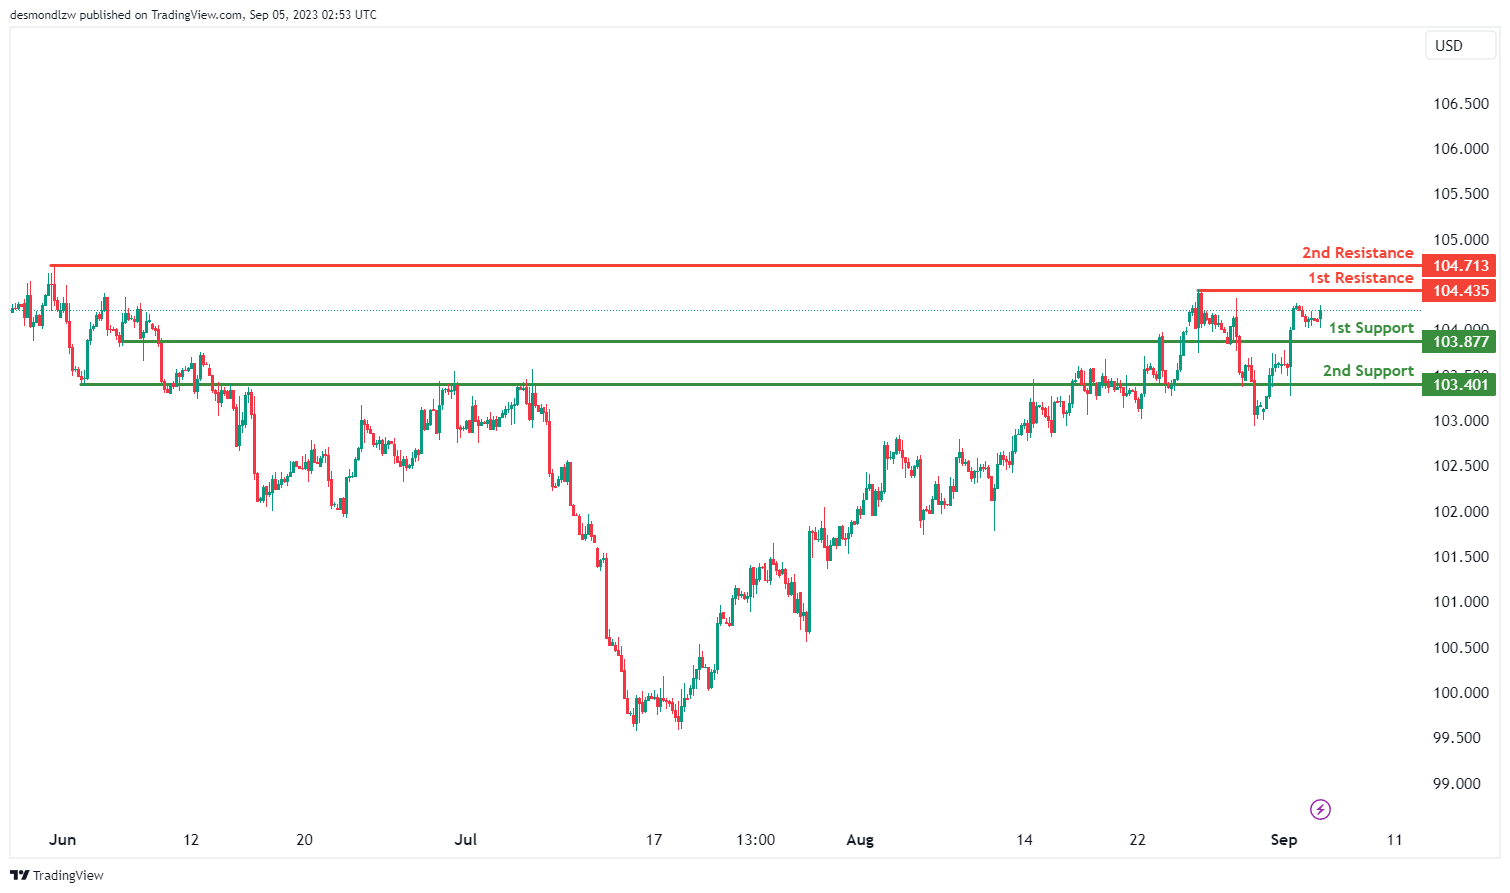
The DXY chart exhibits a bullish momentum, indicating an upward trend in price movement. This sentiment is supported by the price’s position within a bullish ascending channel, suggesting the potential for further upward momentum.
There’s a potential scenario for a bullish continuation towards the 1st resistance level. The 1st support at 103.40 holds significance as a pullback support, indicating that historical price action has found support around this level during pullbacks.
The 2nd support at 103.40 is identified as an overlap support, reinforcing the notion of historical support around this area. This adds to the potential strength of this support level.
In terms of resistance, the 1st resistance at 104.43 gains importance due to its alignment with a swing high resistance level. This suggests that historical price action has faced resistance around this level.
Additionally, the 2nd resistance at 104.71 is marked as a swing high resistance, further emphasizing its potential significance as a level where price might encounter resistance.
EUR/USD:
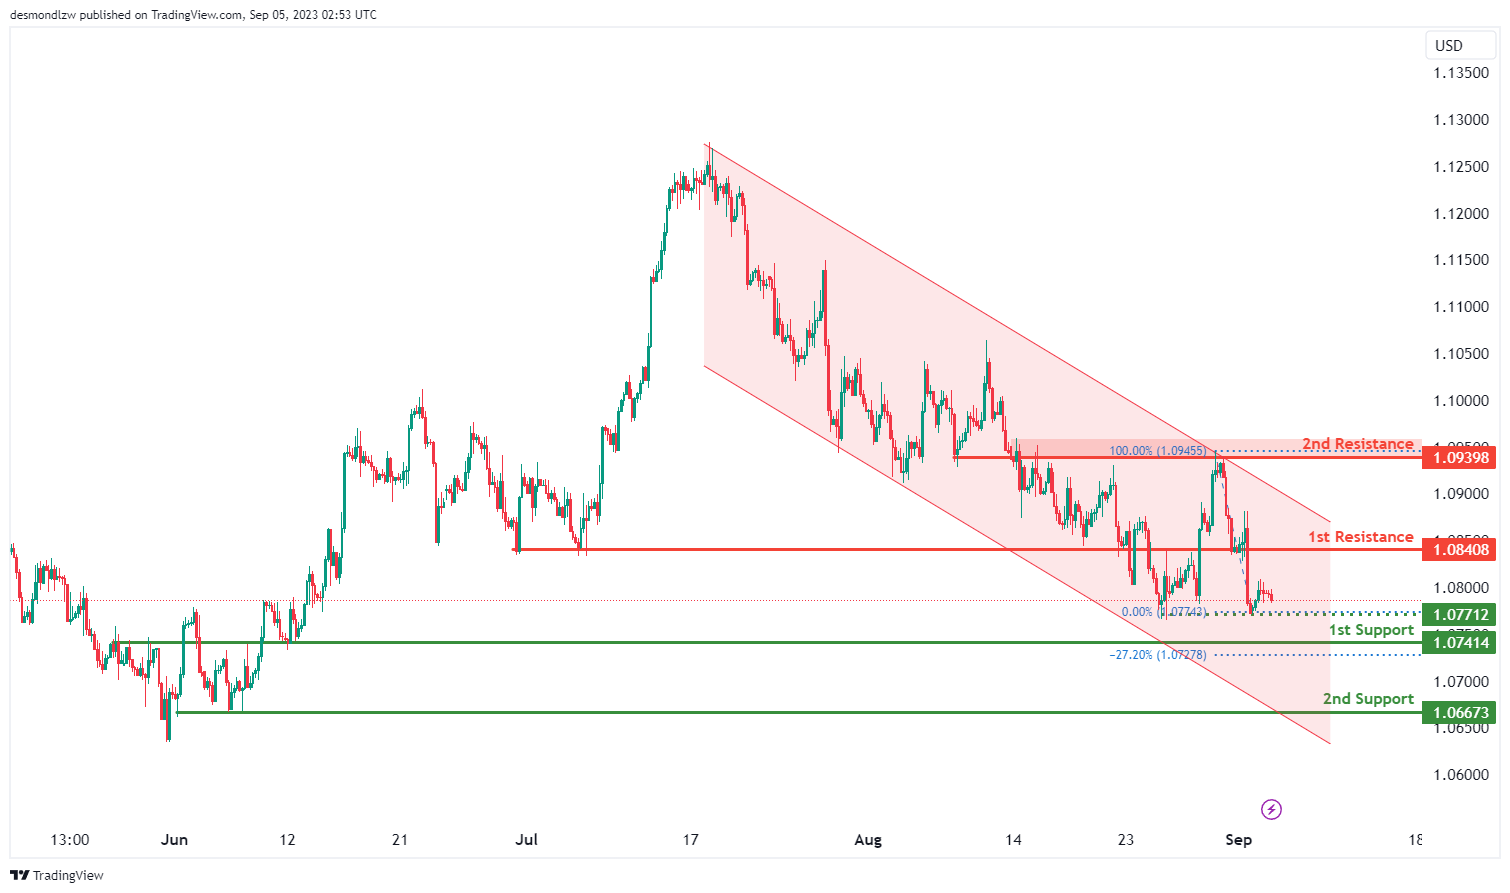
The EUR/USD chart reflects a bearish momentum, indicating a downward trend in price movement. This sentiment is supported by the price’s position within a bearish descending channel, suggesting the potential for further downward momentum.
There’s a potential scenario for a bearish continuation towards the 1st support level. The 1st support at 1.0741 is identified as an overlap support and aligns with the -27% Fibonacci Expansion level. This confluence of support factors strengthens its potential as a key support zone.
The 2nd support at 1.0667 is noted as a multi-swing low support, highlighting historical instances of the price finding support around this level. This adds to the significance of this support level.
On the resistance side, the 1st resistance at 1.0840 is marked as pullback resistance, indicating that historical price action has faced resistance around this level during pullbacks.
Additionally, the 2nd resistance at 1.0939 is identified as an overlap resistance, further reinforcing its potential significance as a level where price might encounter resistance.
An intermediate support level at 1.0771 is recognized as a multi-swing low support, adding to its importance as a potential area where price could find support during pullbacks.
EUR/JPY:
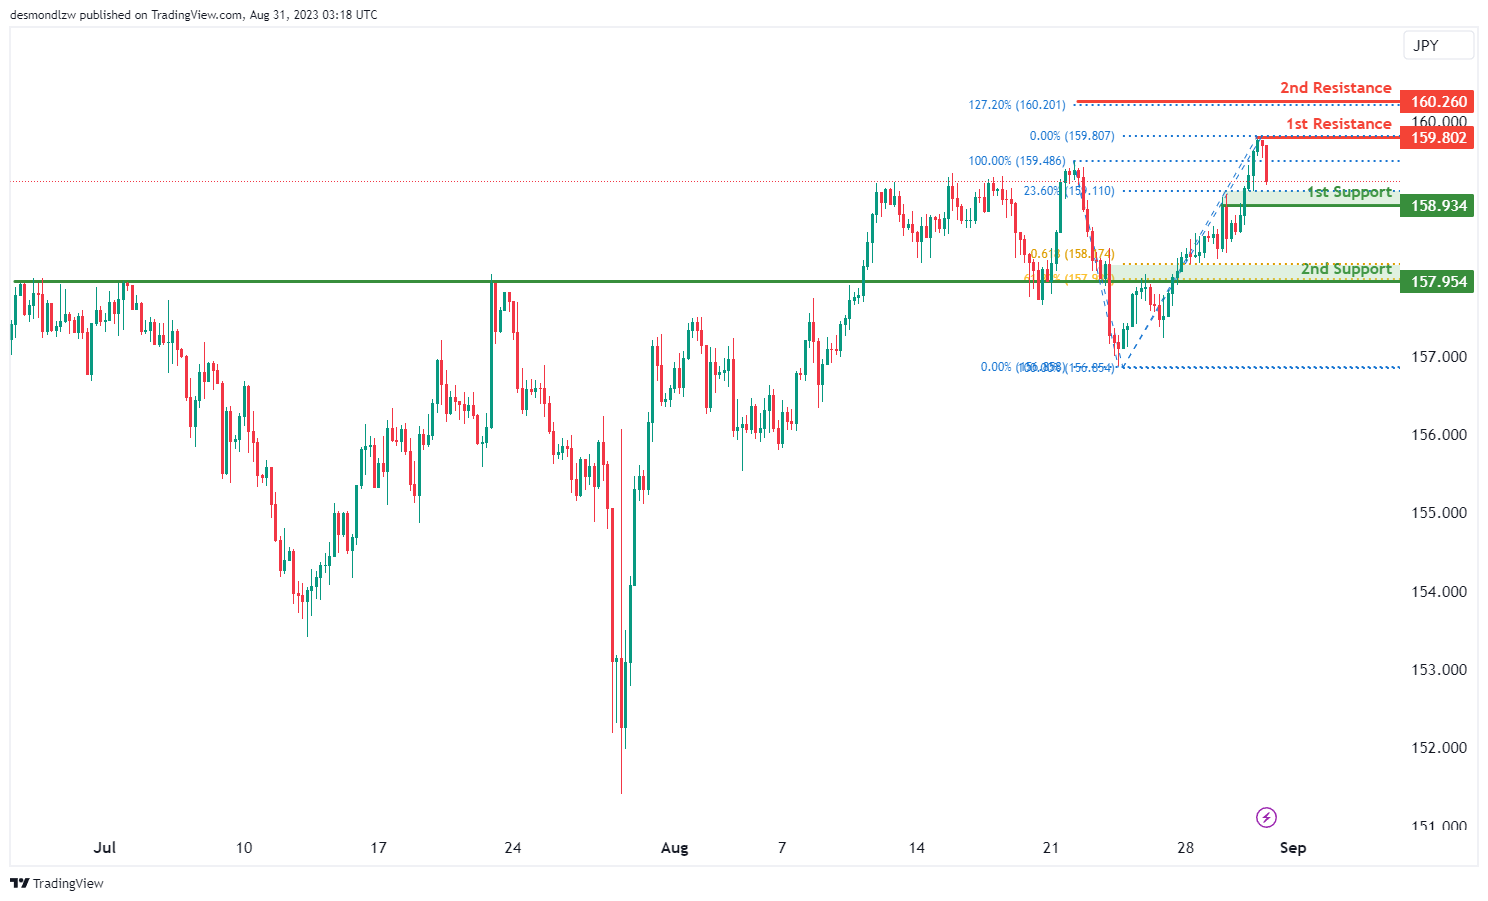
The instrument EUR/JPY currently demonstrates a bearish overall momentum on the chart.
There is a potential scenario where the price could have a bearish reaction off the 1st resistance level at 158.47 and drop towards the 1st support level at 157.06.
The 1st support level at 157.06 is considered strong as it represents multi-swing low support.
On the resistance side, the 1st resistance at 158.47 is significant because it serves as a pullback resistance and aligns with a 50% Fibonacci Retracement.
Furthermore, the 2nd resistance level at 159.22 is considered significant as it represents overlap resistance and aligns with both a 78.60% Fibonacci Retracement and a 78.60% Fibonacci Projection, indicating Fibonacci confluence.
EUR/GBP:
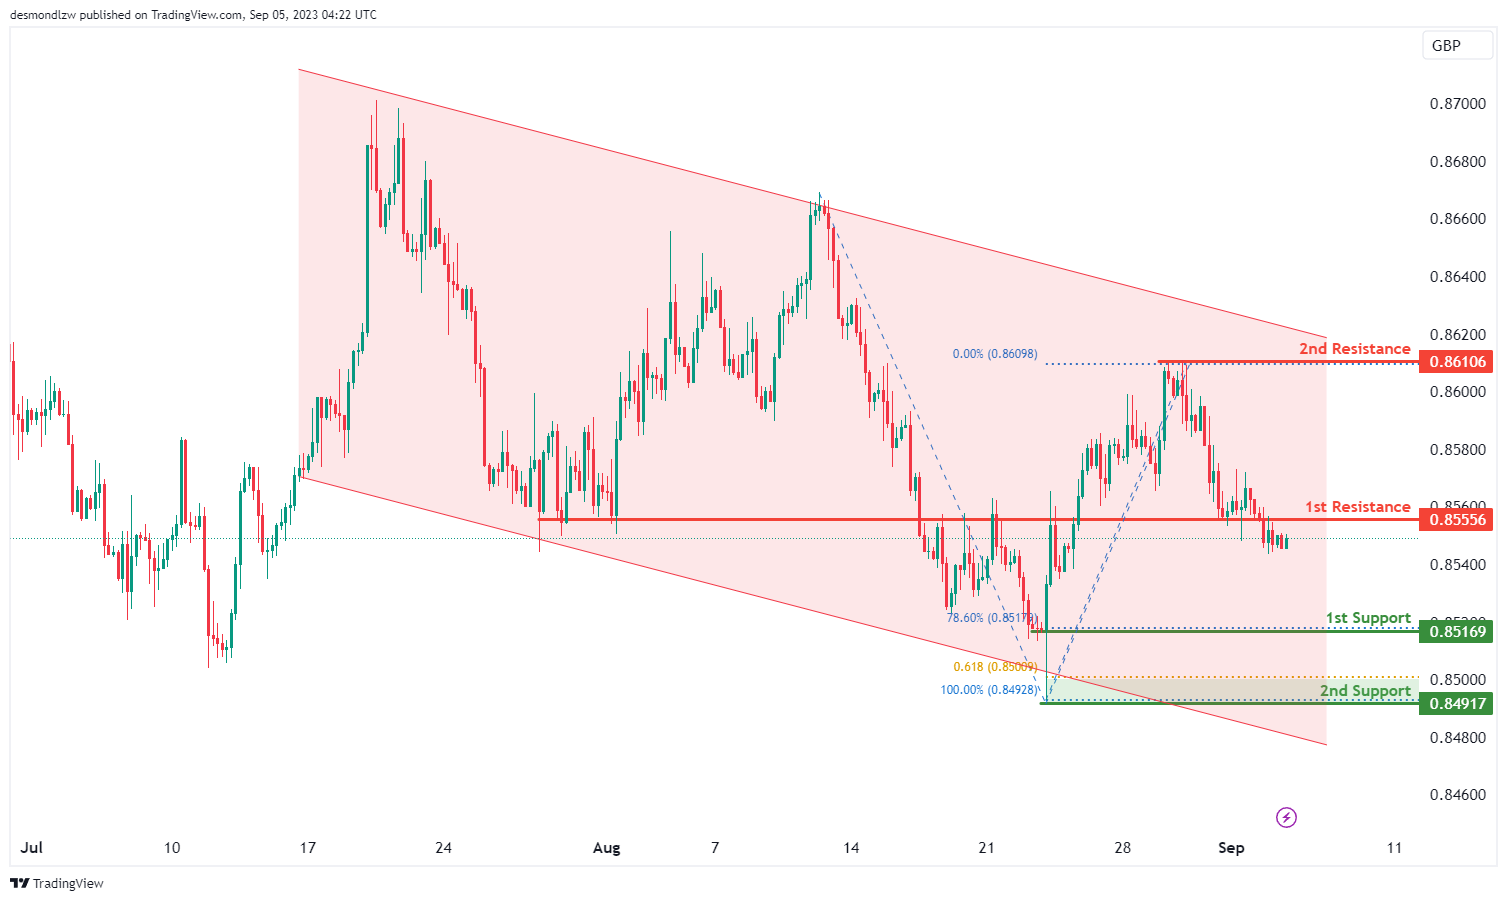
The instrument EUR/GBP currently exhibits a bearish overall momentum on the chart, characterized by the presence of a bearish descending channel.
In this context, there is a potential scenario where the price could experience a bearish reaction off the 1st resistance level at 0.8555 and subsequently drop towards the 1st support level at 0.8516.
The 1st support level at 0.8516 is considered strong because it represents swing low support and aligns with a 78.60% Fibonacci Retracement.
Additionally, there is a 2nd support level at 0.8491, which is significant as it represents swing low support and aligns with a 61.80% Fibonacci Projection.
On the resistance side, the 1st resistance at 0.8555 is noteworthy as it serves as overlap resistance, indicating potential selling pressure in this area.
Furthermore, the 2nd resistance level at 0.8610 is considered significant as it represents swing high resistance.
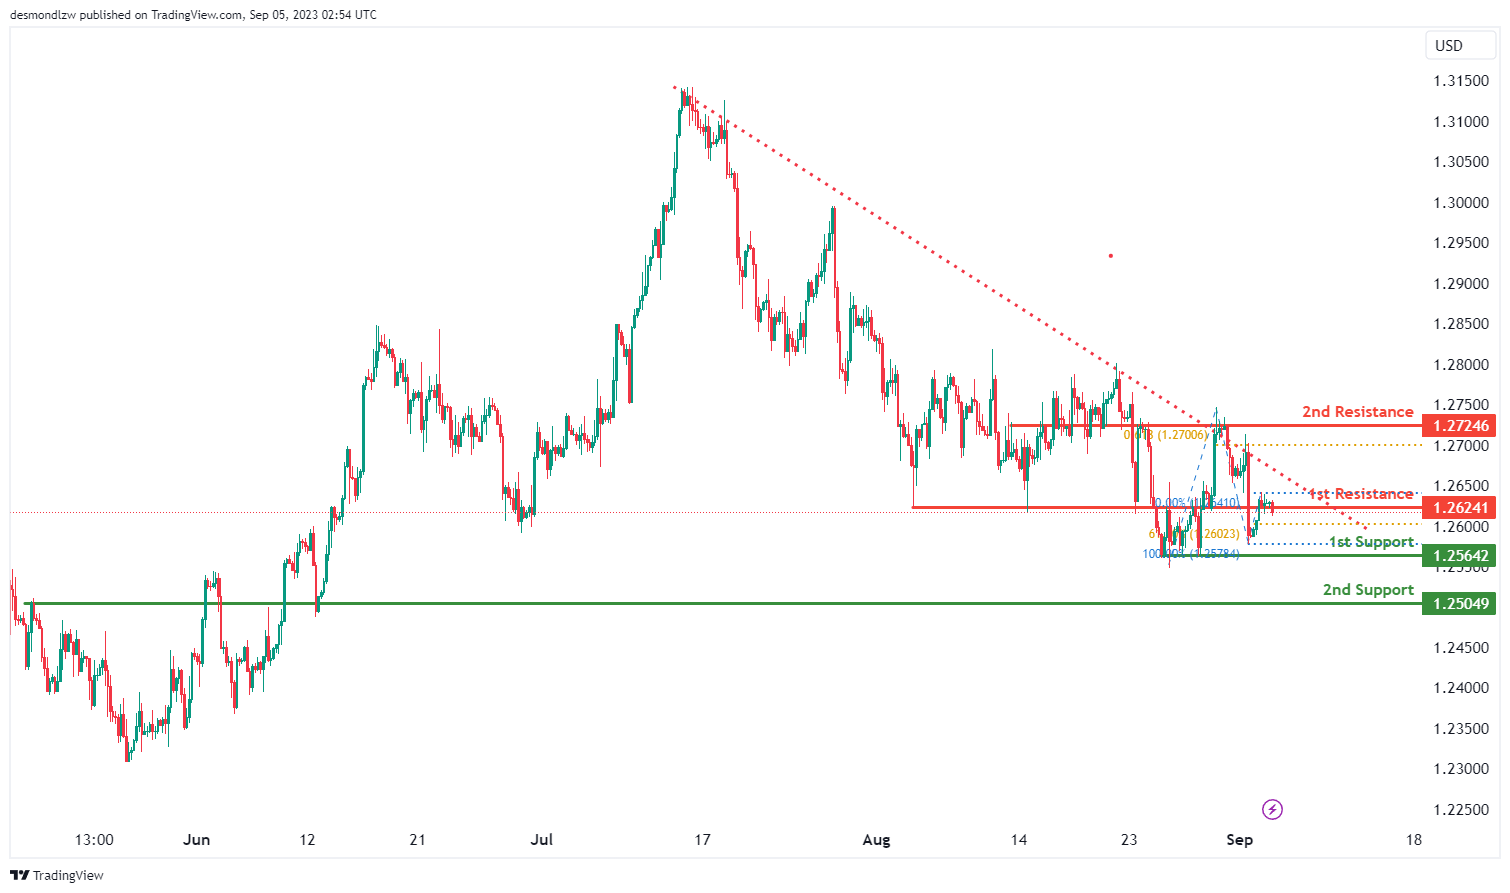
GBP/USD:
The GBP/USD chart indicates a bearish momentum, signaling a downward trend in price movement. This sentiment is reinforced by the price’s position below a significant descending trend line, hinting at the potential for continued bearish momentum.
A potential scenario involves a bearish reaction at the 1st resistance level, potentially leading to a drop towards the 1st support.
The 1st support at 1.2564 is identified as a multi-swing low support, indicating historical instances of price finding support around this level. This adds to its importance as a potential support zone.
Another 1st support at 1.2504 is noted as an overlap support, suggesting that historical price action has found support in this area.
Looking at resistance levels, the 1st resistance at 1.2624 is marked as an overlap resistance, indicating historical instances of price encountering resistance at this level.
Furthermore, the 2nd resistance at 1.2724 is also identified as an overlap resistance, with the added significance of aligning with the 61.80% Fibonacci Projection level, enhancing its potential as a resistance zone.
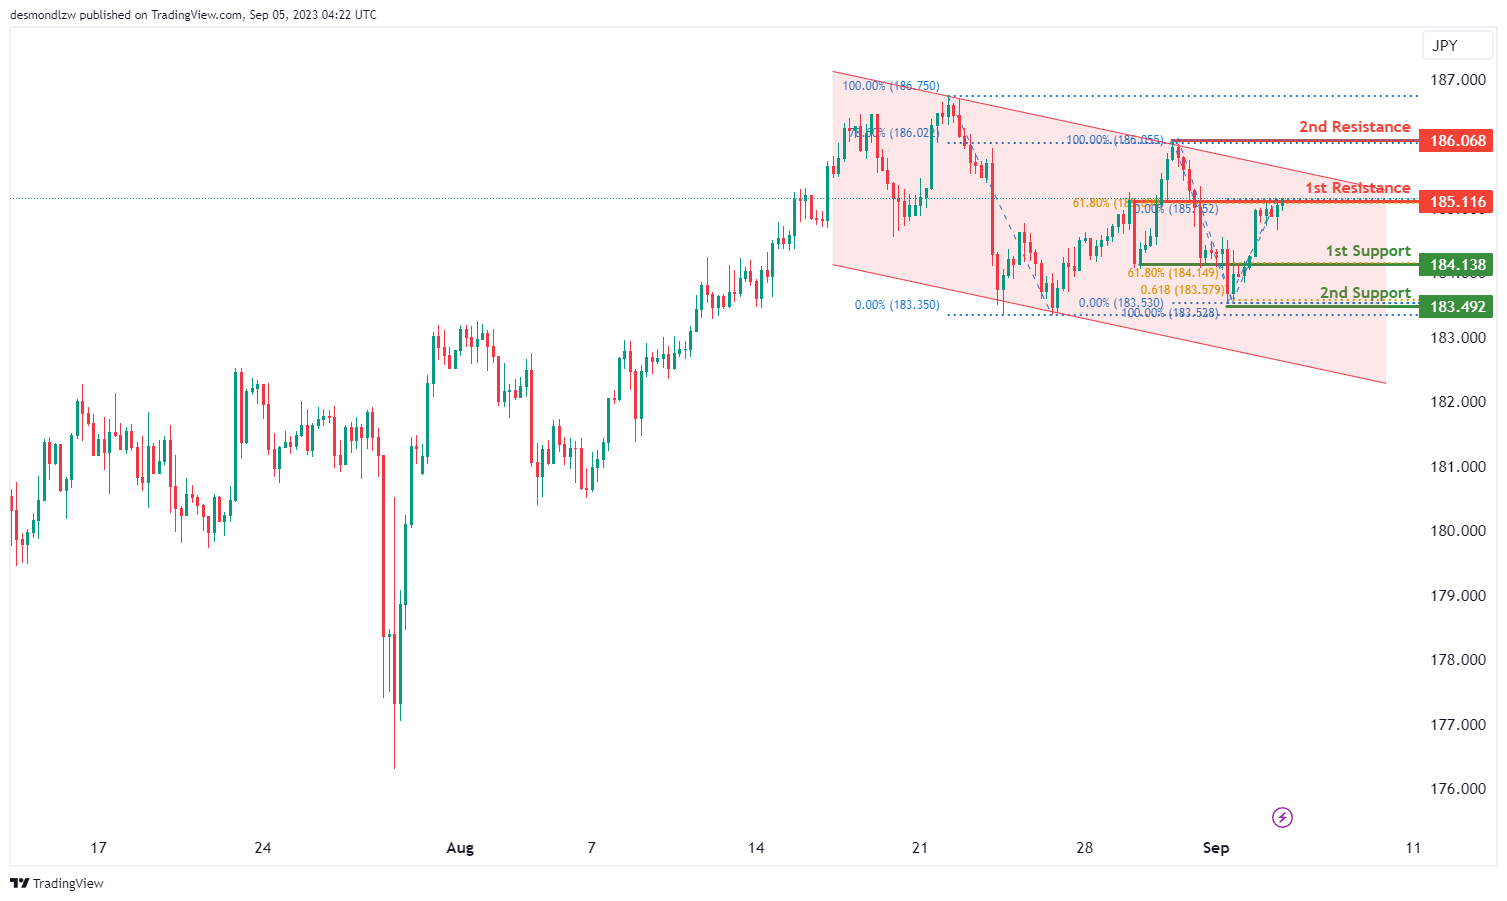
GBP/JPY:
The instrument GBP/JPY currently demonstrates a bearish overall momentum on the chart, characterized by the presence of a bearish descending channel.
In this context, there is a potential scenario where the price could have a bearish reaction off the 1st resistance level at 185.11 and subsequently drop towards the 1st support level at 184.13.
The 1st support level at 184.13 is considered strong because it represents overlap support and aligns with a 61.80% Fibonacci Retracement.
Additionally, there is a 2nd support level at 183.49, which is significant as it represents swing low support and aligns with a 61.80% Fibonacci Projection.
On the resistance side, the 1st resistance at 185.11 is noteworthy because it serves as multi-swing high resistance and aligns with a 61.80% Fibonacci Retracement.
Furthermore, the 2nd resistance level at 186.06 is considered significant as it represents swing high resistance and aligns with a 78.60% Fibonacci Retracement.
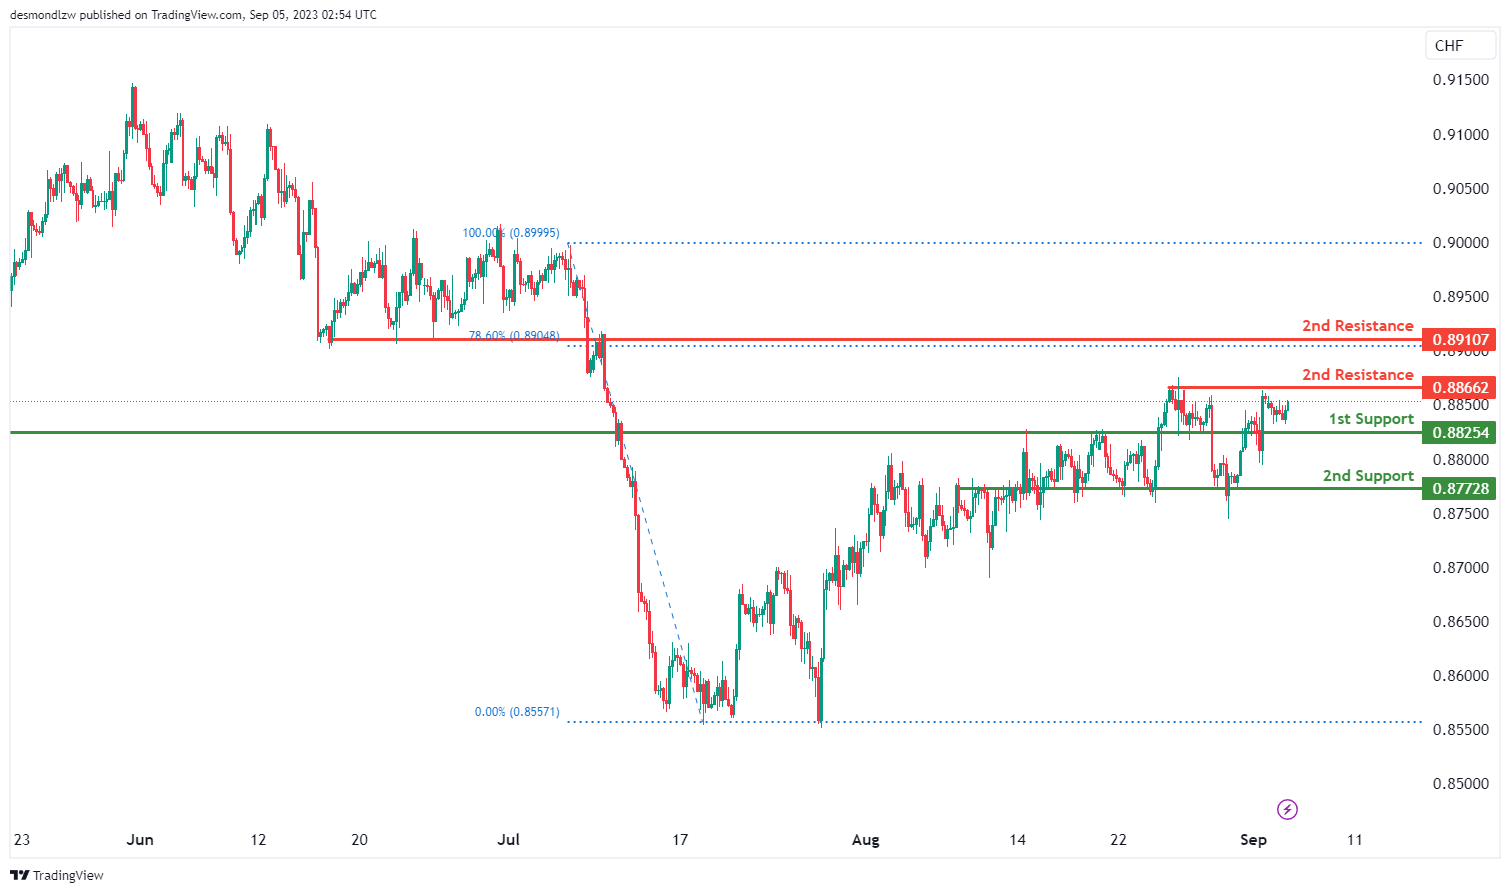
USD/CHF:
The USD/CHF chart indicates a neutral overall momentum, suggesting a lack of clear directional bias in the price movement.
There’s a potential scenario where the price fluctuates between the 1st resistance and 1st support levels.
The 1st support at 0.8825 is identified as an overlap support, indicating historical instances of the price finding support around this level.
Similarly, the 2nd support at 0.8772 is noted as an overlap support, suggesting that this level has served as a supportive region in the past.
On the resistance side, the 1st resistance at 0.8866 is highlighted as a multi-swing high resistance, indicating historical instances of price encountering resistance in this area.
Additionally, the 2nd resistance at 0.8910 is recognized as an overlap resistance, further reinforcing the potential significance of this level.
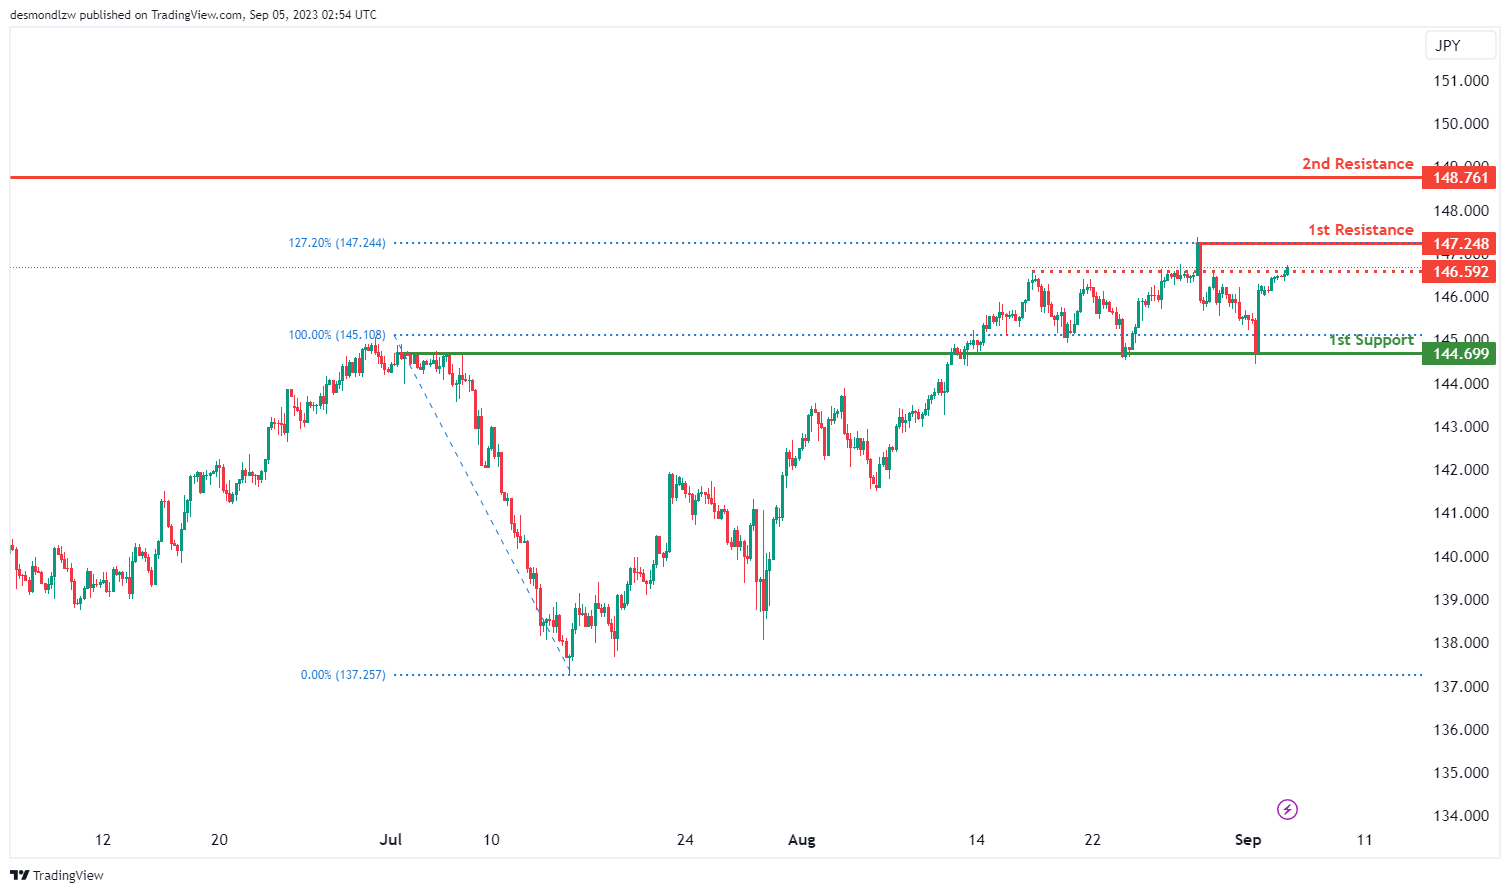
USD/JPY:
Instrument: USD/JPY
Overall momentum of the chart: Bullish
The USD/JPY chart indicates a bullish overall momentum, suggesting a tendency towards upward price movement.
There’s potential for a bullish continuation towards the 1st resistance level.
The 1st support at 144.69 is recognized as an overlap support, reflecting historical instances of the price finding support around this level.
Looking at resistance levels, the 1st resistance at 147.24 gains significance due to its alignment with the 127.20% Fibonacci Extension, suggesting a potential point of resistance.
The 2nd resistance at 148.76 is also identified as a swing high resistance, indicating historical price action encountering resistance in this region.
Additionally, an intermediate resistance at 146.59 is noted as a pullback resistance, potentially serving as a temporary obstacle to a bullish movement.
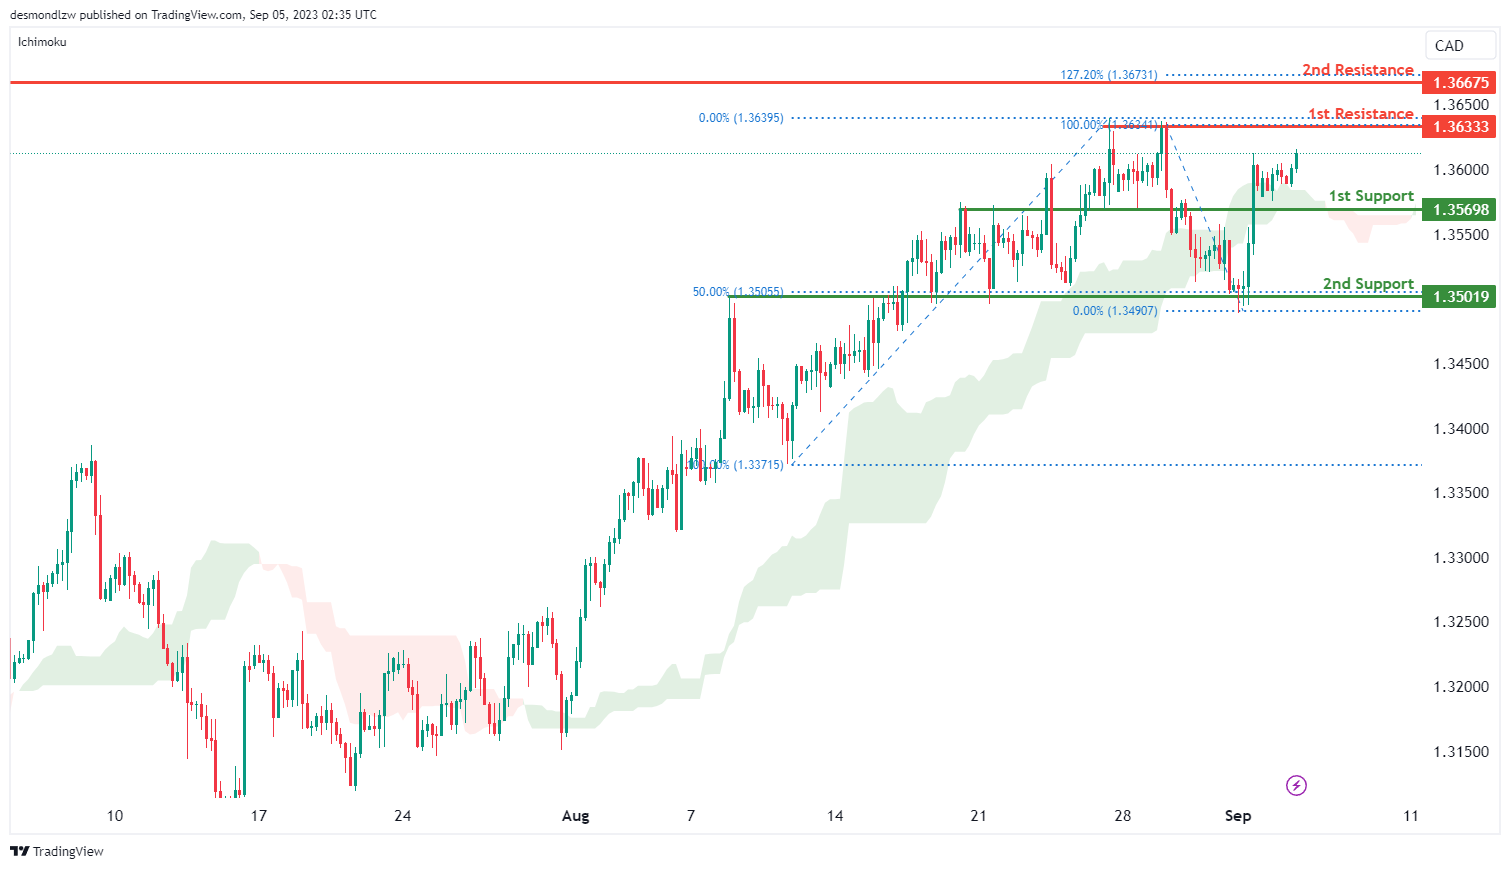
USD/CAD:
The USD/CAD chart is currently displaying an overall bullish momentum, which suggests an upward trend in its price movement. This positive momentum is attributed to price bouncing off the bullish Ichimoku cloud, indicating favourable conditions for further bullish movement towards the 1st resistance level.
The 1st resistance level at 1.3633 is identified as a multiple swing-high resistance. In addition, the 2nd resistance level at 1.3668 is identified as a swing-high resistance that aligns with the 127.20% Fibonacci extension level.
To the downside, the 1st support level at 1.3569 is identified as an overlap support. Similarly, the 2nd support level at 1.3502 is also identified as an overlap support that aligns with the 50.00% Fibonacci retracement level.
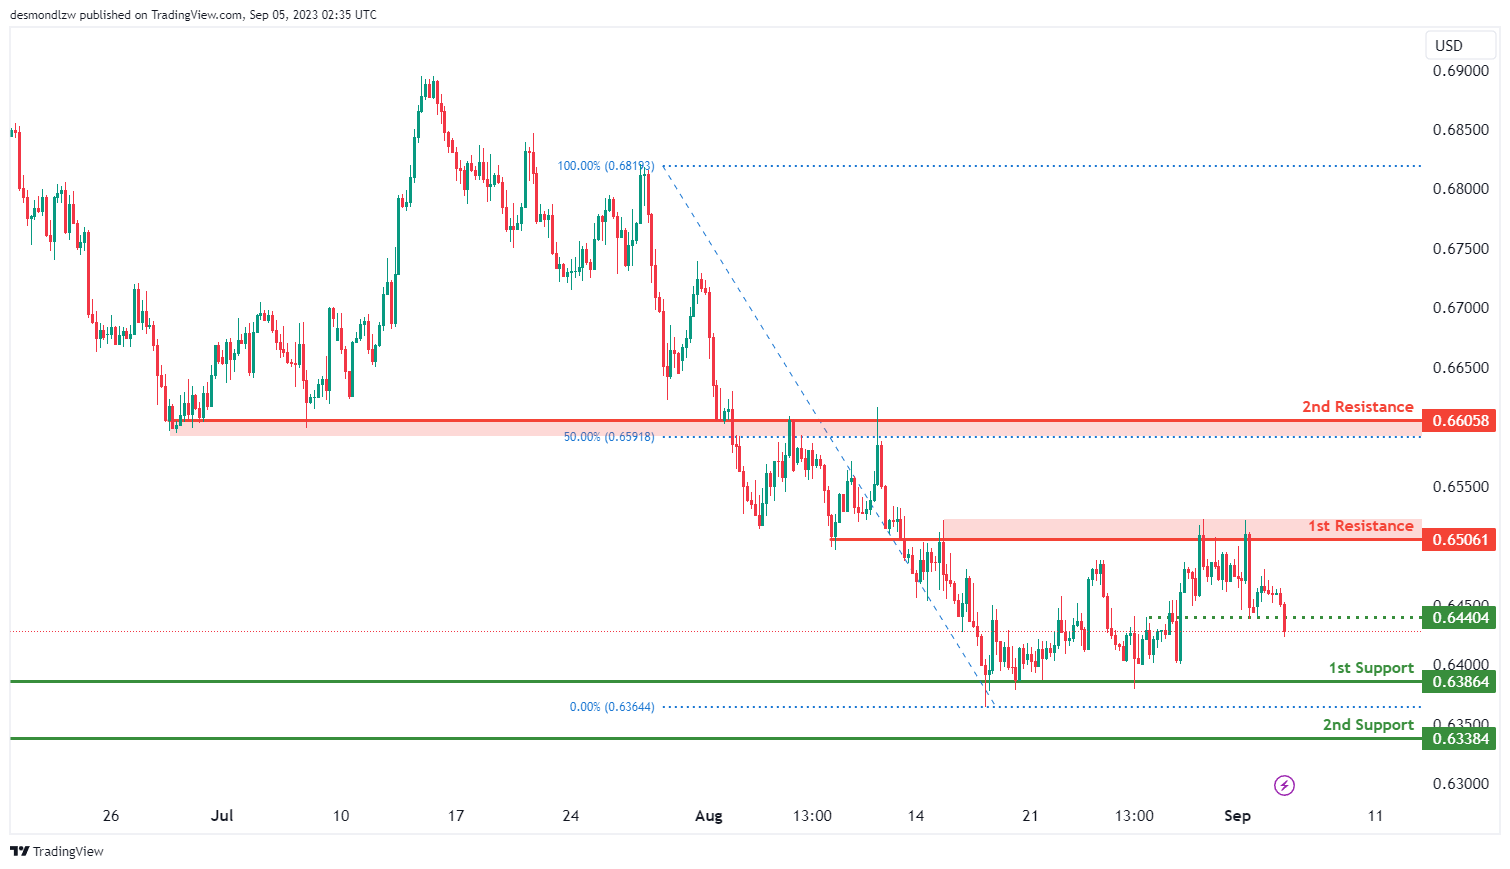
AUD/USD:
The AUD/USD chart is currently demonstrating a bearish momentum, with price having broken below the intermediate support level at 0.6440. This break suggests the potential for further bearish movement towards the 1st support level.
The 1st support level at 0.6386 is identified as a pullback support while the 2nd support level at 0.6338 also serves as a pullback support, further reinforcing its significance as a potential area of price support.
To the upside, the 1st resistance at 0.6506 is marked as an overlap resistance. Similarly, the 2nd resistance level at 0.6606 is also identified as an overlap resistance that aligns with the 50.00% Fibonacci retracement level.
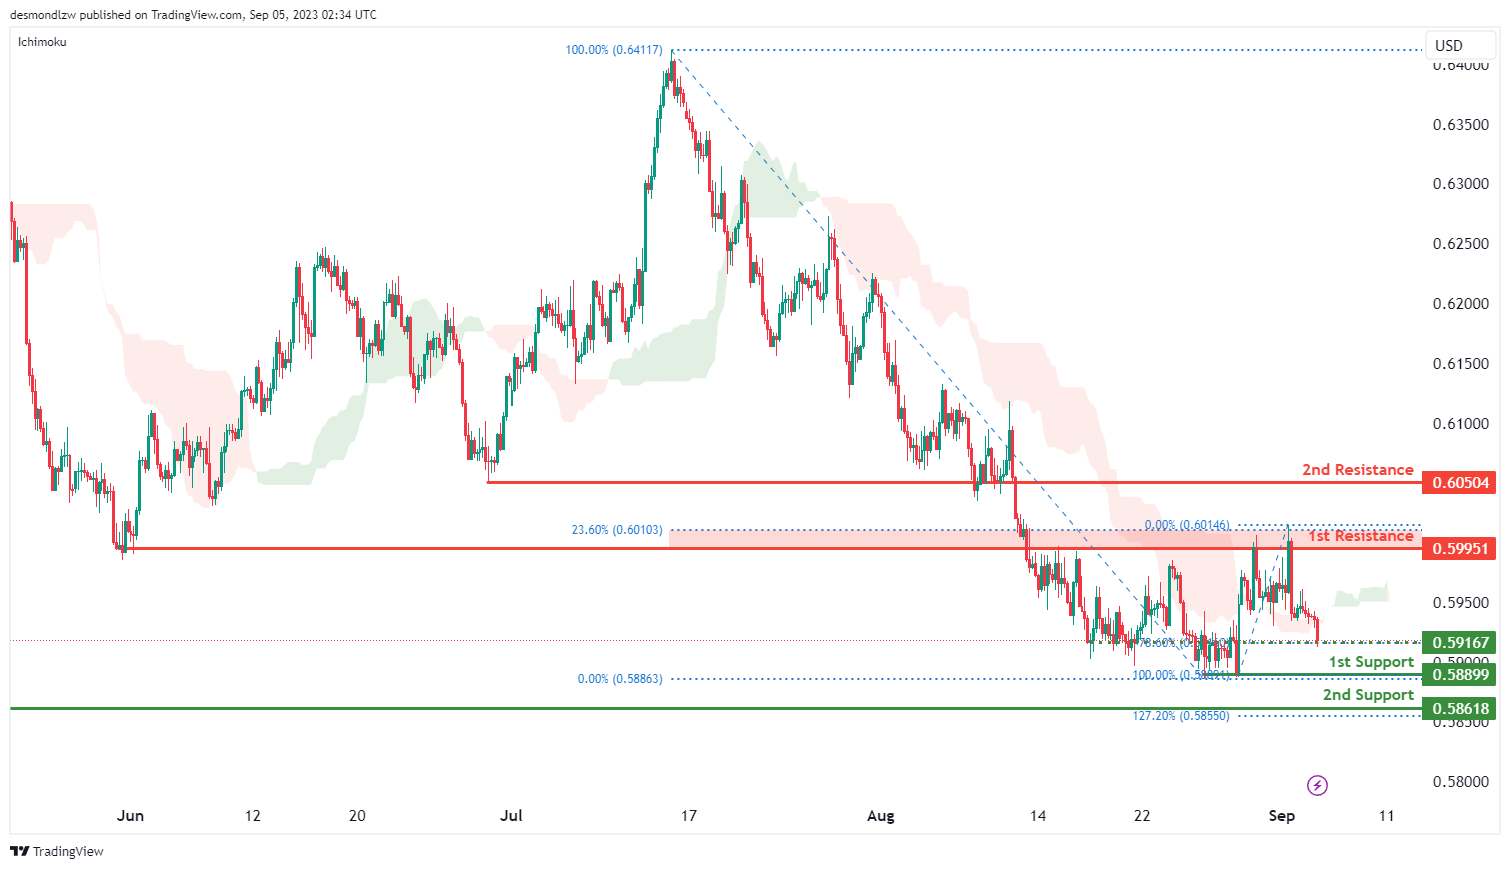
NZD/USD
The NZD/USD chart is currently exhibiting a bearish momentum, which is attributed to the price crossing below the Ichimoku cloud. This crossing indicates the potential for further bearish movement towards the 1st support level should price also break below the intermediate support level at 0.5917.
The 1st support level at 0.5889 is identified as a pullback support while the 2nd support level at 0.5862 is also identified as a pullback support that aligns with the 127.20% Fibonacci extension level.
To the upside, the 1st resistance at 0.5995 is marked as an overlap resistance that coincides with the 23.60% Fibonacci retracement level. Furthermore, the 2nd resistance level at 0.6050 is identified as a pullback resistance.
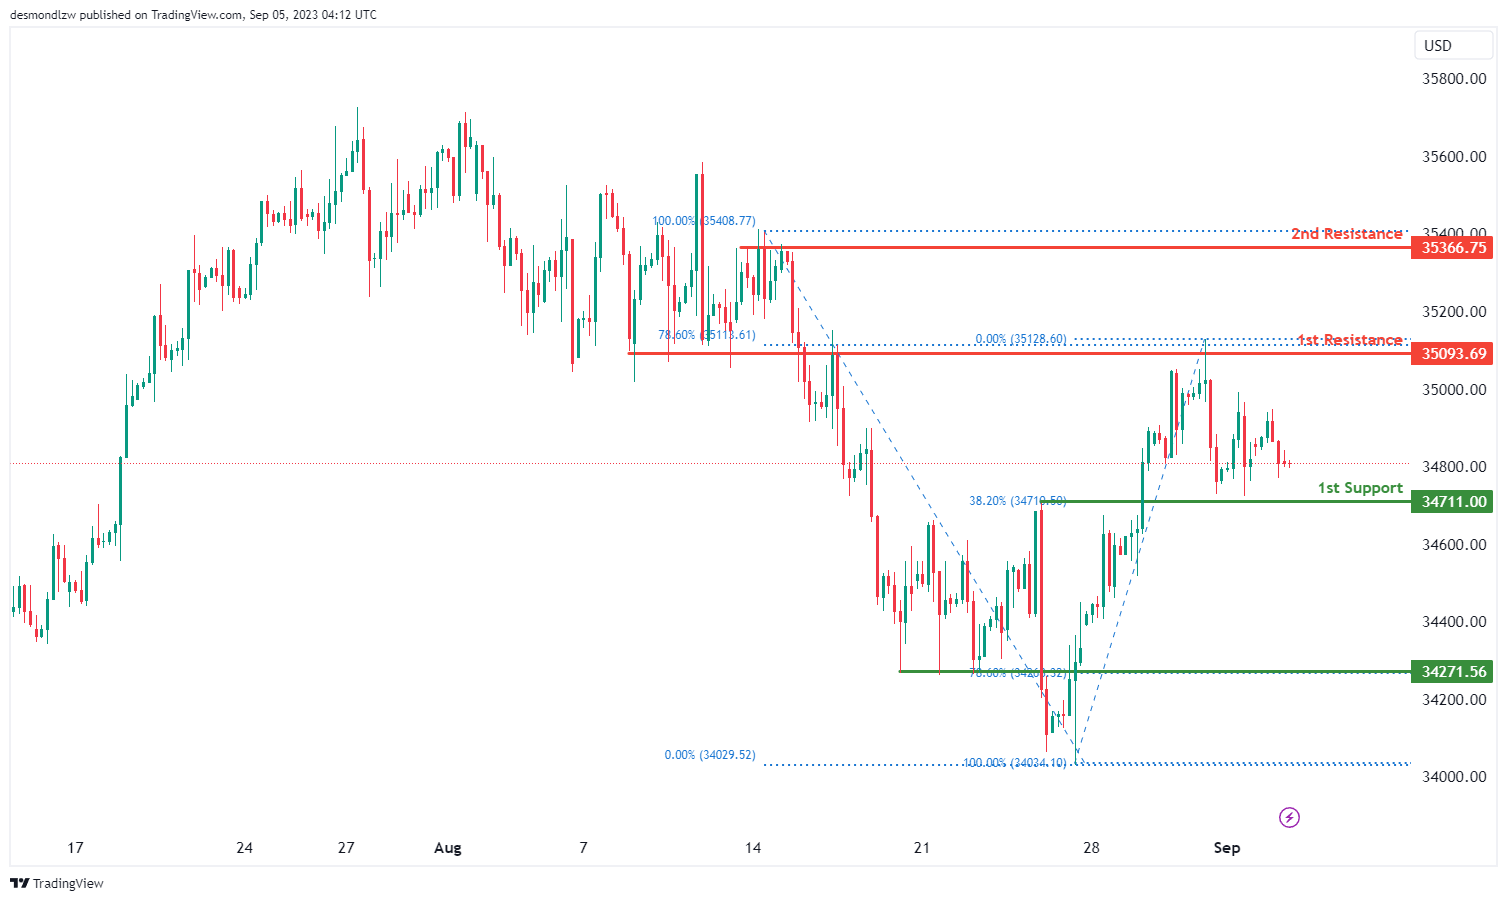
DJ30:
The instrument DJ30 currently reflects a bullish overall momentum on the chart.
However, there is a potential short-term scenario where the price could drop further to the 1st support level at 34711.00 before bouncing from there and subsequently rising towards the 1st resistance level.
The 1st support level at 34711.00 is considered good because it represents overlap support and aligns with a 38.20% Fibonacci Retracement.
Additionally, there is a 2nd support level at 34271.50, which is significant as it represents pullback support.
On the resistance side, the 1st resistance at 35093.60 is notable as it serves as overlap resistance and aligns with a 78.60% Fibonacci Retracement.
Furthermore, the 2nd resistance at 35366.70 is considered significant as it represents multi-swing high resistance.
GER30:
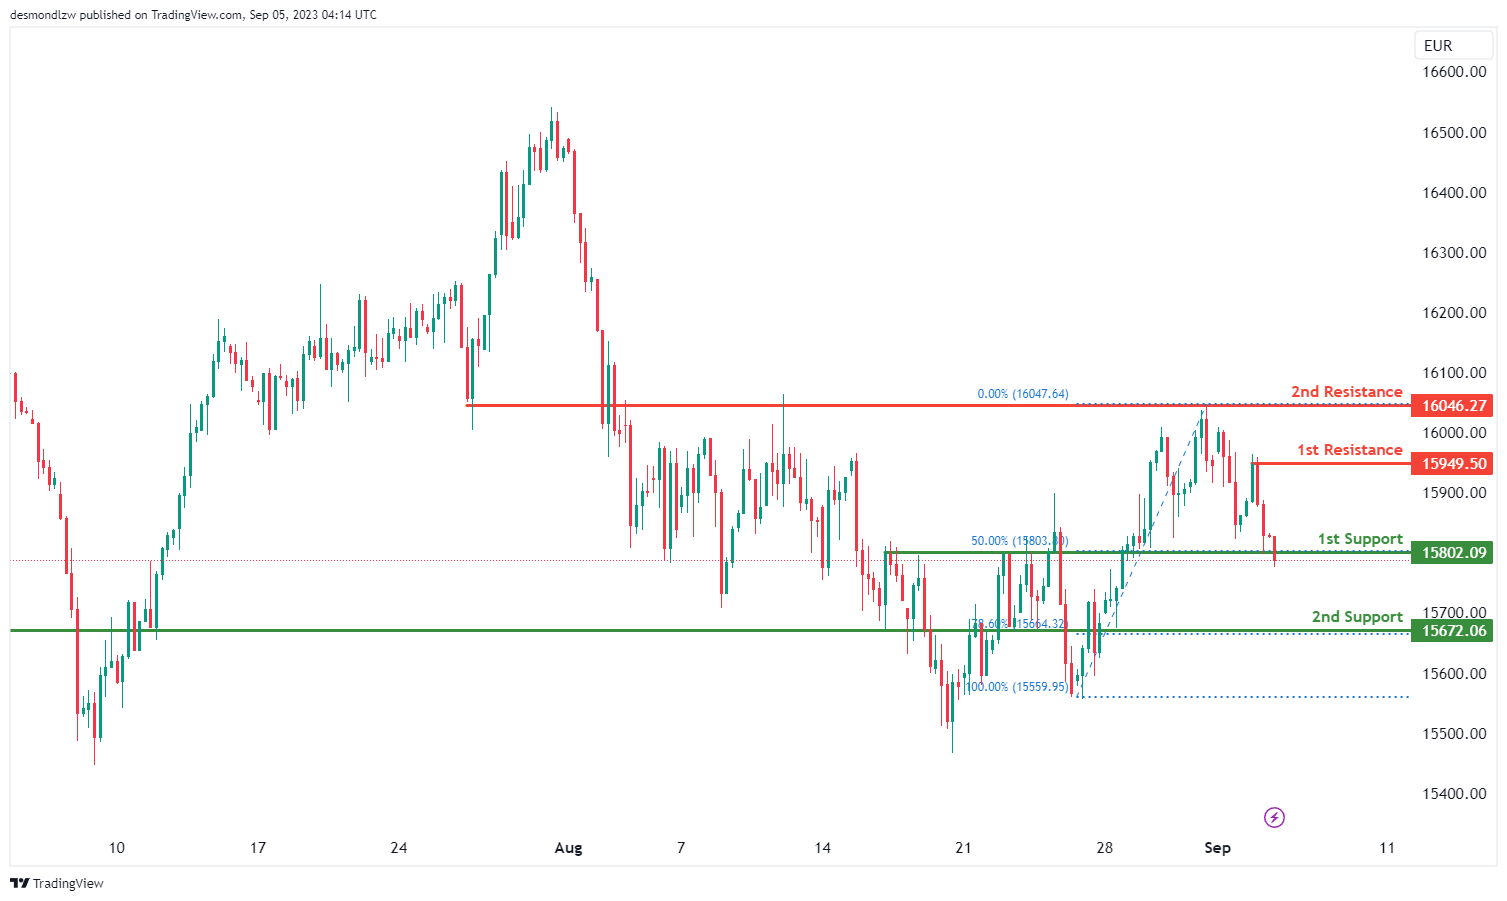
The instrument GER30 currently displays a bearish overall momentum on the chart.
There is a potential scenario where the price could make a bearish break off the 1st support level at 15802.00 and drop towards the 2nd support level at 15672.00.
The 1st support level at 15802.00 is considered strong as it represents overlap support and aligns with a 50% Fibonacci Retracement.
Additionally, there is a 2nd support level at 15672.00, which is also significant as it represents overlap support and aligns with a 78.60% Fibonacci Retracement.
On the resistance side, the 1st resistance at 15949.50 is noteworthy as it serves as swing high resistance.
Furthermore, the 2nd resistance at 16046.20 is considered significant as it represents overlap resistance.
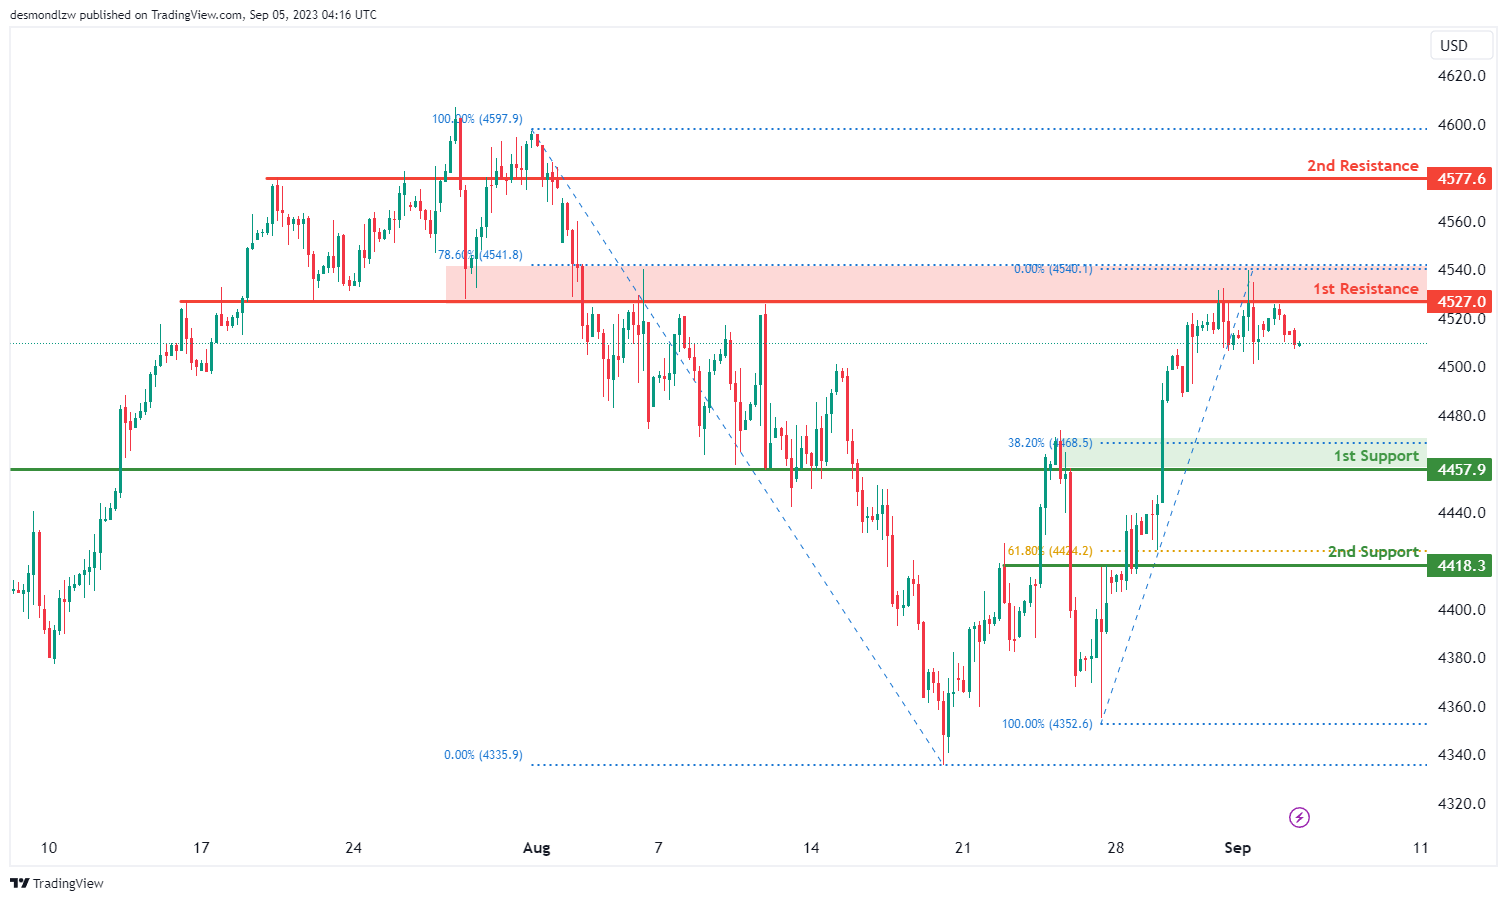
US500
The instrument US500 (S&P 500) currently demonstrates a bearish overall momentum on the chart.
There is a potential scenario where the price could continue its bearish movement towards the 1st support level at 4457.9.
The 1st support level at 4457.9 is considered strong because it represents pullback support and aligns with a 38.20% Fibonacci Retracement.
Additionally, there is a 2nd support level at 4418.3, which is also significant as it represents pullback support and aligns with a 61.80% Fibonacci Retracement.
On the resistance side, the 1st resistance at 4527.0 is noteworthy as it serves as overlap resistance and aligns with a 78.60% Fibonacci Retracement.
Furthermore, the 2nd resistance at 4577.6 is considered significant as it represents overlap resistance.
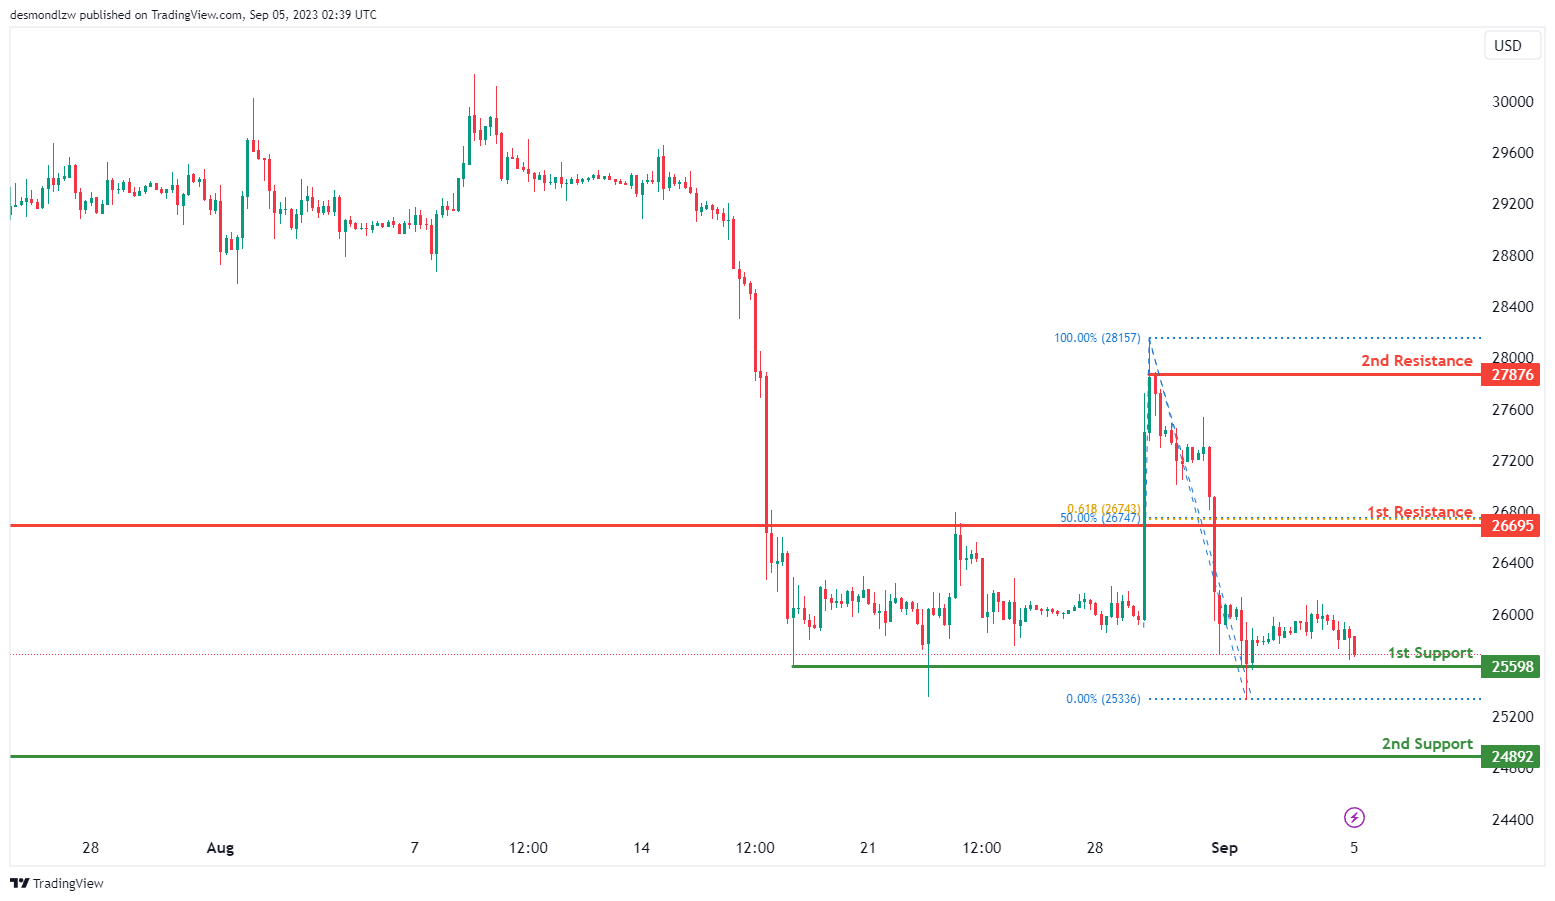
BTC/USD:
The instrument BTC/USD currently reflects a bullish overall momentum on the chart.
Price is potentially set to make a bullish move, bouncing off the 1st support level at 25598. This support level is considered good because it represents multi-swing low support.
There is also a 2nd support level at 24892, which is significant as it represents swing low support.
On the resistance side, the 1st resistance at 26695 is seen as a strong point because it serves as a pullback resistance and aligns with both a 50% Fibonacci Retracement and a 61.80% Fibonacci Projection, indicating Fibonacci confluence.
Furthermore, the 2nd resistance at 27876 is considered significant as it represents swing high resistance.
Overall, the chart suggests a bullish momentum, with the potential for a bullish bounce off the 1st support level, leading towards the 1st resistance level for BTC/USD.
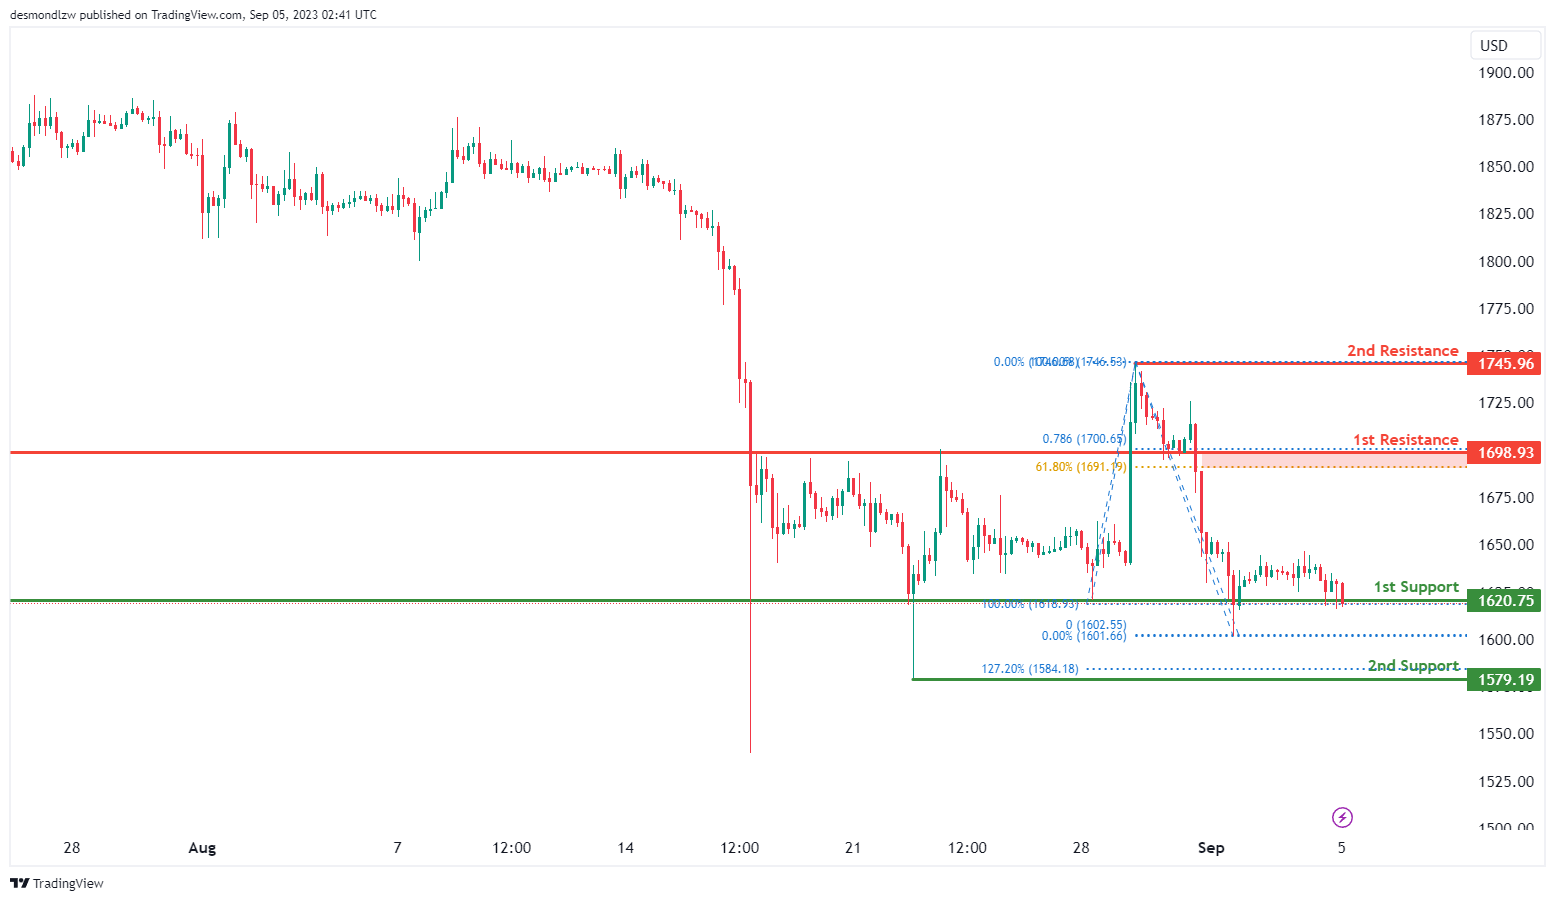
ETH/USD:
The instrument ETH/USD currently demonstrates a bullish overall momentum on the chart.
There’s a potential scenario where the price could make a bullish move by bouncing off the 1st support level at 1620.75. This support level is considered strong because it represents multi-swing low support.
Additionally, there is a 2nd support level at 1579.19, which is significant as it represents swing low support and aligns with a 127.20% Fibonacci Extension.
On the resistance side, the 1st resistance at 1698.93 is notable as it serves as a pullback resistance and aligns with both a 61.80% Fibonacci Retracement and a 78.60% Fibonacci Projection, indicating Fibonacci confluence.
Furthermore, the 2nd resistance at 1745.96 is considered significant as it represents swing high resistance.
Overall, the chart suggests a bullish momentum, with the potential for a bullish bounce off the 1st support level, leading towards the 1st resistance level for ETH/USD.
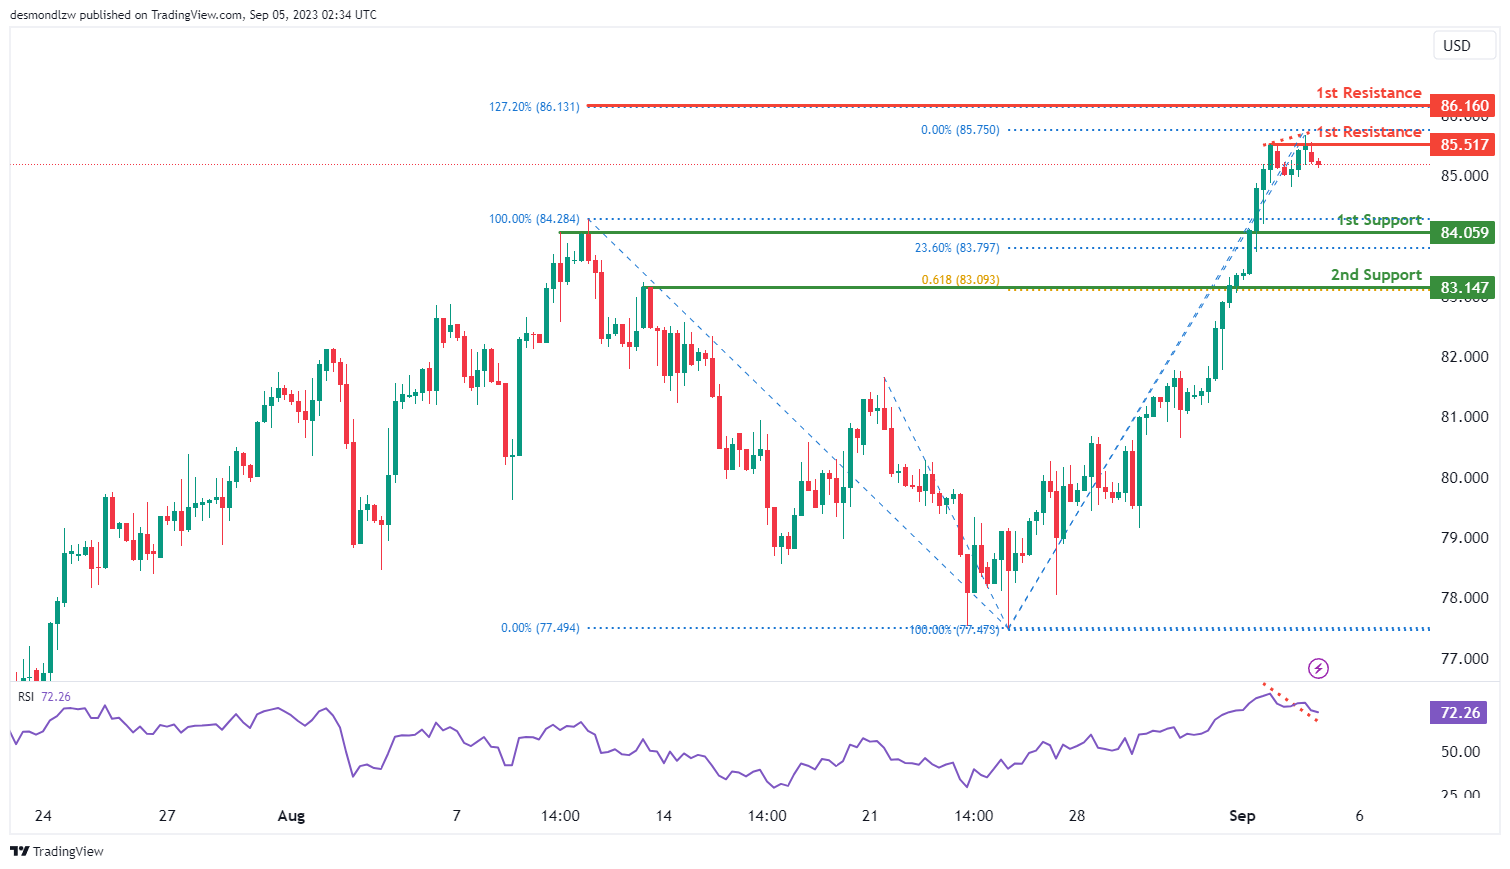
WTI/USD:
The WTI chart is currently demonstrating a bearish momentum, indicating a downward trend in price movement. Given this bearish sentiment, there is potential for price to experience a bearish continuation towards the 1st support level.
Additionally, the Relative Strength Index (RSI) is displaying bearish divergence compared to the price, which suggests the possibility of a reversal occurring soon. This divergence in RSI adds to the overall bearish outlook and potential for a price reversal.
The 1st support level at 84.06 is identified as a pullback support that aligns with the 23.60% Fibonacci retracement level. Furthermore, the 2nd support level at 83.15 is also identified as a pullback support that coincides with the 61.80% Fibonacci projection level.
To the upside, the 1st resistance level at 85.52 is marked as a multiple swing-high resistance while the 2nd resistance level at 86.16 is identified as a resistance level that aligns with the 127.20% Fibonacci extension level.
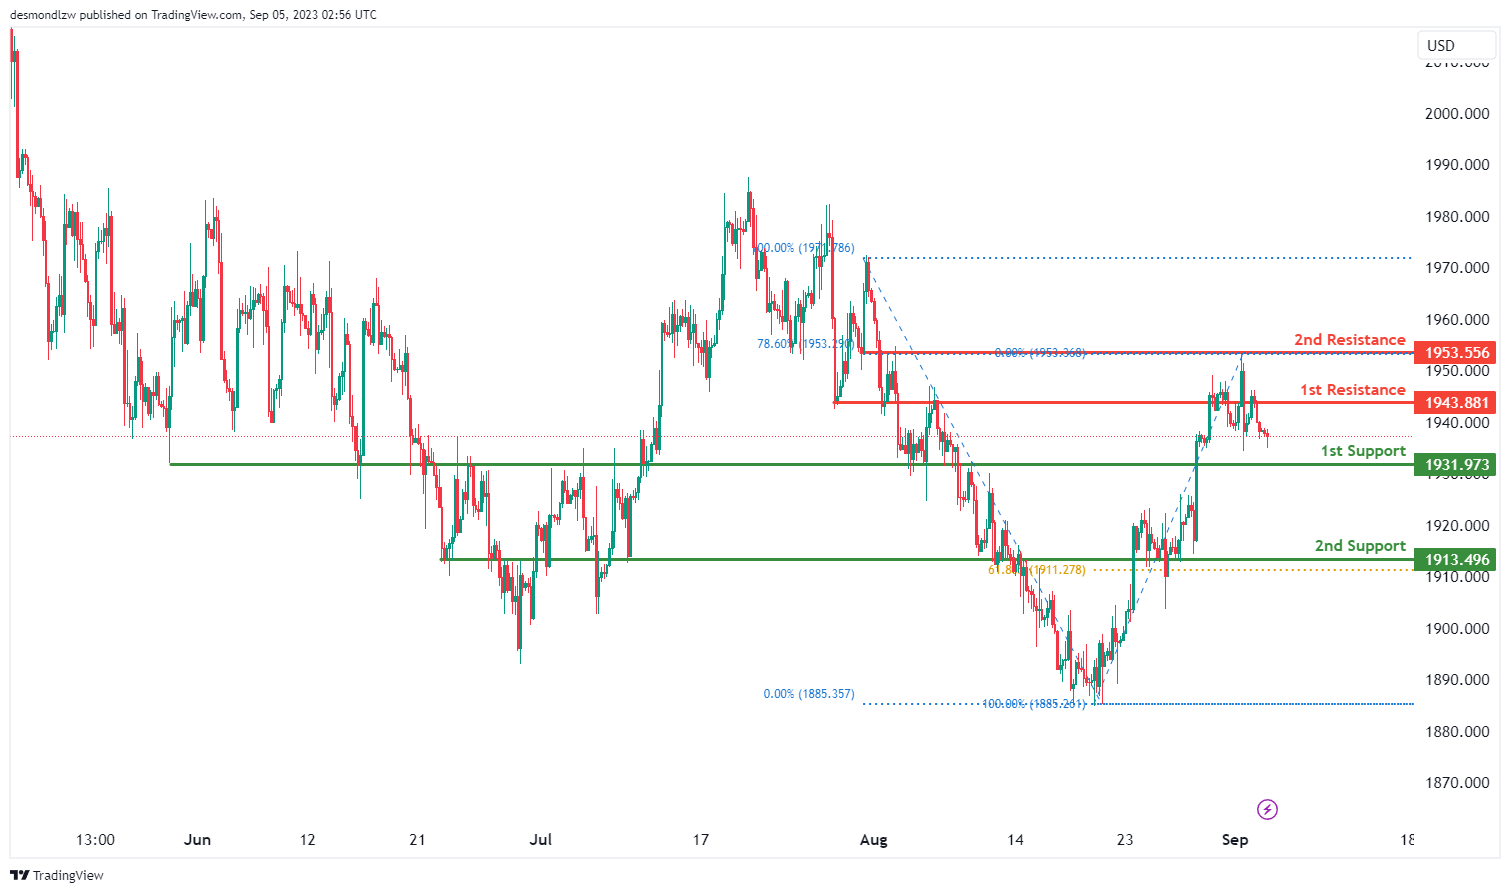
XAU/USD (GOLD):
The XAU/USD chart currently demonstrates a bearish overall momentum, suggesting a trend towards downward price movement.
There’s potential for a bearish continuation towards the 1st support level.
The 1st support at 1931.97 is recognized as a pullback support, indicating a historical area where the price found support.
The 2nd support at 1913.49 is marked as an overlap support, aligning with the 61.80% Fibonacci Retracement, which enhances its significance as a potential support zone.
In terms of resistance levels, the 1st resistance at 1943.88 is identified as an overlap resistance, implying historical instances of the price facing resistance around this level.
The 2nd resistance at 1953.55 gains importance as an overlap resistance and aligns with the 78.60% Fibonacci Retracement, making it a noteworthy zone for potential price reactions.


