
DXY:
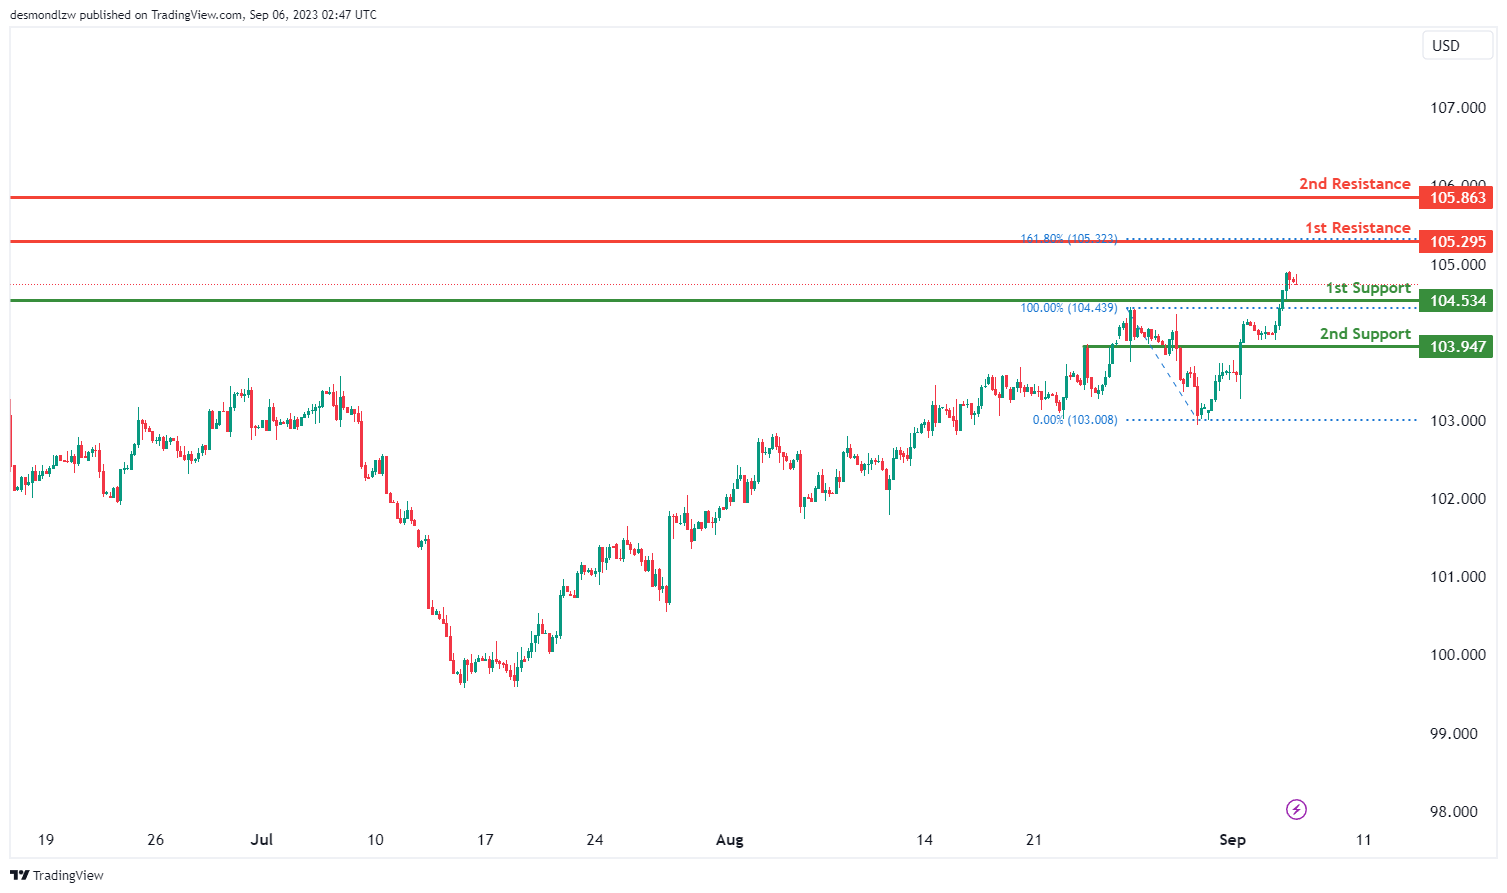
The DXY chart is currently characterized by a bullish overall momentum, indicating the potential for an upward trend in price movement.
There’s the possibility of a bullish continuation towards the 1st resistance level at 105.29, which is considered a significant level due to its alignment with a swing high resistance and the presence of the 161.80% Fibonacci Extension.
Support levels include the 1st support at 104.53, which is seen as a pullback support, and the 2nd support at 103.94, recognized as an overlap support.
Additionally, the 2nd resistance at 105.86 is marked as a swing high resistance, suggesting a potential area of resistance should the price continue its bullish movement.
EUR/USD:
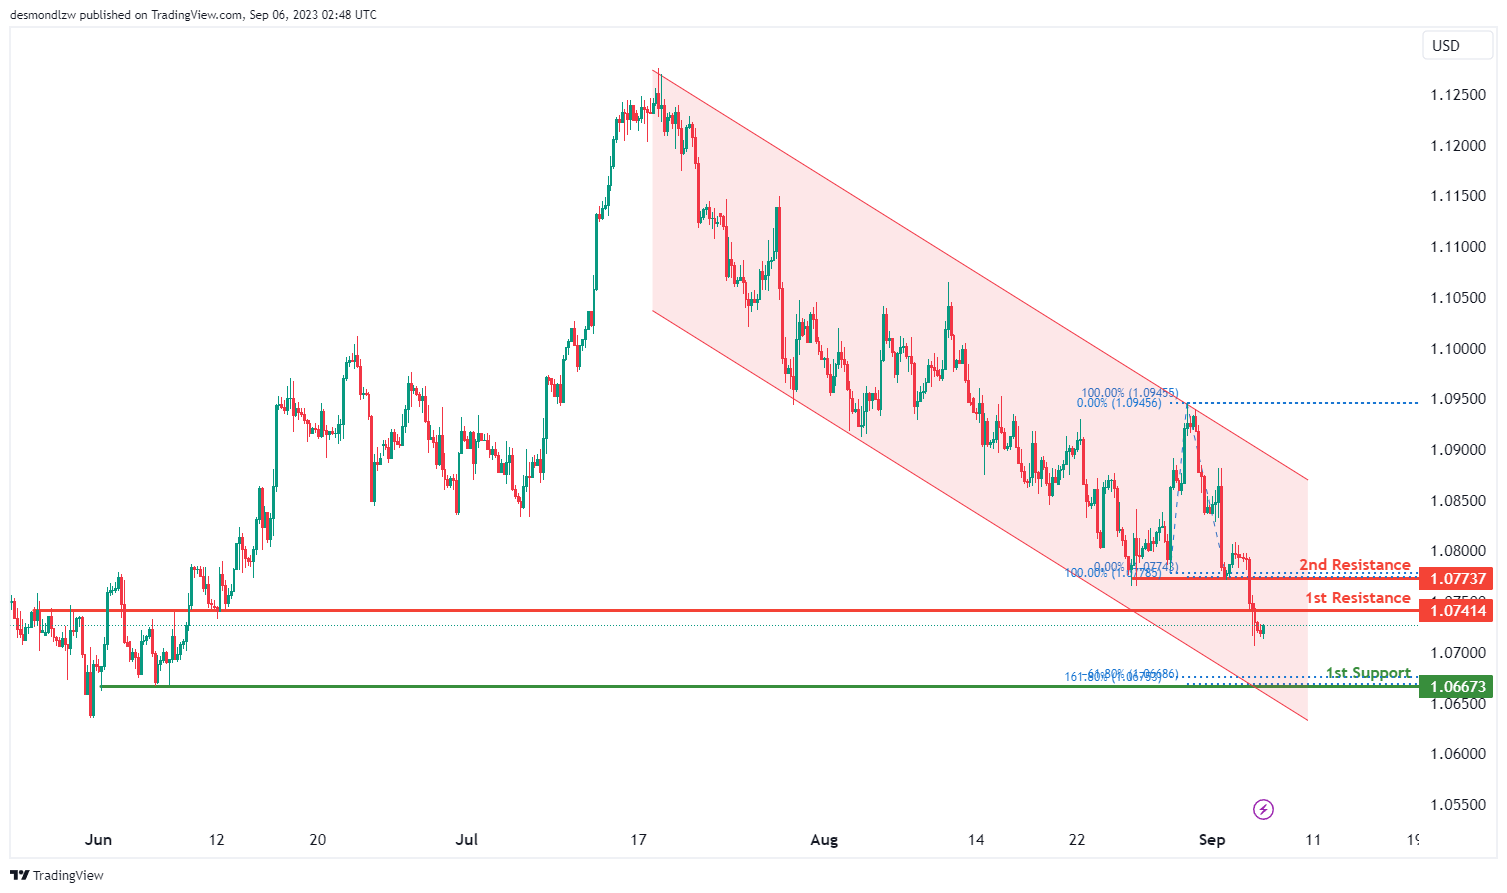
The EUR/USD chart currently exhibits a bearish momentum, characterized by its position within a descending channel.
There’s potential for a bearish continuation towards the 1st support level at 1.0667. This support is significant due to its alignment with a swing low support, the presence of the 161.80% Fibonacci Extension, and the -61.8% Fibonacci Expansion, indicating a strong Fibonacci confluence.
On the resistance side, the 1st resistance at 1.0741 is identified as a pullback resistance, while the 2nd resistance at 1.0773 also acts as a pullback resistance. These levels could potentially serve as barriers to any bullish movement.
EUR/JPY:
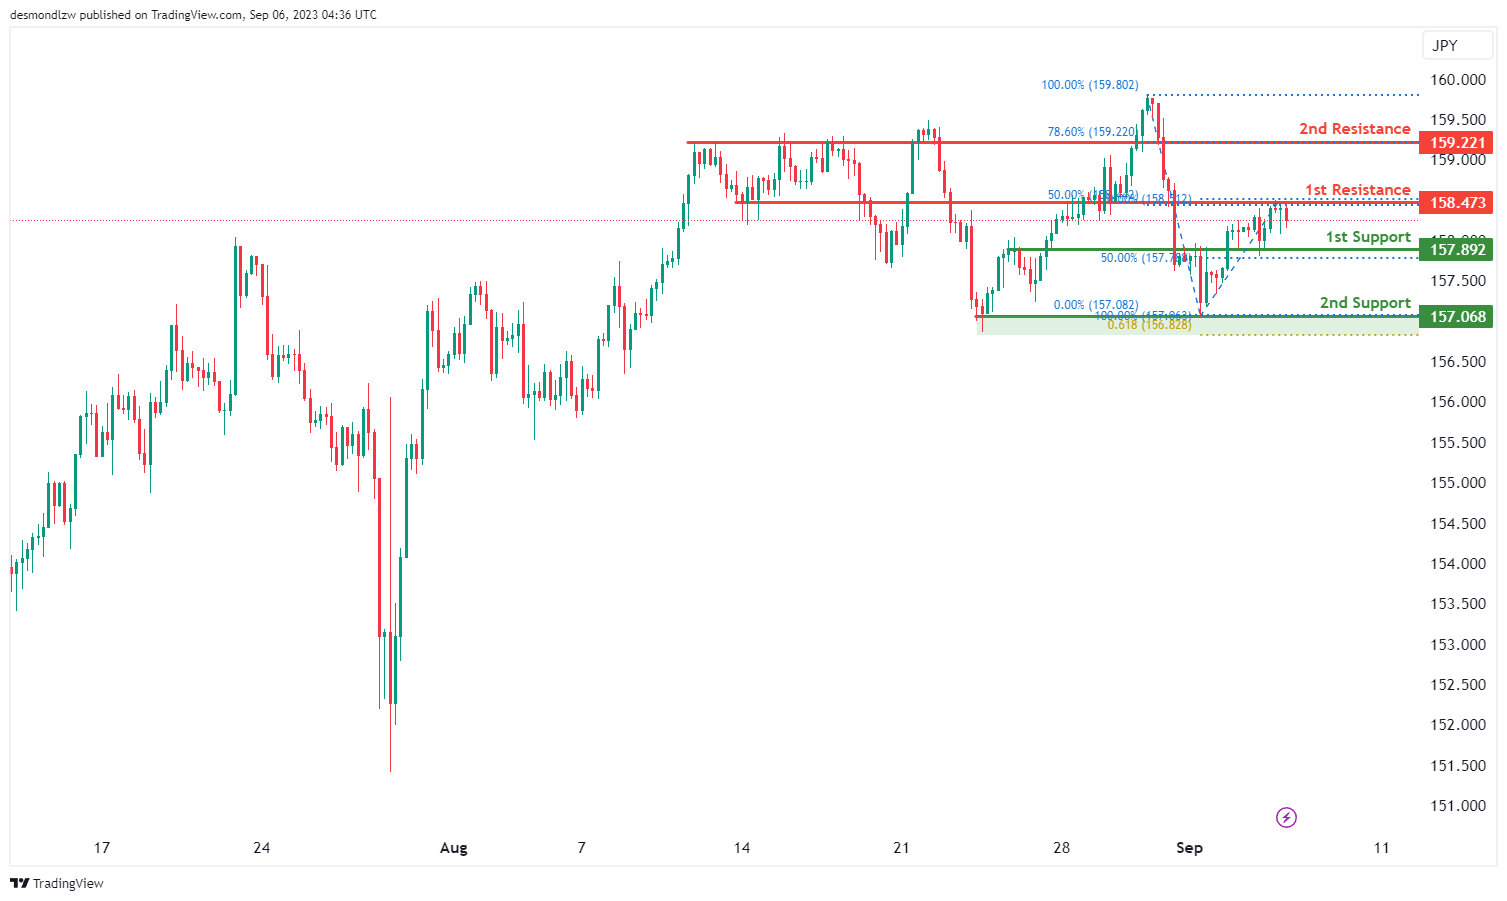
The instrument EUR/JPY currently exhibits a neutral overall momentum on the chart.
In this context, there is a potential scenario where the price could fluctuate between the 1st resistance level at 158.47 and the 1st support level at 157.89.
The 1st support level at 157.89 is considered good because it represents overlap support and aligns with a 50% Fibonacci Retracement. Additionally, there is a 2nd support level at 157.06, which is significant as it represents multi-swing low support and aligns with a 61.80% Fibonacci Projection.
On the resistance side, the 1st resistance at 158.47 is noteworthy because it serves as overlap resistance and aligns with a 50% Fibonacci Retracement.
Furthermore, the 2nd resistance level at 159.22 is considered significant as it represents overlap resistance and aligns with a 78.60% Fibonacci Retracement.
EUR/GBP:
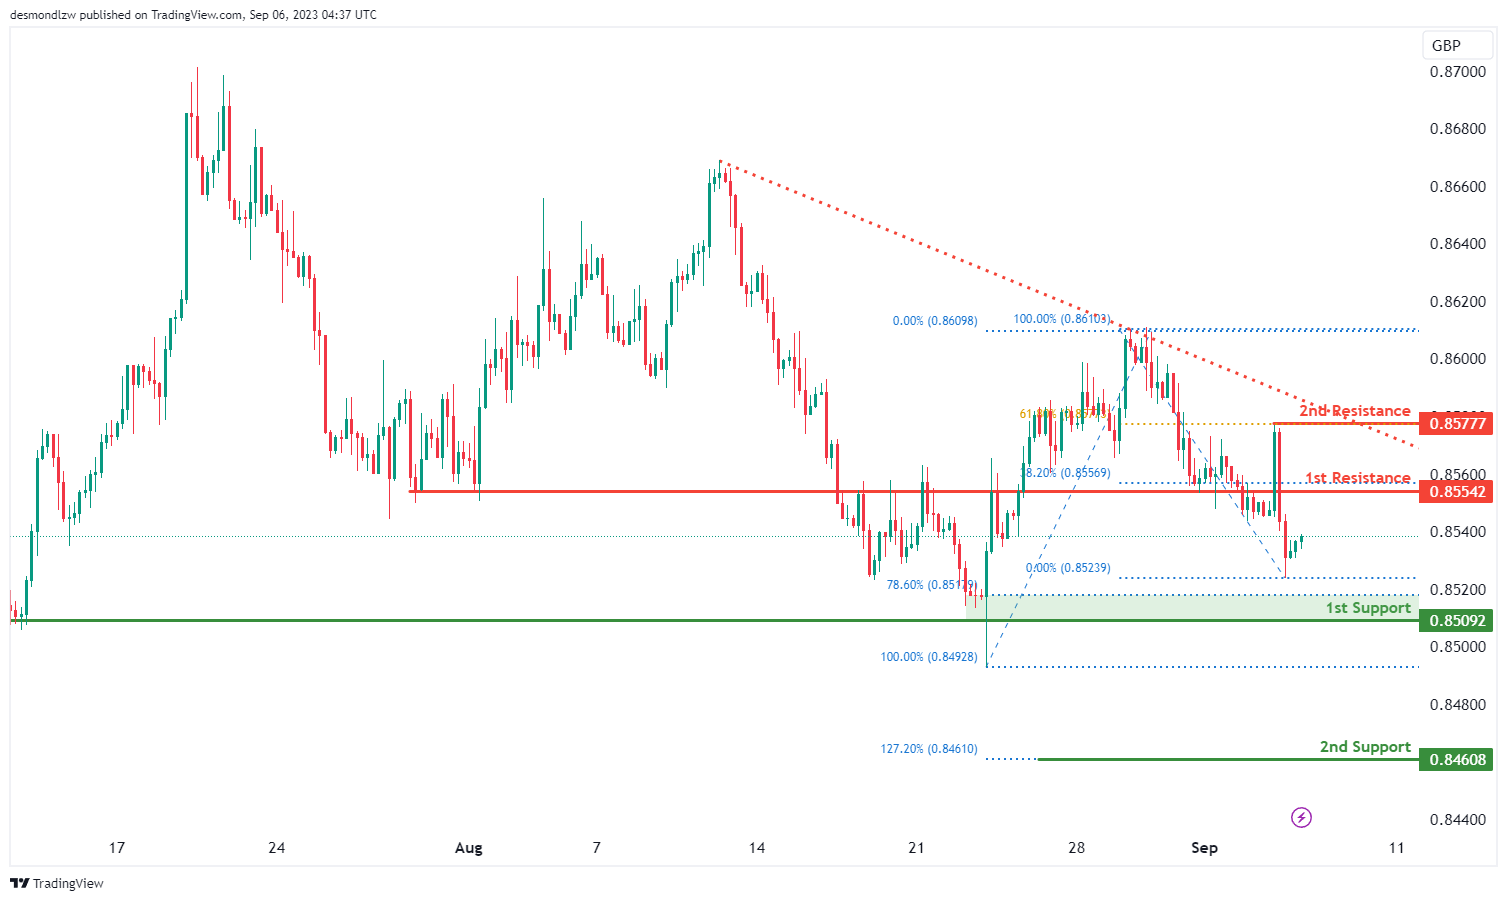
The instrument EUR/GBP currently displays a bearish overall momentum on the chart, primarily influenced by the fact that the price is below a major descending trend line, indicating a bearish trend is in place.
In this context, there is a potential short-term scenario where the price could rise towards the 1st resistance level at 0.8554 before reversing off it and subsequently dropping towards the 1st support level at 0.8509.
The 1st support level at 0.8509 is considered strong as it represents multi-swing low support and aligns with a 78.60% Fibonacci Retracement.
Additionally, there is a 2nd support level at 0.8460, which is significant as it represents swing low support and aligns with a 127.20% Fibonacci Extension.
On the resistance side, the 1st resistance at 0.8554 is noteworthy because it serves as overlap resistance and aligns with a 38.20% Fibonacci Retracement.
Furthermore, the 2nd resistance level at 0.8577 is considered significant as it represents swing high resistance and aligns with a 61.80% Fibonacci Retracement.
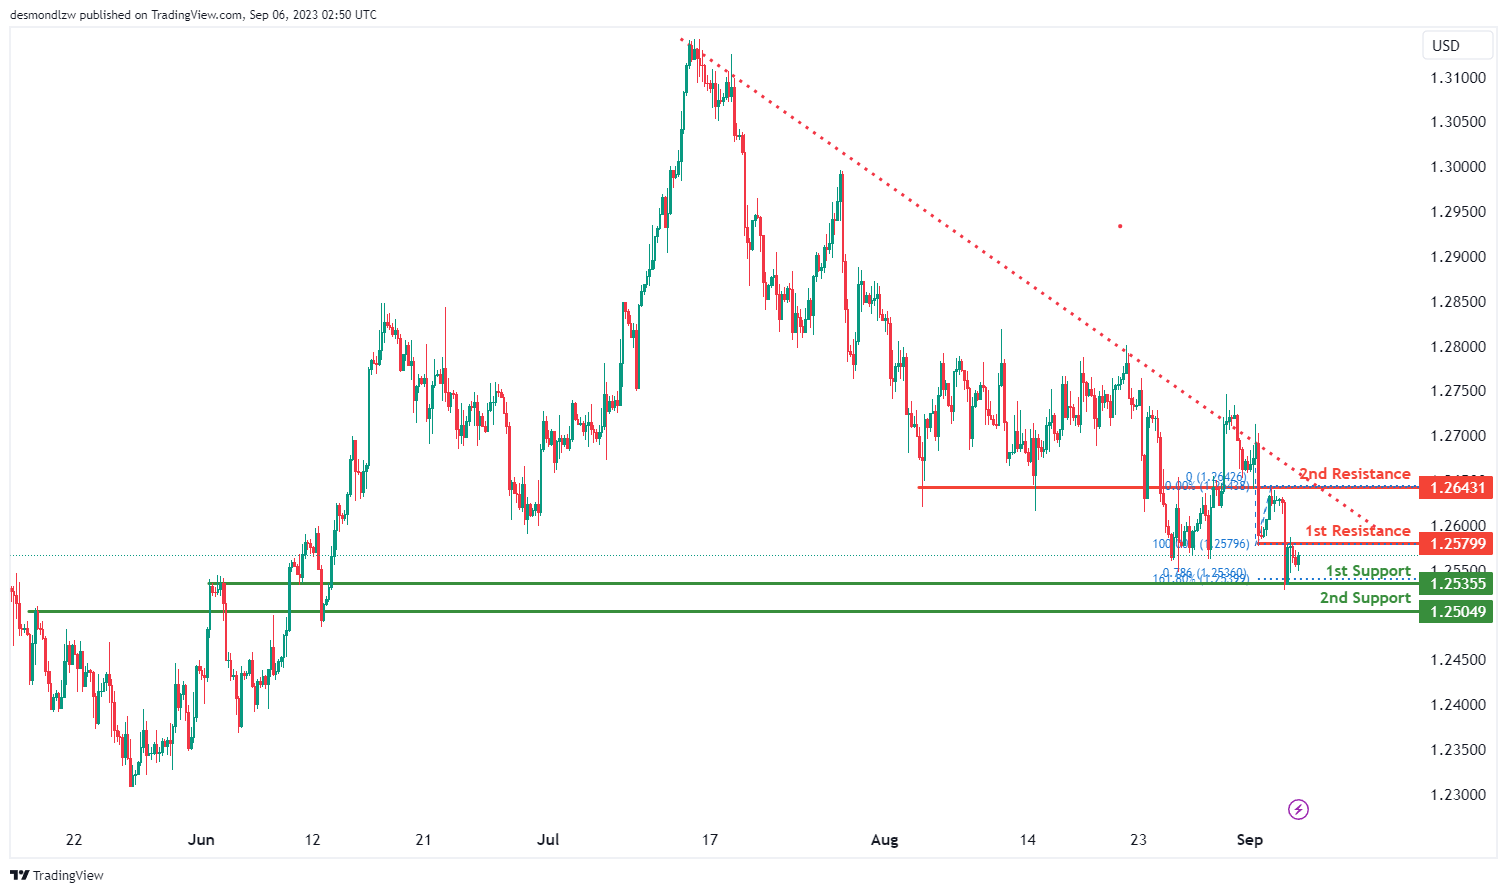
GBP/USD:
The GBP/USD chart currently maintains a bearish momentum, with price positioned below a significant descending trend line, indicating a potential for continued bearish movement.
There’s a likelihood of a bearish reaction at the 1st resistance level, potentially leading to a decline towards the 1st support.
The 1st support at 1.2535 is identified as a multi-swing low support and aligns with the 78.60% Fibonacci Projection and the 161.80% Fibonacci Extension, signifying a strong Fibonacci confluence, thereby adding to its significance as a potential support level.
Another 1st support at 1.2504 is marked as an overlap support, indicating historical instances of price finding support around this level.
Looking at resistance levels, the 1st resistance at 1.2579 is designated as an overlap resistance, while the 2nd resistance at 1.2643 also functions as an overlap resistance. These levels could act as barriers to any bullish movements.
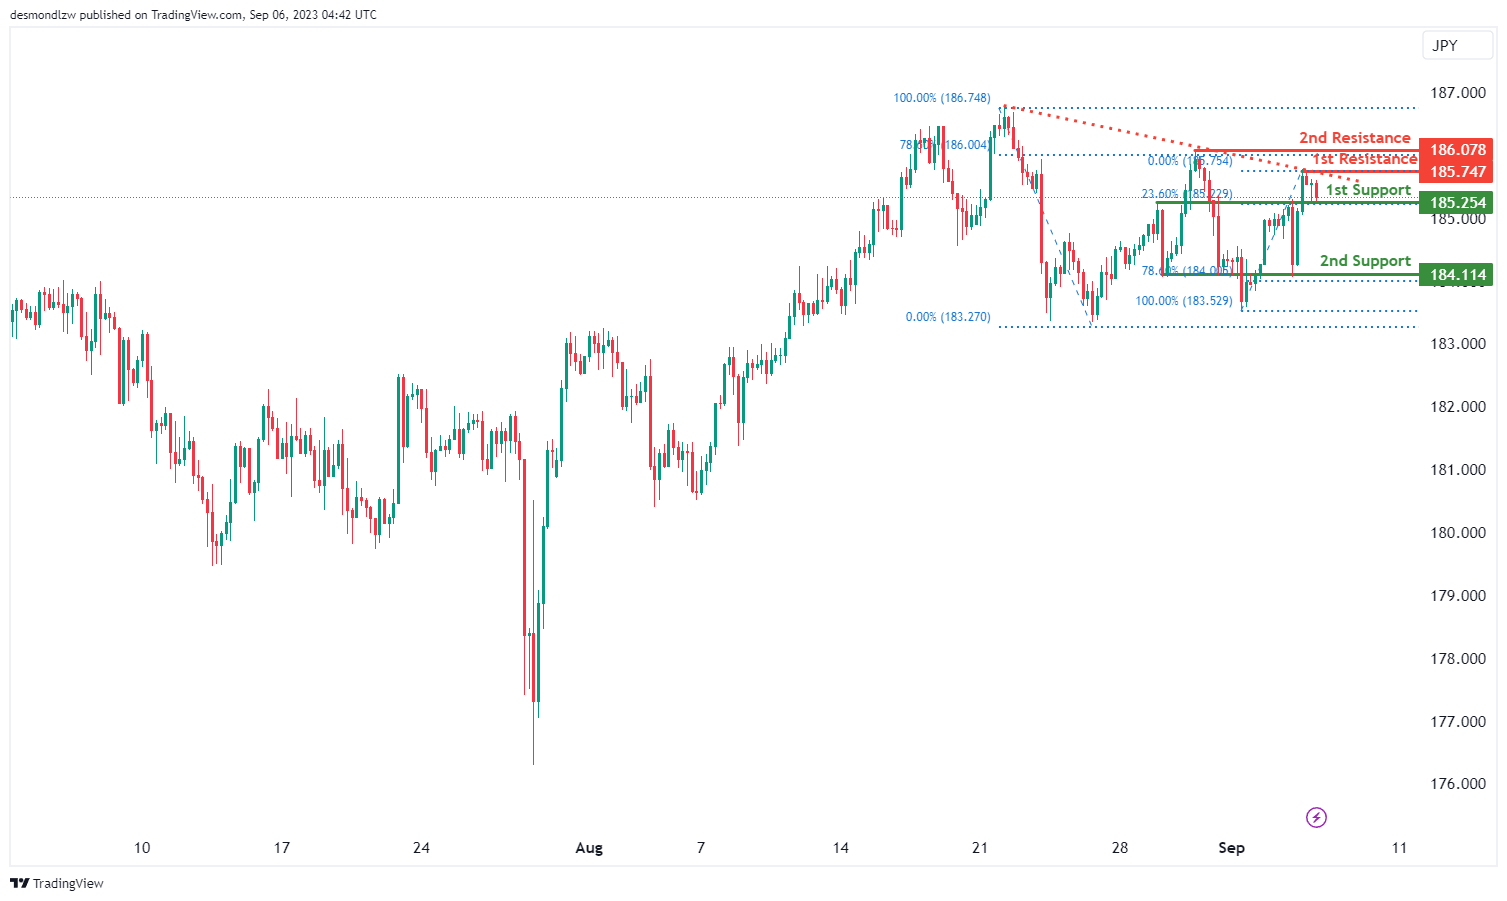
GBP/JPY:
The instrument GBP/JPY currently exhibits a neutral overall momentum on the chart.
In this context, there is a potential scenario where the price could fluctuate between the 1st resistance level at 185.74 and the 1st support level at 185.25.
The 1st support level at 185.25 is considered good because it represents pullback support and aligns with a 23.60% Fibonacci Retracement. Additionally, there is a 2nd support level at 184.11, which is significant as it represents overlap support and aligns with a 78.60% Fibonacci Retracement.
On the resistance side, the 1st resistance at 185.74 is noteworthy because it serves as swing high resistance.
Furthermore, the 2nd resistance level at 186.07 is considered significant as it represents swing high resistance and aligns with a 78.60% Fibonacci Retracement.
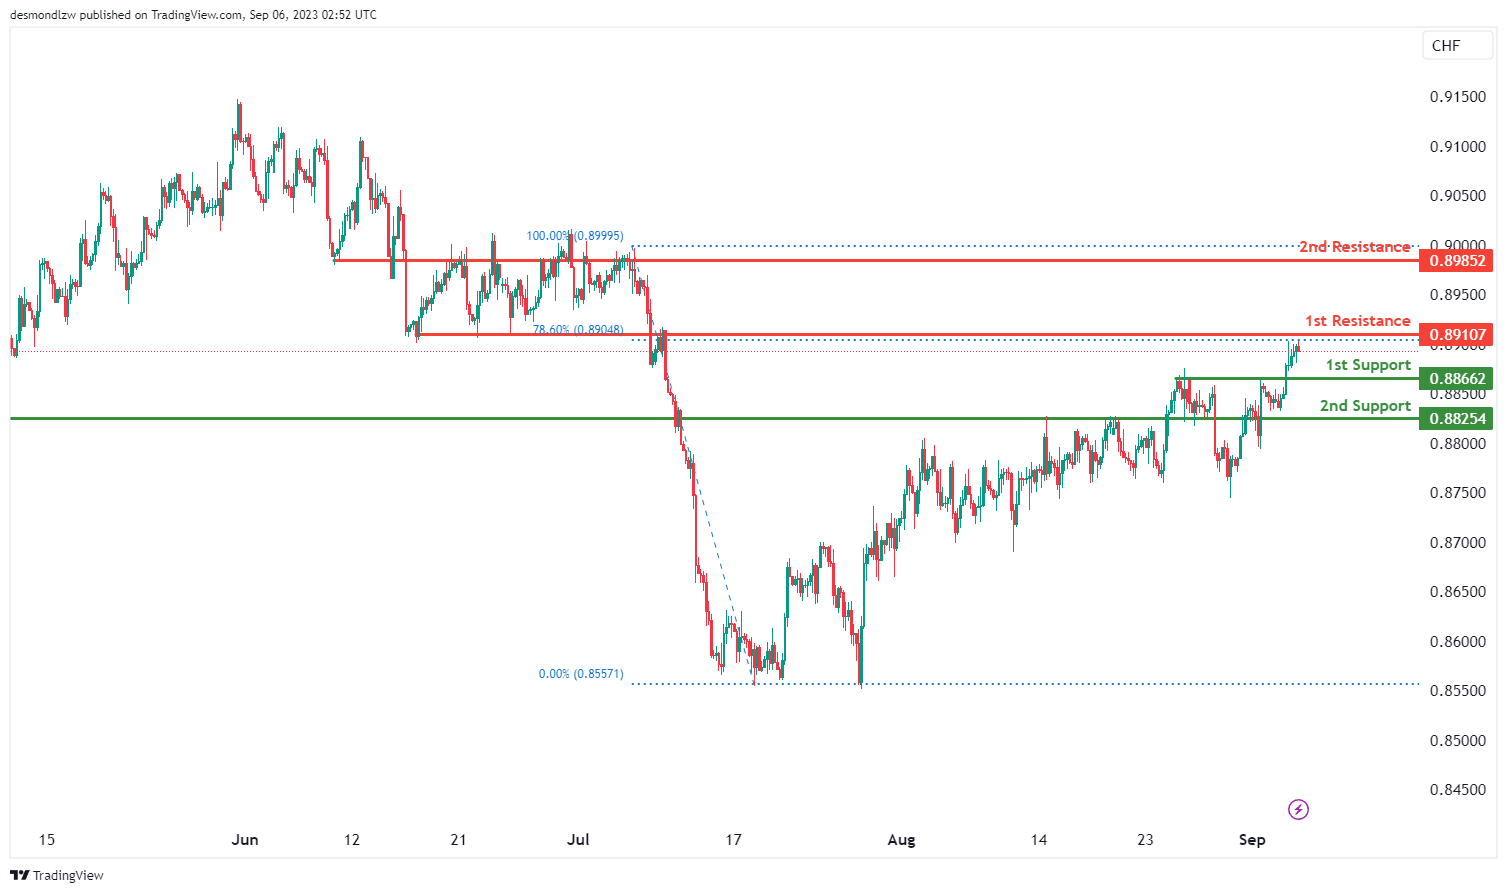
USD/CHF:
The USD/CHF chart currently exhibits a bearish momentum, indicating a potential downward trend in price movement.
There’s a possibility of a bearish reaction at the 1st resistance level, potentially leading to a drop towards the 1st support.
The 1st support at 0.8866 is identified as a pullback support, while the 2nd support at 0.8825 also functions as a pullback support, reinforcing their significance as potential areas of price support.
On the resistance side, the 1st resistance at 0.8910 is marked as an overlap resistance, and the 2nd resistance at 0.8985 is also identified as an overlap resistance. These resistance levels may act as barriers to any bullish moves.
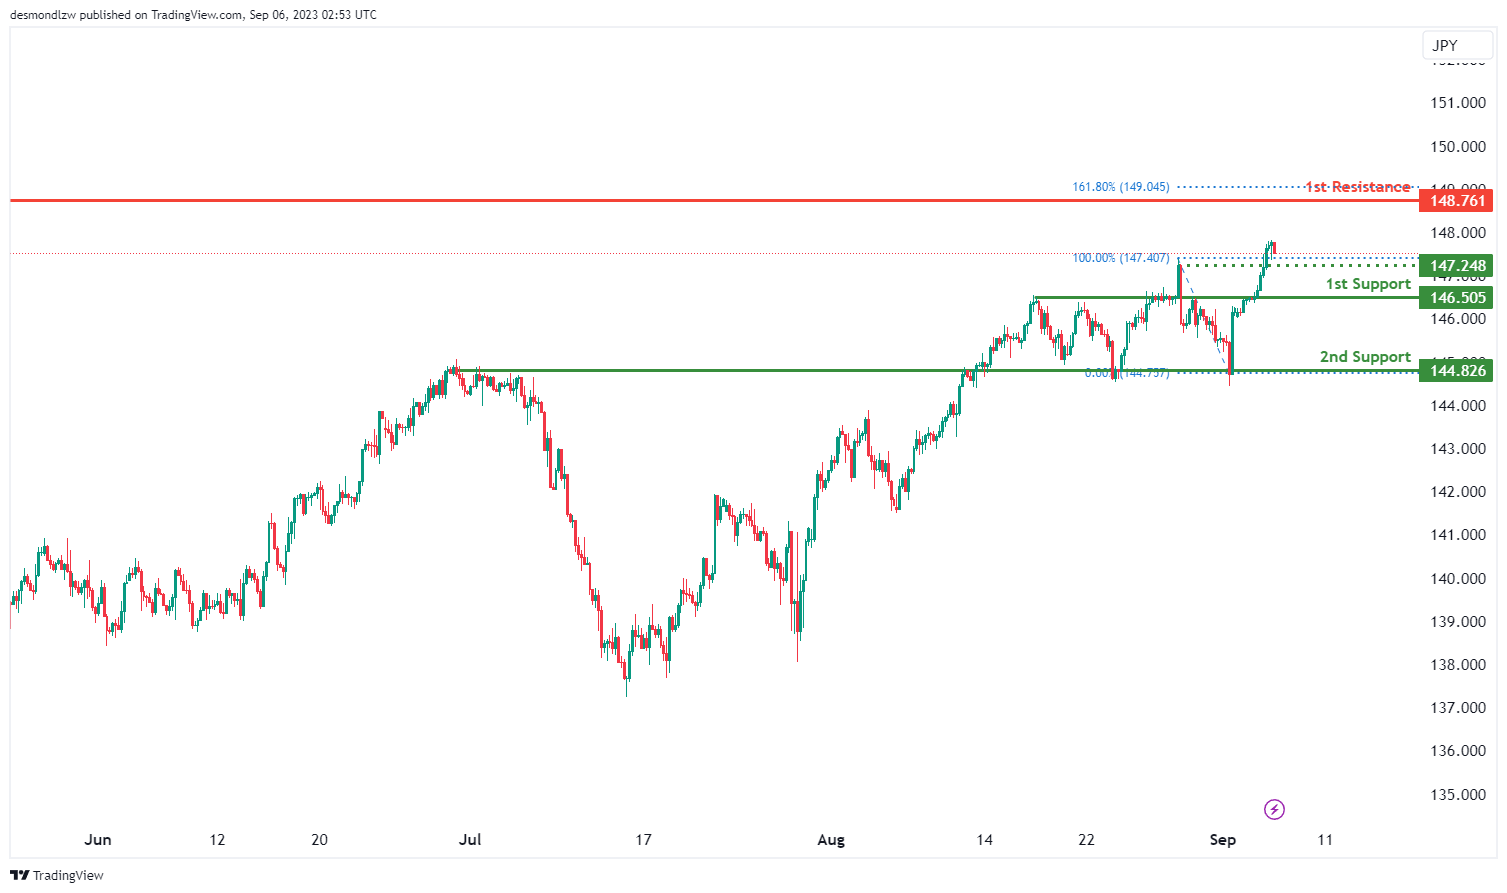
USD/JPY:
The USD/JPY chart currently exhibits a bullish overall momentum, indicating a potential upward trend in price movement.
There’s a possibility of a bullish continuation towards the 1st resistance level at 148.76.
The 1st support at 146.50 is identified as a pullback support, while the 2nd support at 144.82 is considered an overlap support. These support levels may provide a foundation for potential price increases.
The 1st resistance at 148.76 is marked as a swing high resistance and is also aligned with the 161.80% Fibonacci Extension, further enhancing its significance as a potential barrier to bullish movement. An intermediate support level at 147.24 is also noted.
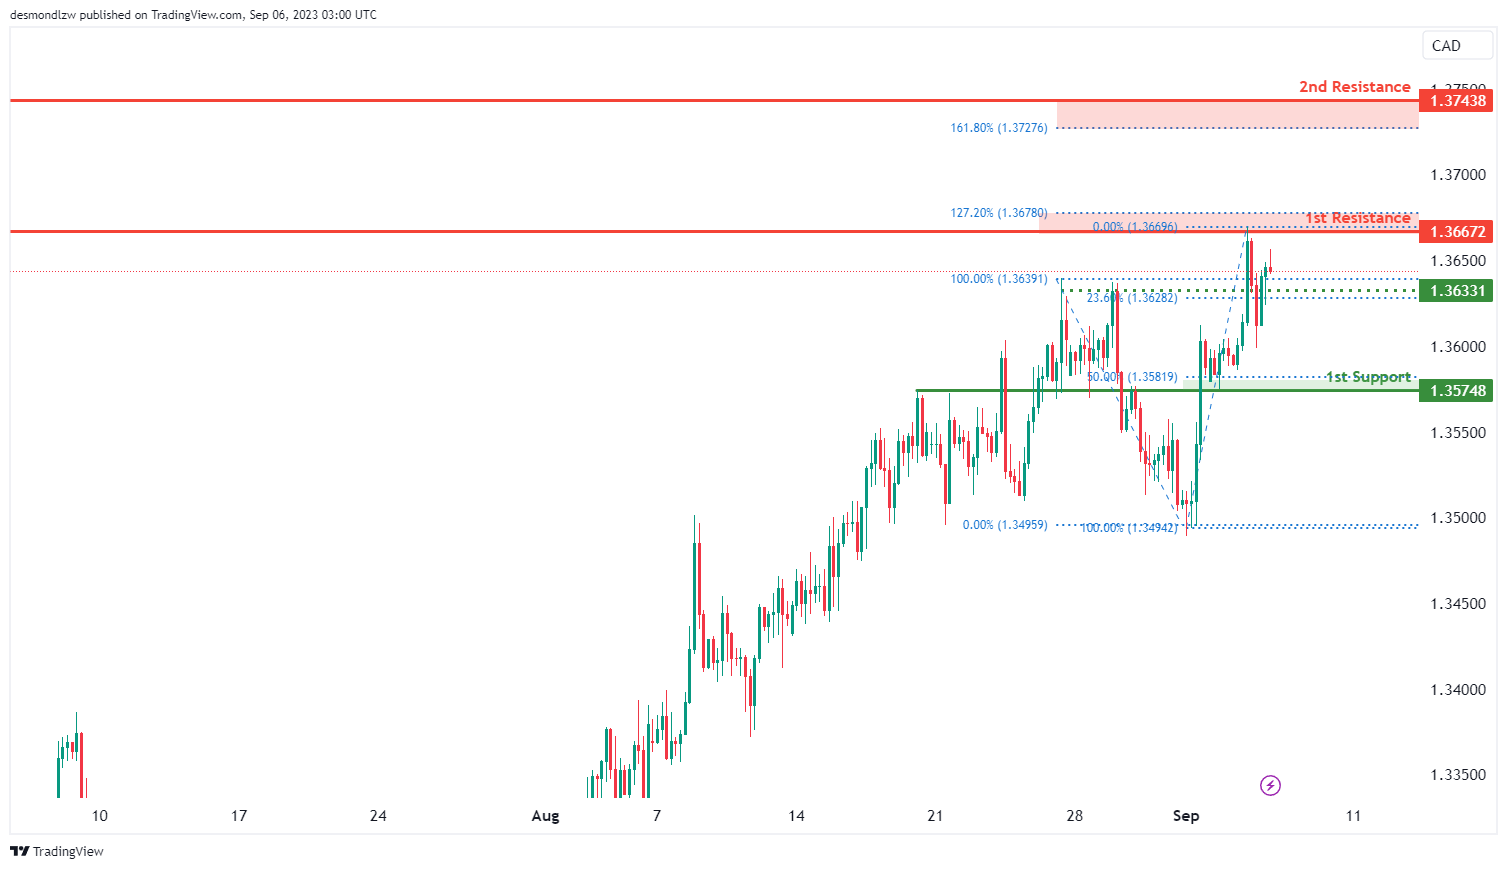
USD/CAD:
The USD/CAD chart currently demonstrates an overall bullish momentum, indicating an upward trend in its price movement. In this scenario, there is potential for a short-term drop towards the intermediate support level.
The intermediate support level at 1.3633 which is identified as a pullback support that aligns with the 23.60% Fibonacci retracement level. Further below, the 1st support level at 1.3575 is identified as an overlap support that aligns with the 50.00% Fibonacci retracement level.
To the upside, the 1st resistance level at 1.3667 is identified as a swing-high resistance that aligns with the 127.20% Fibonacci extension level. Additionally, the 2nd resistance level at 1.3744 is marked as an overlap resistance that aligns with the 161.80% Fibonacci extension level.
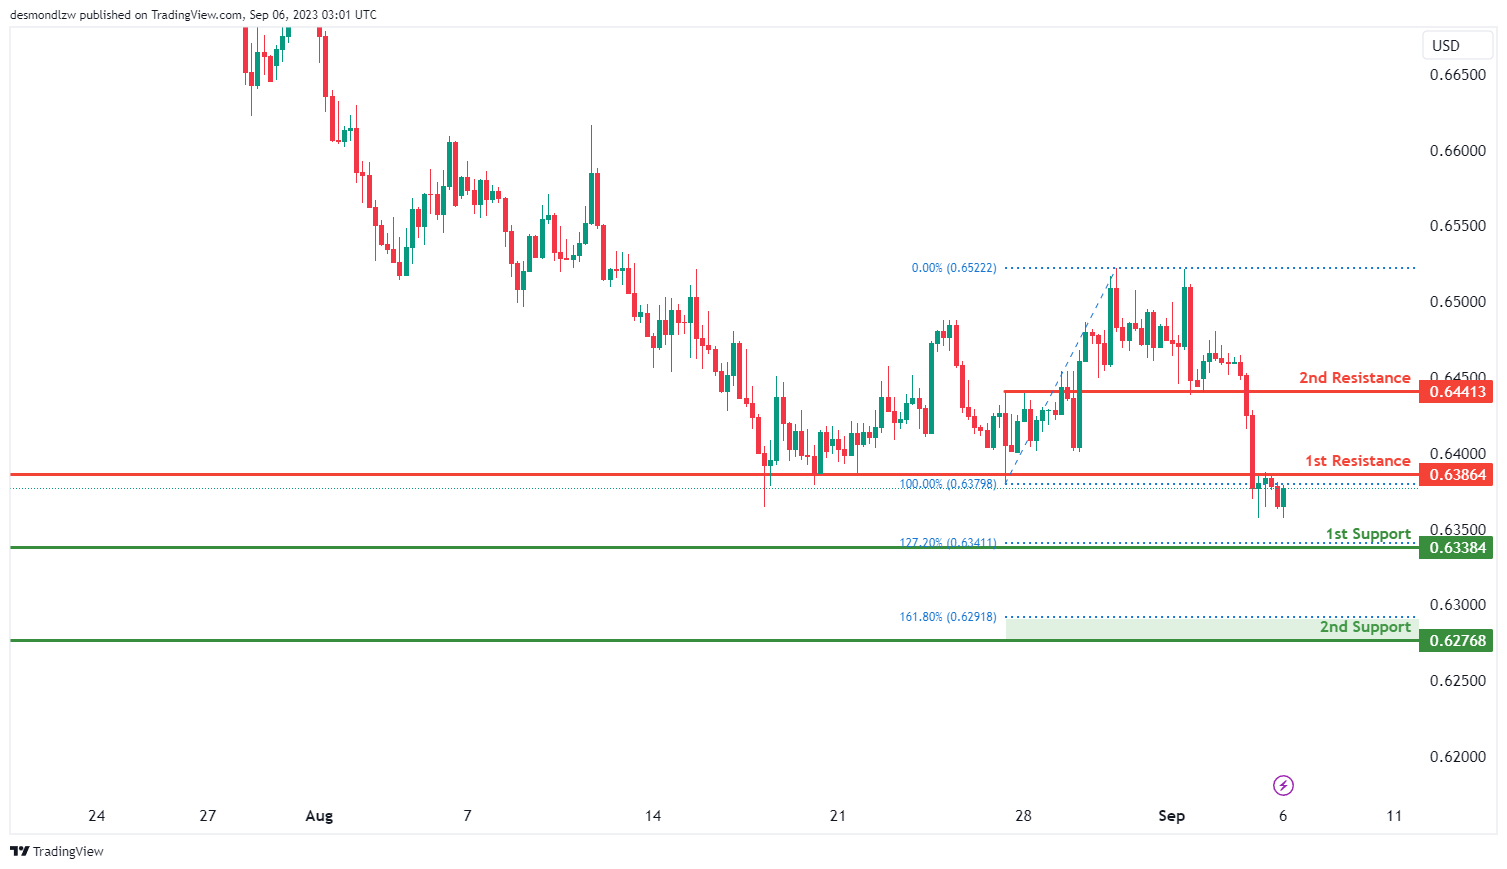
AUD/USD:
The AUD/USD chart currently exhibits an overall bearish momentum, indicating a potential downward trend in its price movement. In this scenario, there’s a likelihood of a bearish reaction occurring off the 1st resistance level at 0.6386, potentially leading to a decline towards the 1st support level.
The 1st support level at 0.6338 is identified as an overlap support that aligns with the 127.20% Fibonacci projection level. Additionally, the 2nd support level at 0.6277 is identified as a pullback support that coincides with the 161.80% Fibonacci projection level.
To the upside, the 1st resistance level at 0.6386 is marked as an overlap resistance. Similarly, the 2nd resistance level at 0.6441 is also identified as an overlap resistance, further emphasizing its potential significance as a level where price could face resistance.
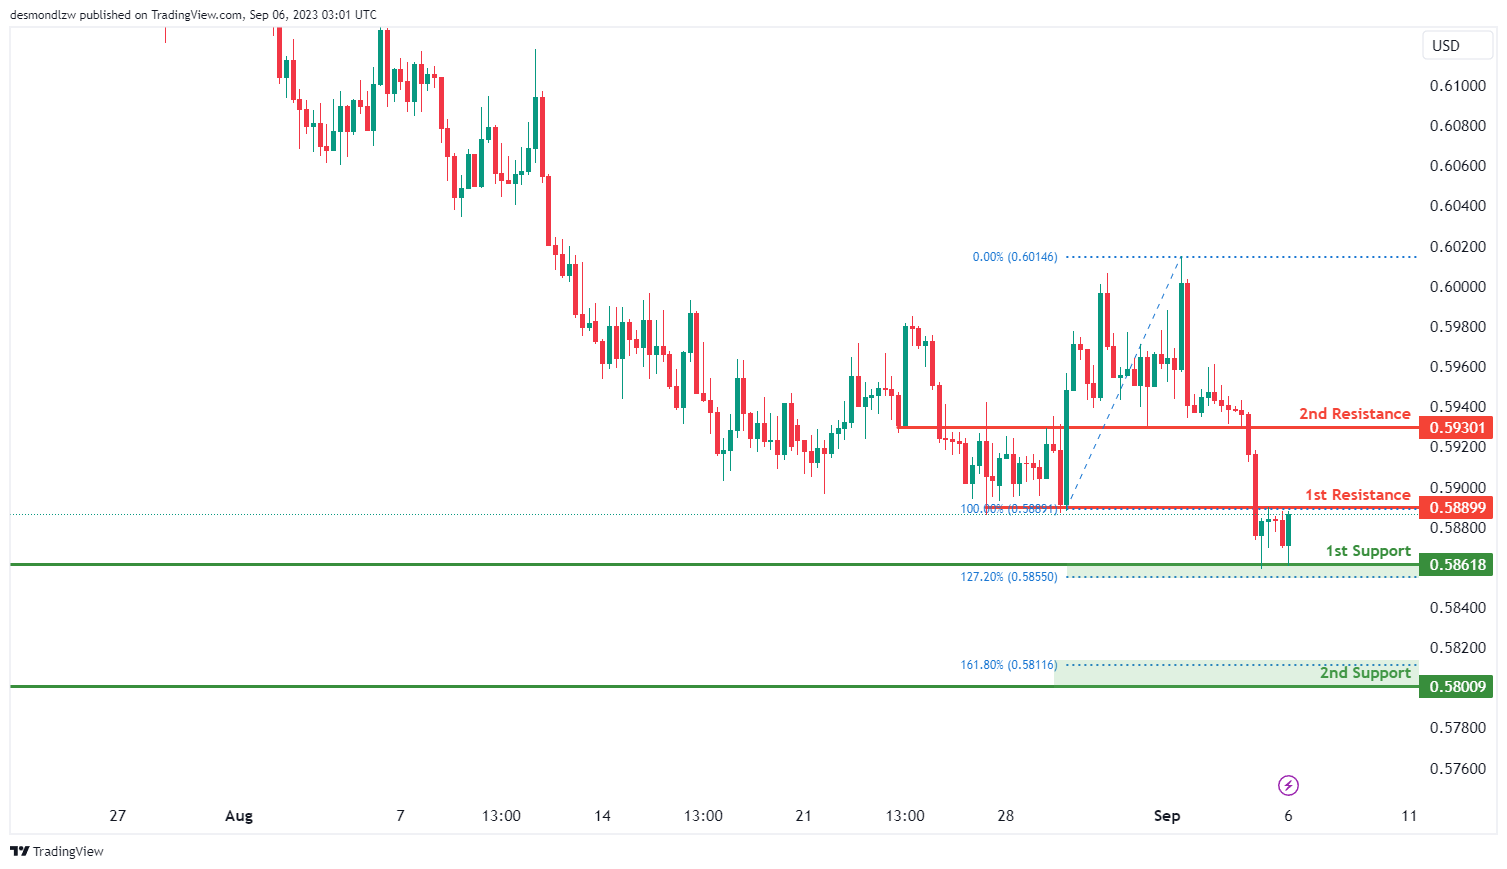
NZD/USD
The NZD/USD chart currently indicates an overall bearish momentum, suggesting a downward trend in its price movement. In this scenario, there is potential for a bearish reaction emerging from the 1st resistance level at 0.5889, leading to a possible decline towards the 1st support level.
The 1st support level at 0.5862 is identified as an overlap support that aligns with the 127.20% Fibonacci extension level. Similarly, the 2nd support level at 0.5801 is also identified as an overlap support that coincides with the 161.80% Fibonacci extension level.
To the upside, the 1st resistance level at 0.5889 is marked as an overlap resistance while the 2nd resistance level at 0.5930 is also identified as an overlap resistance, further emphasizing its potential significance as a level where price could face resistance.
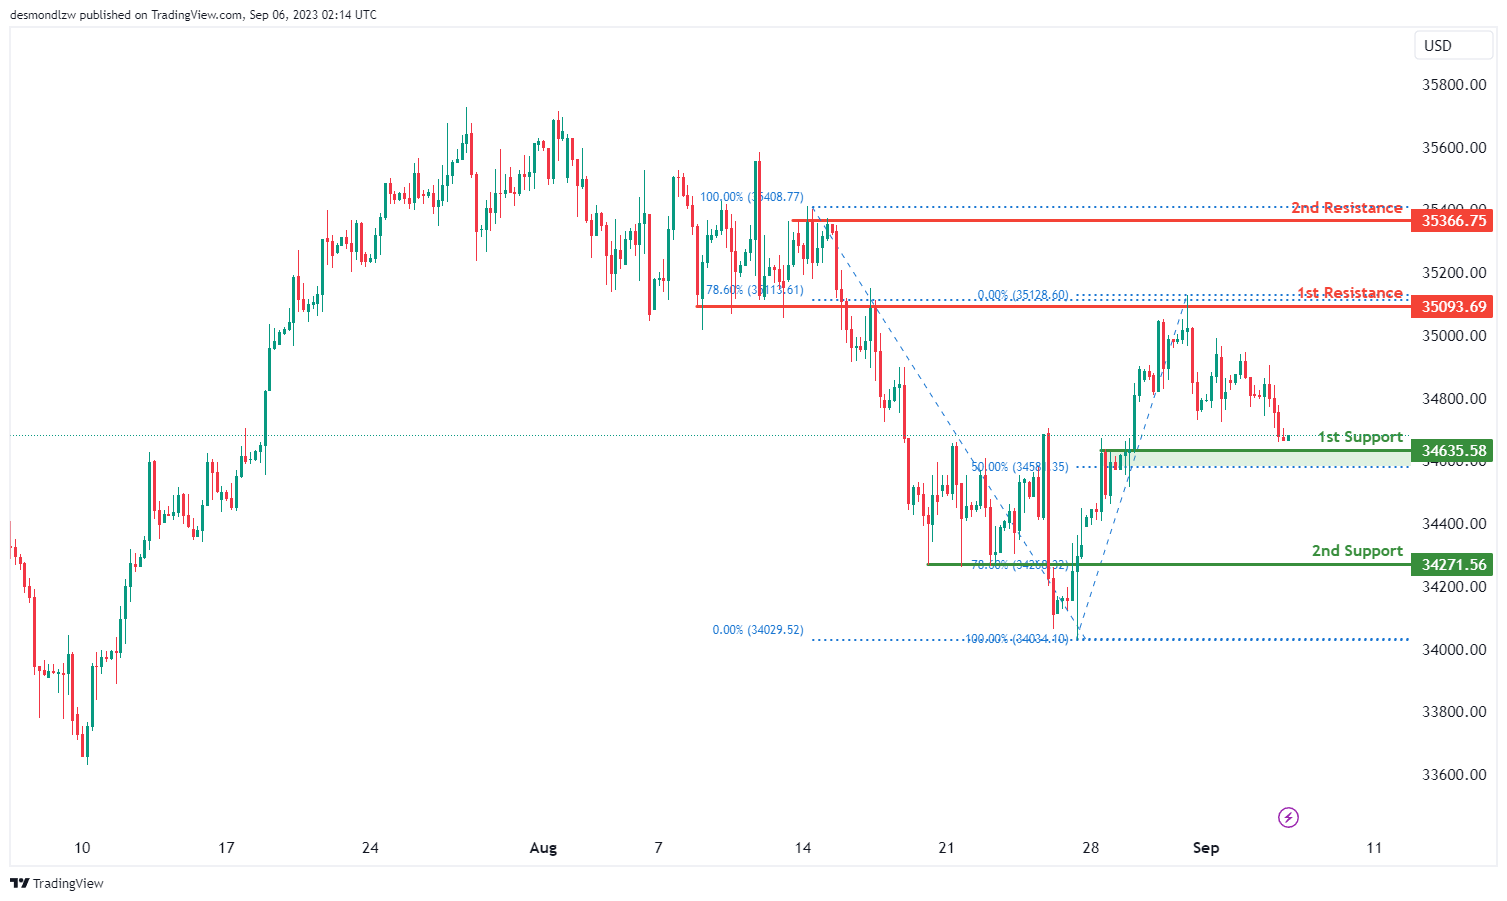
DJ30:
The instrument DJ30 currently exhibits a bullish overall momentum on the chart.
There is a potential scenario where the price could make a bullish bounce off the 1st support level at 34635.50 and subsequently move towards the 1st resistance level at 35093.60.
The 1st support level at 34635.50 is considered strong because it represents overlap support and aligns with a 50% Fibonacci Retracement.
Additionally, there is a 2nd support level at 34271.50, which is also significant as it represents pullback support and aligns with a 78.60% Fibonacci Retracement.
On the resistance side, the 1st resistance at 35093.60 is notable because it serves as overlap resistance and aligns with a 78.60% Fibonacci Retracement.
Furthermore, the 2nd resistance level at 35366.70 is considered significant as it represents multi-swing high resistance.
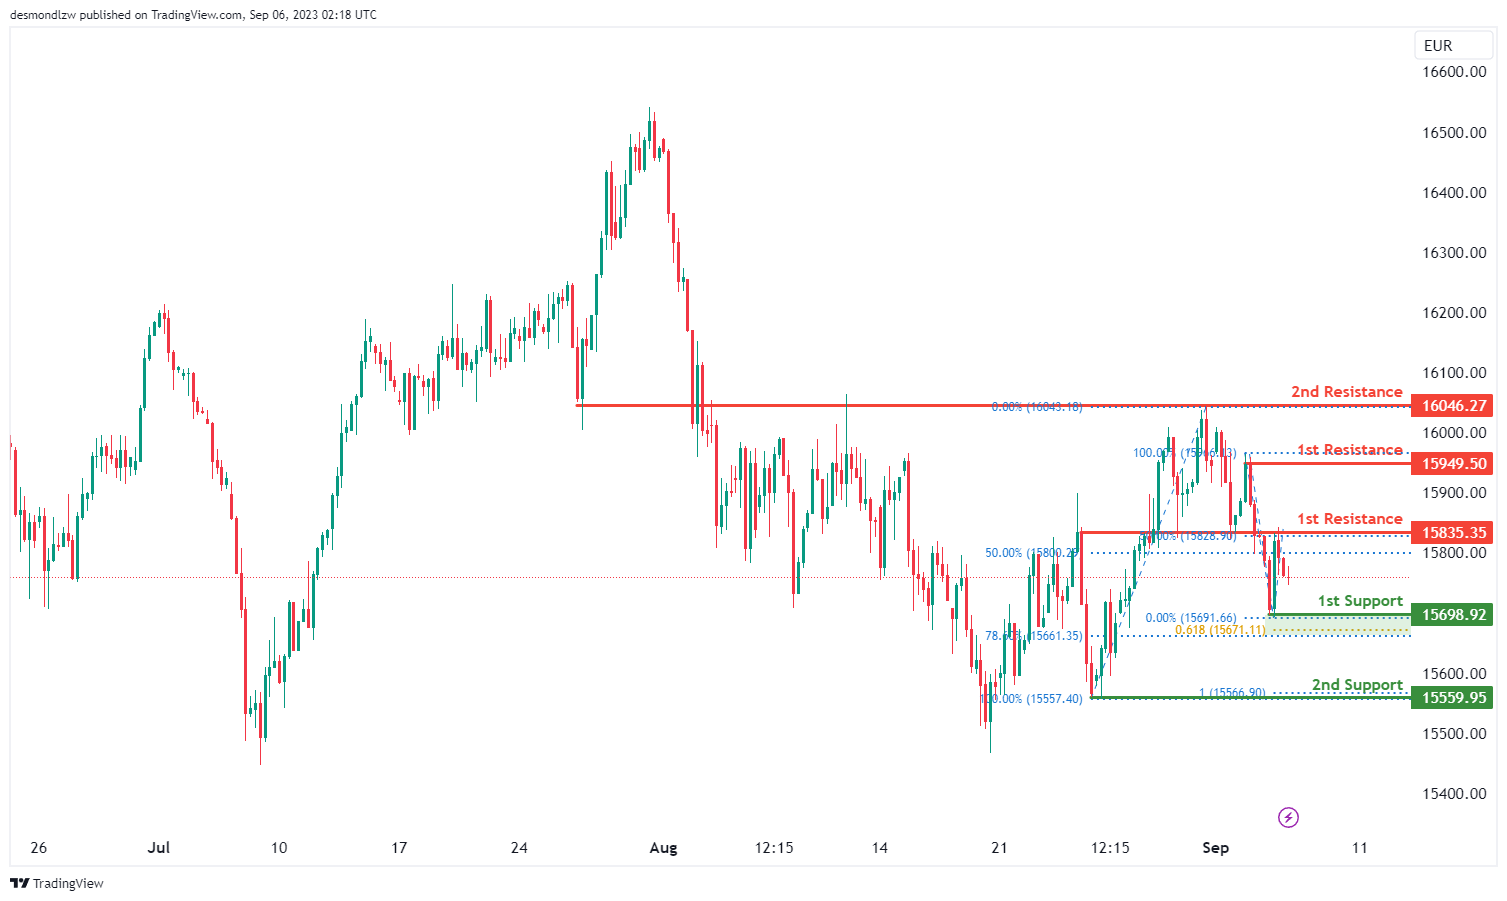
GER30:
The instrument GER30 currently reflects a bullish overall momentum on the chart.
However, there is a potential short-term scenario where the price could drop further to the 1st support level at 15698.9 before bouncing from there and subsequently rising towards the 1st resistance level at 15835.3.
The 1st support level at 15698.9 is considered strong because it represents swing low support and aligns with a 78.60% Fibonacci Retracement and a 61.80% Fibonacci Projection, indicating Fibonacci confluence.
Additionally, there is a 2nd support level at 15559.9, which is significant as it represents swing low support and aligns with a 100% Fibonacci Projection.
On the resistance side, the 1st resistance at 15835.3 is noteworthy because it serves as swing high resistance and aligns with a 50% Fibonacci Retracement.
Furthermore, the 2nd resistance level at 16046.2 is considered significant as it represents overlap resistance.
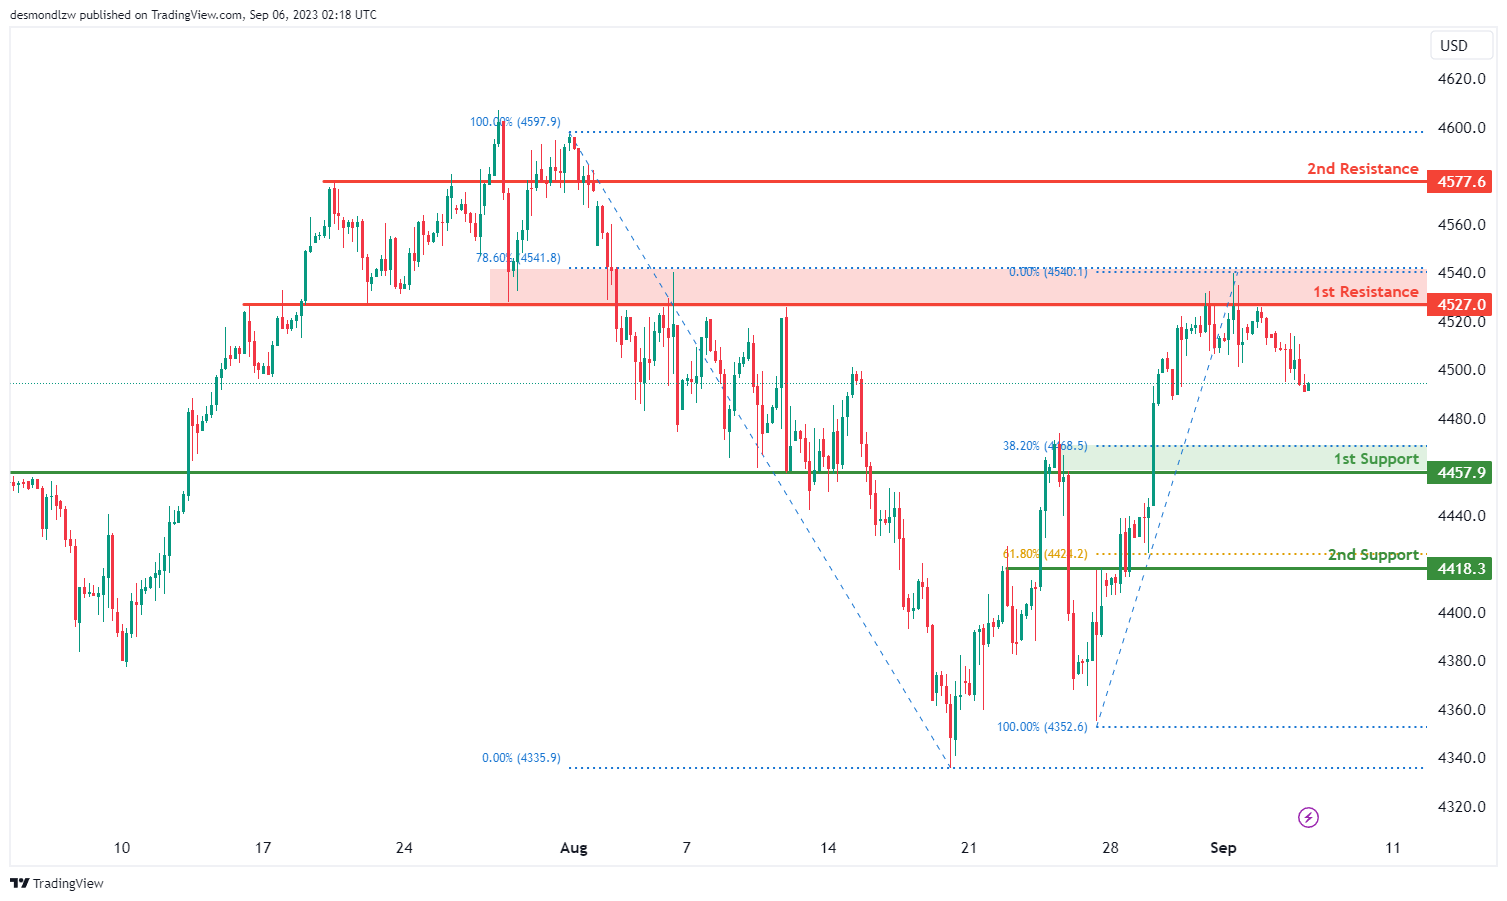
US500
The instrument US500 (S&P 500) currently demonstrates a bearish overall momentum on the chart.
There is a potential scenario where the price could continue its bearish movement towards the 1st support level at 4457.9.
The 1st support level at 4457.9 is considered strong because it represents pullback support and aligns with a 38.20% Fibonacci Retracement.
Additionally, there is a 2nd support level at 4418.3, which is also significant as it represents pullback support and aligns with a 61.80% Fibonacci Retracement.
On the resistance side, the 1st resistance at 4527.0 is noteworthy as it serves as overlap resistance and aligns with a 78.60% Fibonacci Retracement.
Furthermore, the 2nd resistance at 4577.6 is considered significant as it represents overlap resistance.
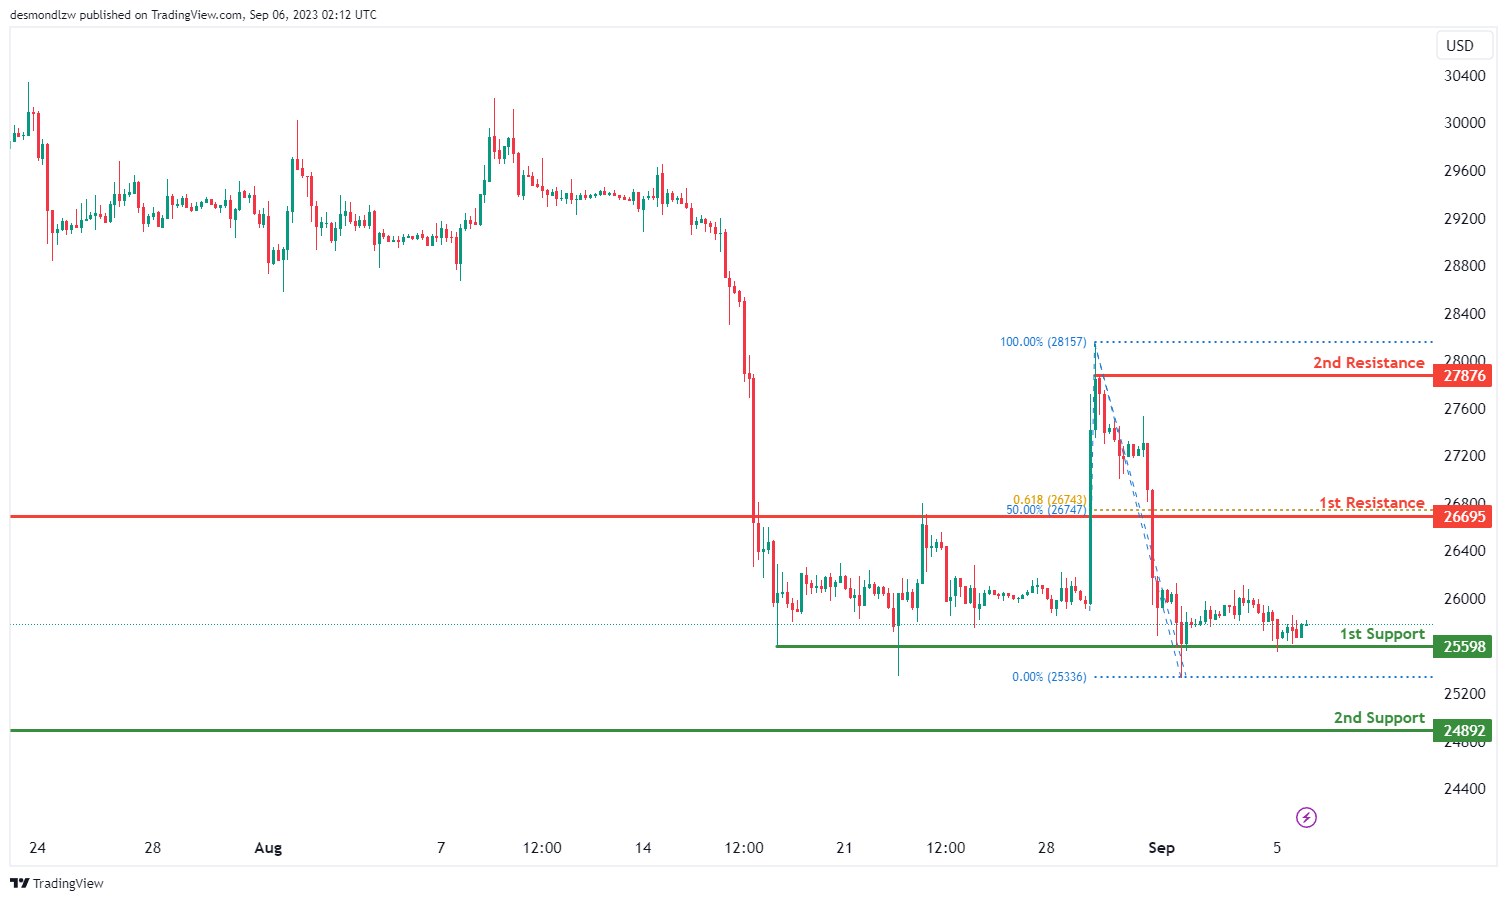
BTC/USD:
The instrument BTC/USD currently reflects a bullish overall momentum on the chart.
Price is potentially set to make a bullish move, bouncing off the 1st support level at 25598. This support level is considered good because it represents multi-swing low support.
There is also a 2nd support level at 24892, which is significant as it represents swing low support.
On the resistance side, the 1st resistance at 26695 is seen as a strong point because it serves as a pullback resistance and aligns with both a 50% Fibonacci Retracement and a 61.80% Fibonacci Projection, indicating Fibonacci confluence.
Furthermore, the 2nd resistance at 27876 is considered significant as it represents swing high resistance.
Overall, the chart suggests a bullish momentum, with the potential for a bullish bounce off the 1st support level, leading towards the 1st resistance level for BTC/USD.
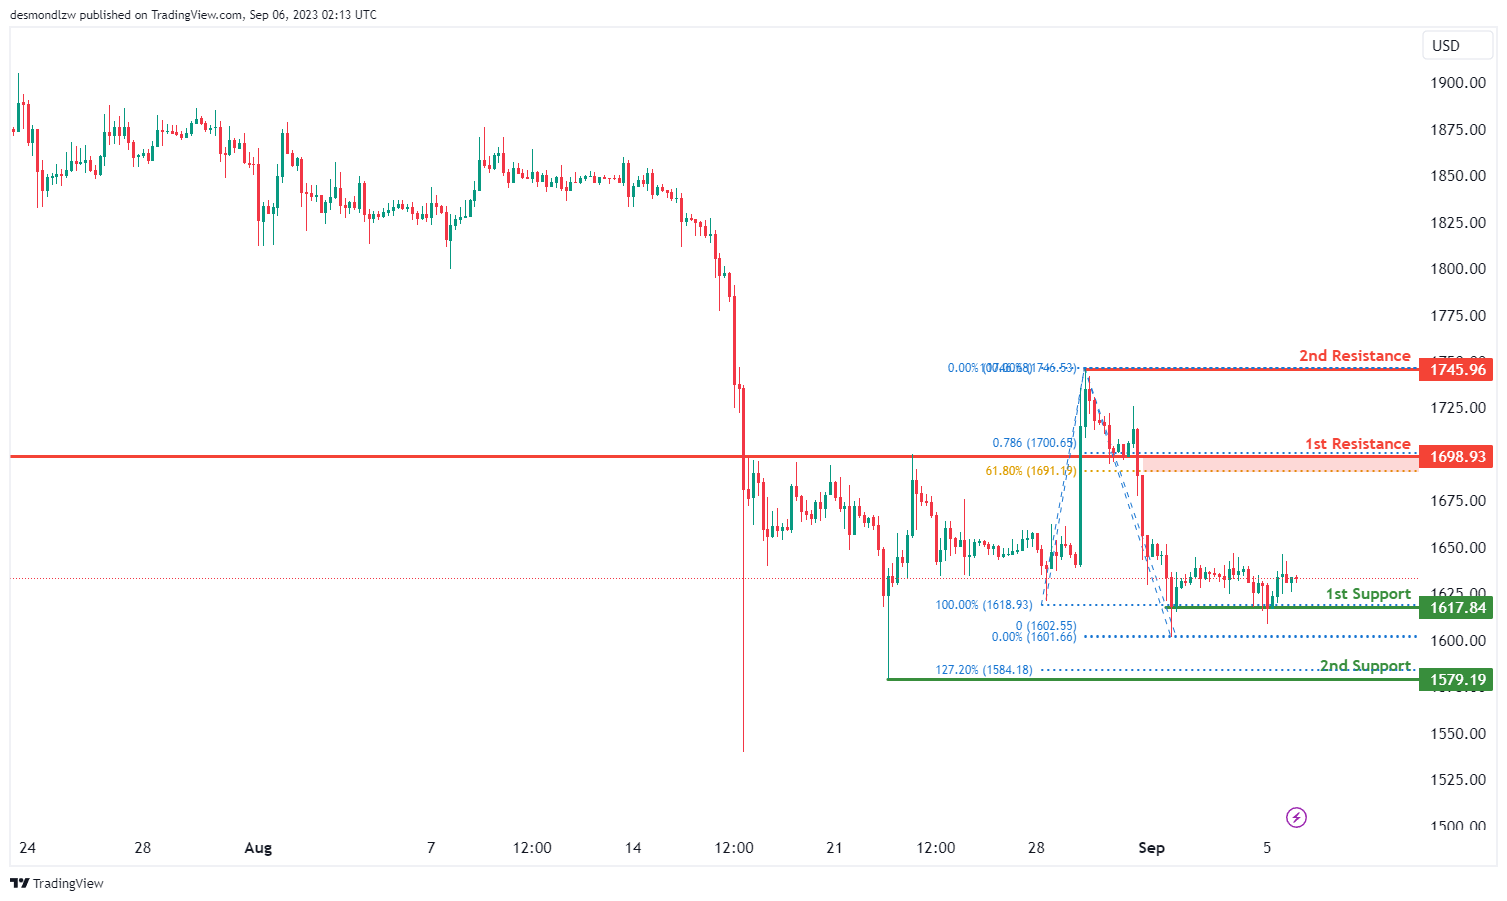
ETH/USD:
The instrument ETH/USD currently demonstrates a bullish overall momentum on the chart.
There’s a potential scenario where the price could make a bullish move by bouncing off the 1st support level at 1617.84. This support level is considered strong because it represents multi-swing low support.
Additionally, there is a 2nd support level at 1579.19, which is significant as it represents swing low support and aligns with a 127.20% Fibonacci Extension.
On the resistance side, the 1st resistance at 1698.93 is notable as it serves as a pullback resistance and aligns with both a 61.80% Fibonacci Retracement and a 78.60% Fibonacci Projection, indicating Fibonacci confluence.
Furthermore, the 2nd resistance at 1745.96 is considered significant as it represents swing high resistance.
Overall, the chart suggests a bullish momentum, with the potential for a bullish bounce off the 1st support level, leading towards the 1st resistance level for ETH/USD.
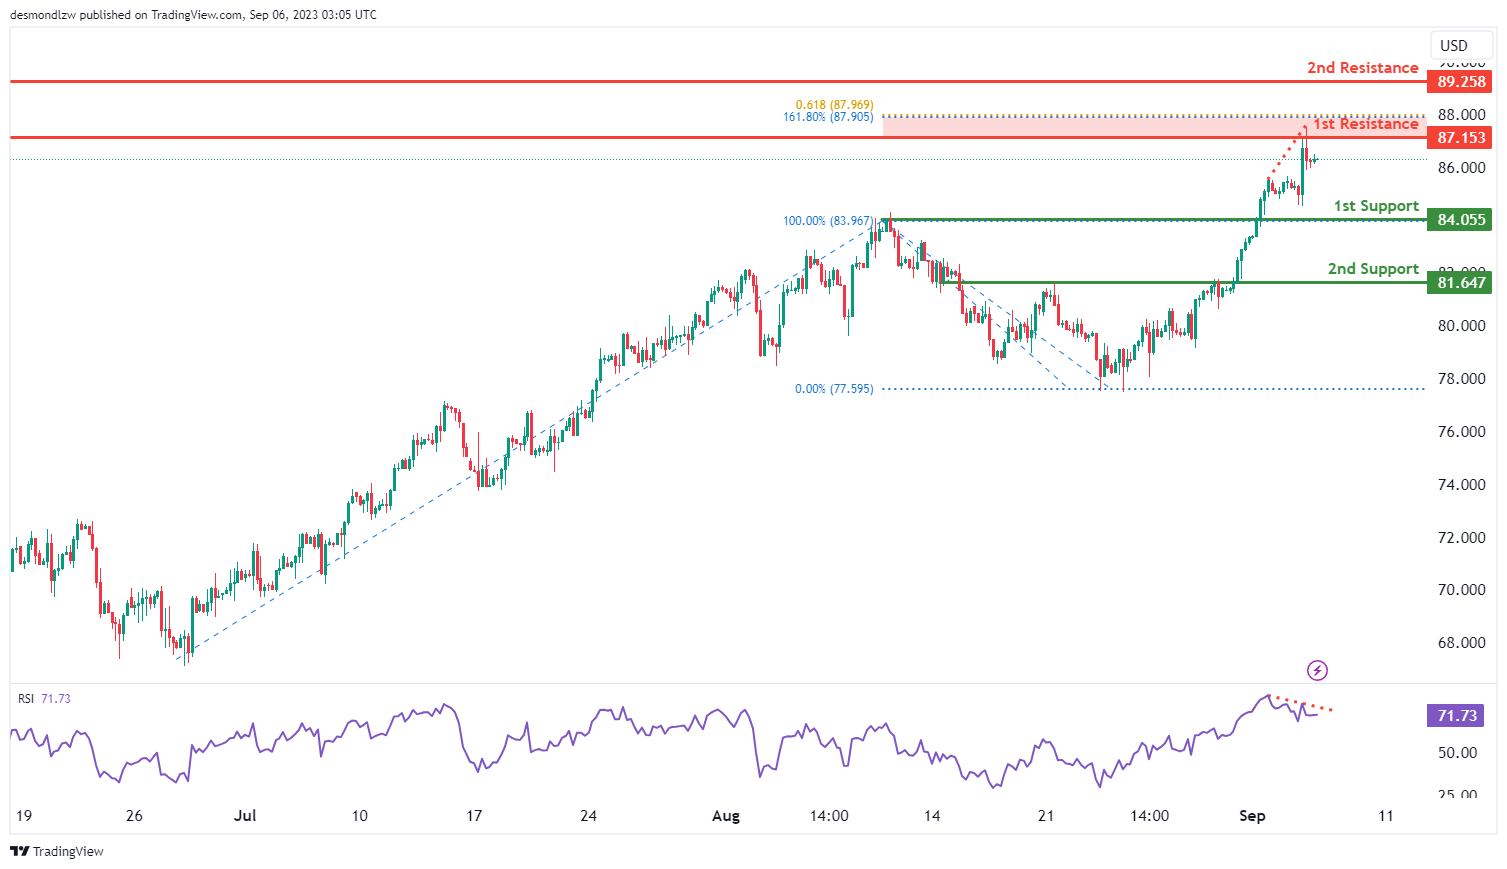
WTI/USD:
The WTI chart currently exhibits an overall bullish momentum, indicating an upward trend in its price movement. Within this context, there’s potential for the price to experience a bullish continuation towards the 1st resistance level at 87.15.
The 1st resistance level at 87.15 is identified as an overlap resistance that aligns with a confluence of Fibonacci levels i.e. the 161.80% extension and the 61.80% projection levels. Furthermore, the 2nd resistance level at 89.26 is also identified as an overlap resistance.
To the downside, the 1st support level at 84.06 is identified as a pullback support while the 2nd support level at 81.65 is identified as an overlap support.
It is also important to note that the Relative Strength Index (RSI) is displaying bearish divergence compared to the price. This divergence suggests the possibility of a reversal occurring soon, which should be considered when evaluating the overall bullish momentum.
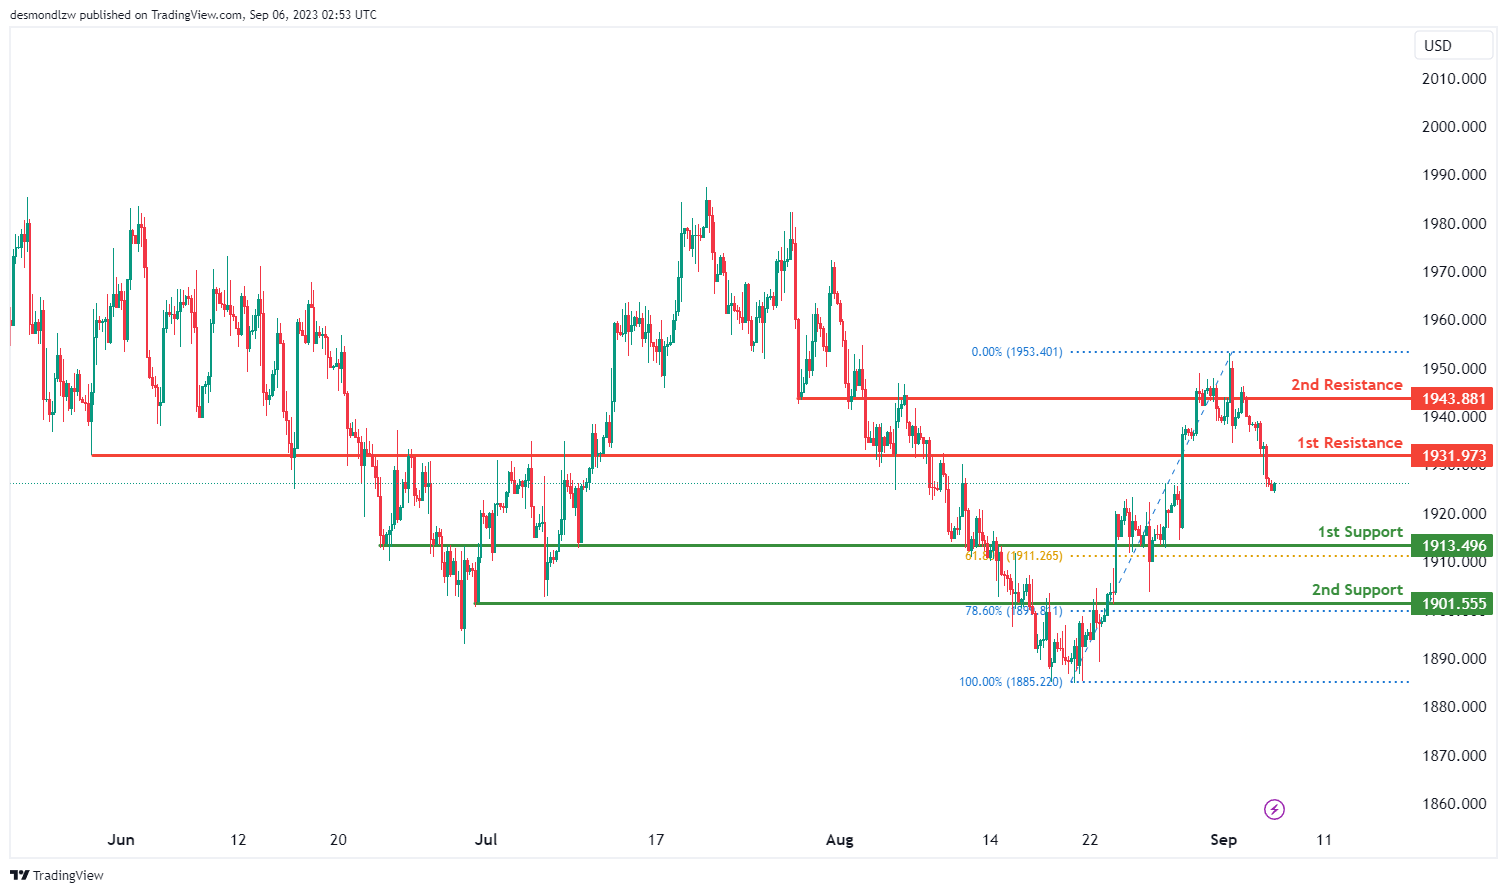
XAU/USD (GOLD):
The XAU/USD chart currently displays a bearish overall momentum, indicating a potential downward trend in price movement.
There’s a likelihood of a bearish continuation towards the 1st support level at 1913.49, which is identified as an overlap support, particularly aligned with the 61.80% Fibonacci Retracement.
The 2nd support level at 1901.55 is also noted as an overlap support, and it aligns with the 78.60% Fibonacci Retracement, reinforcing its importance as a potential area of price support.
On the resistance side, the 1st resistance at 1931.97 is considered a pullback resistance, while the 2nd resistance at 1943.88 is marked as an overlap resistance. These levels may act as barriers to any potential bullish movements.


