
DXY:
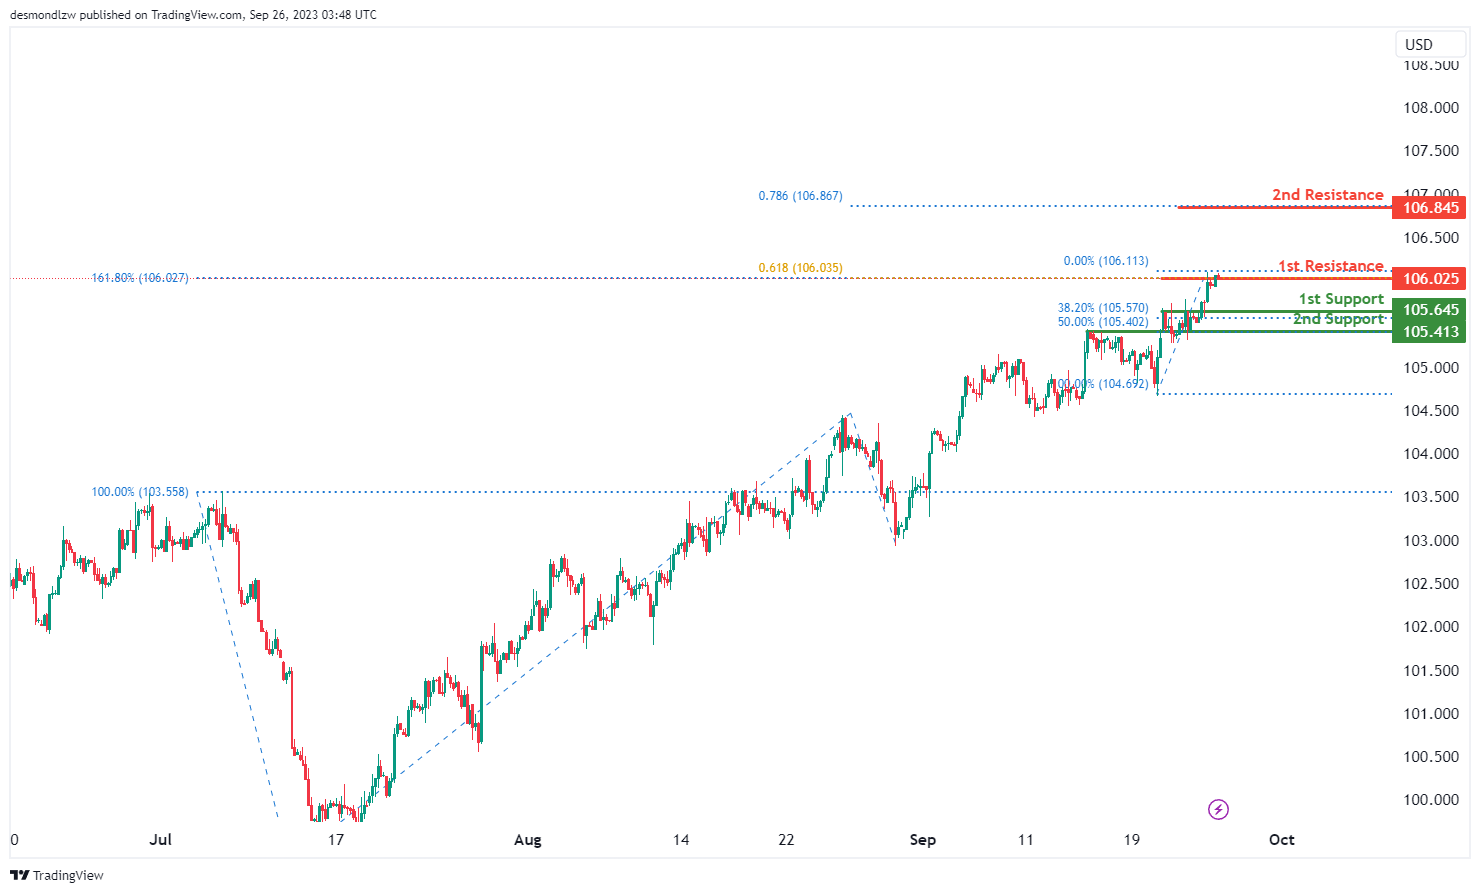
The DXY chart currently exhibits a bearish momentum. There’s a possibility for a bearish reaction off the 1st resistance at 106.02, leading to a drop towards the 1st support at 105.64. This 1st support is significant due to its characterization as an overlap support and the presence of the 38.20% Fibonacci Retracement. The 2nd support is at 105.41, another overlap support, reinforced by the 50% Fibonacci Retracement.
In terms of resistance, the 1st resistance at 106.02 is notable for its Fibonacci confluence, being at the intersection of the 61.80% Fibonacci Projection and the 161.80% Fibonacci Extension. The 2nd resistance is set at 106.84, marked by the 78.60% Fibonacci Projection.
EUR/USD:
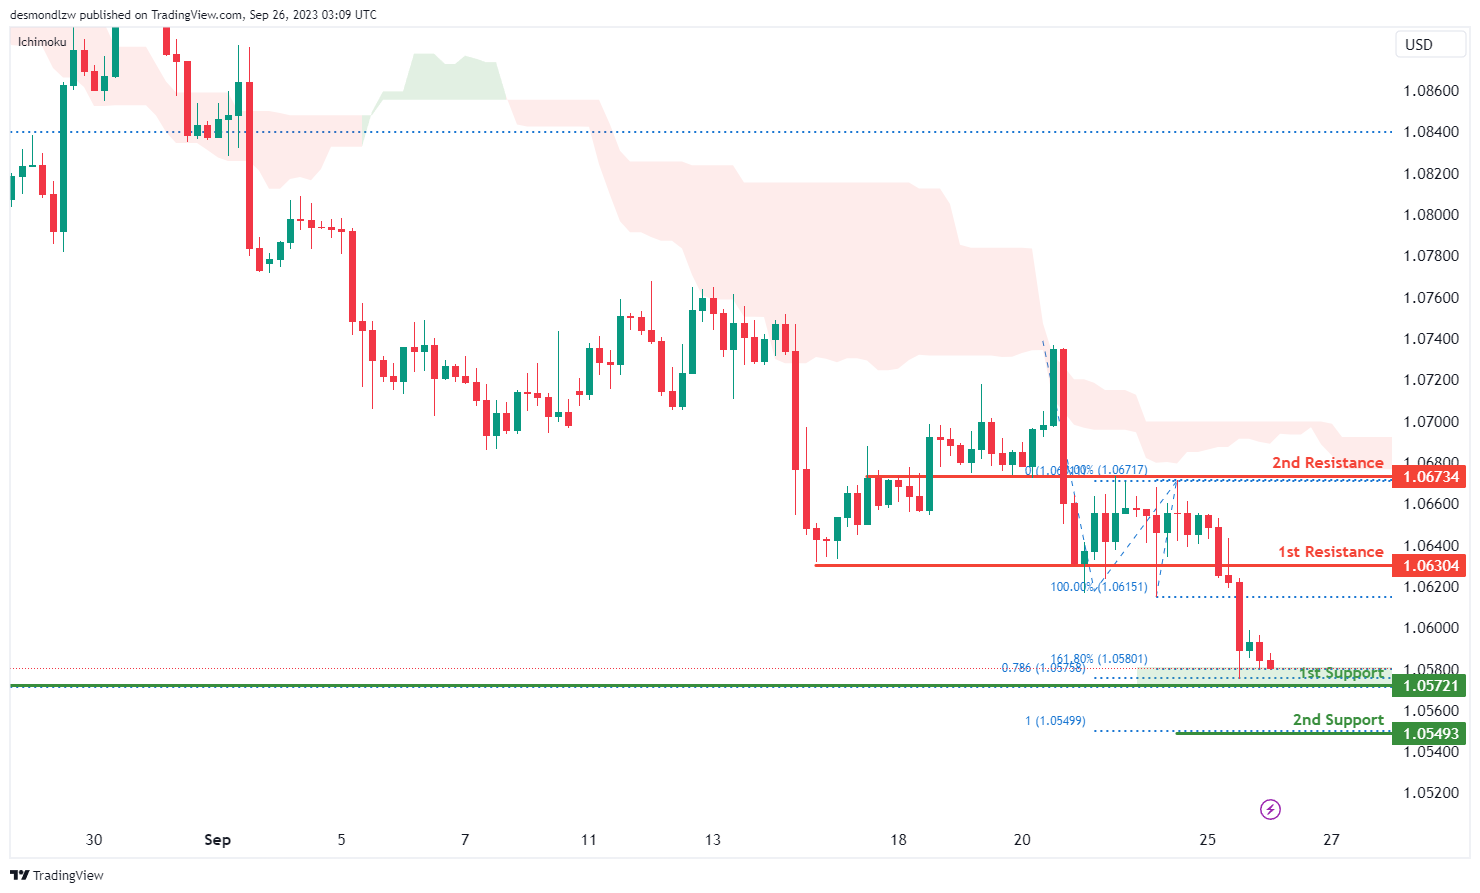
The EUR/USD chart is currently displaying a bullish momentum. There’s a potential scenario where the price may make a bullish bounce from the 1st support level at 1.0572 and move towards the 1st resistance at 1.0630. This 1st support level is especially significant due to its characterization as a multi-swing low support and the confluence of the 161.80% Fibonacci Extension and 78.60% Fibonacci Projection. The 2nd support at 1.0549 is marked by the 100% Fibonacci Projection.
On the resistance side, the 1st resistance at 1.0630 is defined as a pullback resistance. The 2nd resistance level at 1.0673 is characterized as an overlap resistance, making it another key level to watch.
EUR/JPY:
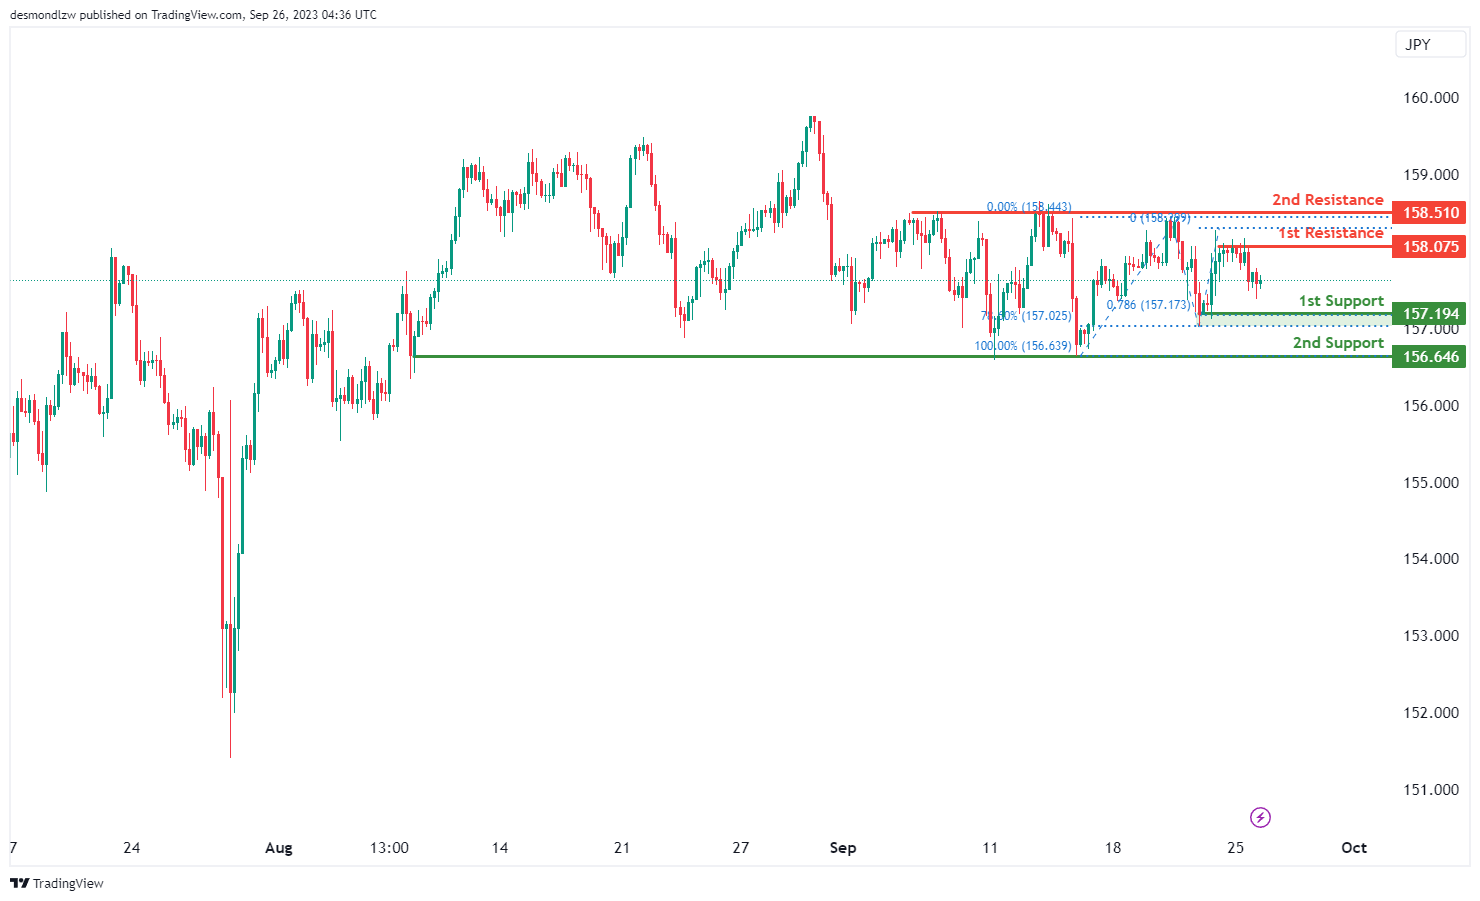
The instrument EUR/JPY currently shows a bearish overall momentum on the chart, and there’s potential for a bearish continuation towards the 1st support.
The 1st support at 157.91 is considered good due to its nature as a swing low support and its association with the 78.60% Fibonacci Projection.
The 2nd support at 156.64 is also notable as it acts as a swing low support, providing an additional layer of potential support.
On the resistance side, we have the 1st resistance at 158.07, which is significant because it represents a multi-swing high resistance.
Similarly, the 2nd resistance at 158.51 is noteworthy as it functions as another multi-swing high resistance, suggesting potential barriers to further bullish movement at these levels and supporting the idea of a bearish continuation towards the 1st support.
EUR/GBP:
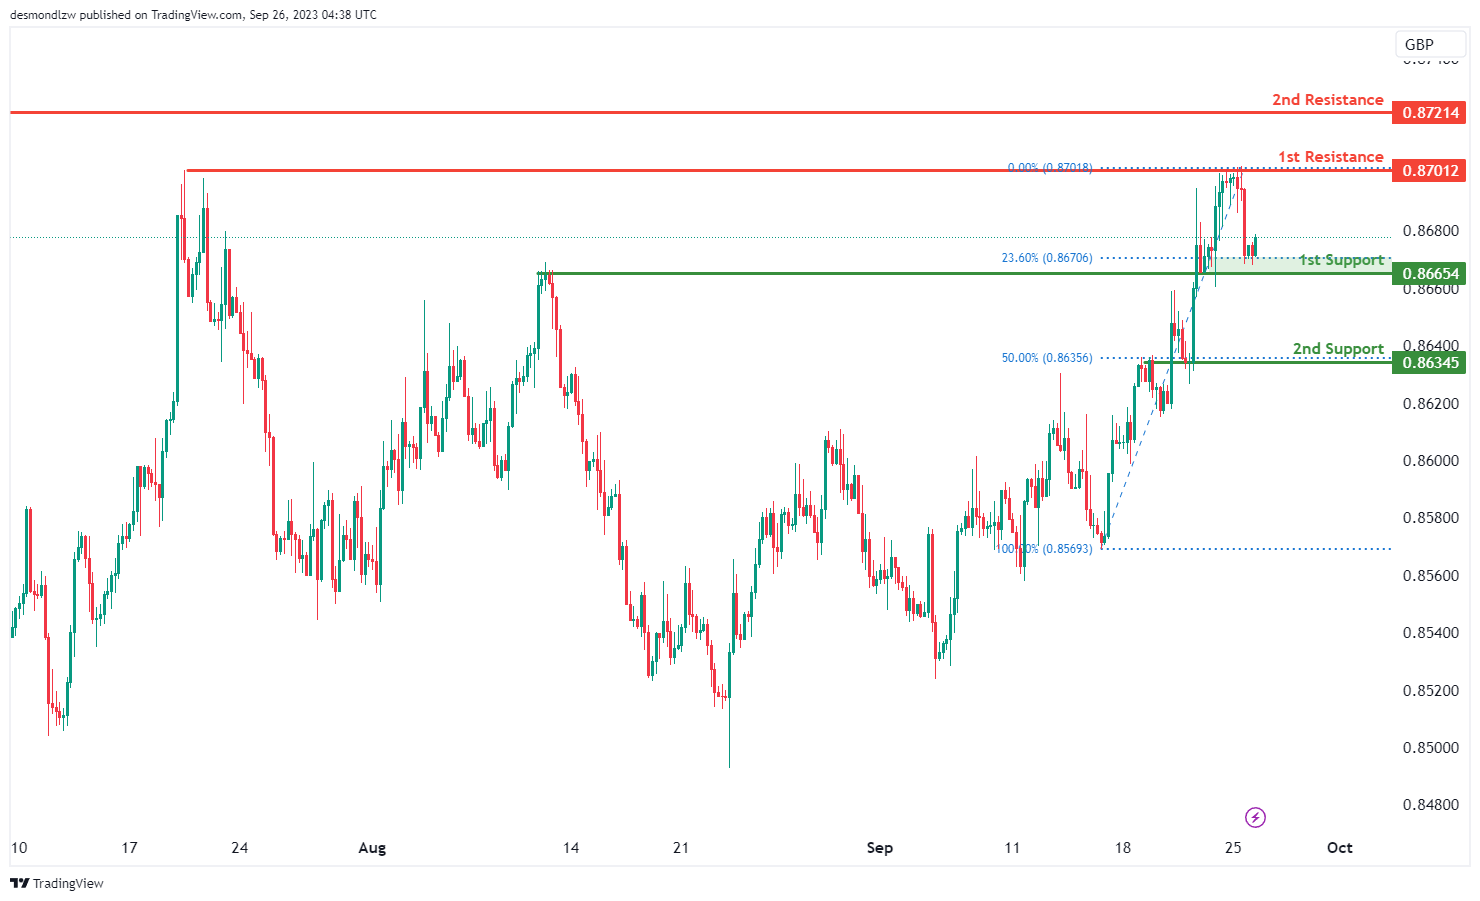
The instrument EUR/GBP currently indicates a bullish overall momentum on the chart, and there’s potential for a bullish continuation towards the 1st resistance.
The 1st support at 0.8665 is considered good due to its nature as an overlap support and its association with the 23.60% Fibonacci Retracement.
The 2nd support at 0.8634 is also notable as it acts as an overlap support and is associated with the 50% Fibonacci Retracement, providing an additional layer of potential support.
On the resistance side, we have the 1st resistance at 0.8701, which is significant because it represents a multi-swing high resistance.
Similarly, the 2nd resistance at 0.8721 is noteworthy as it functions as an overlap resistance.
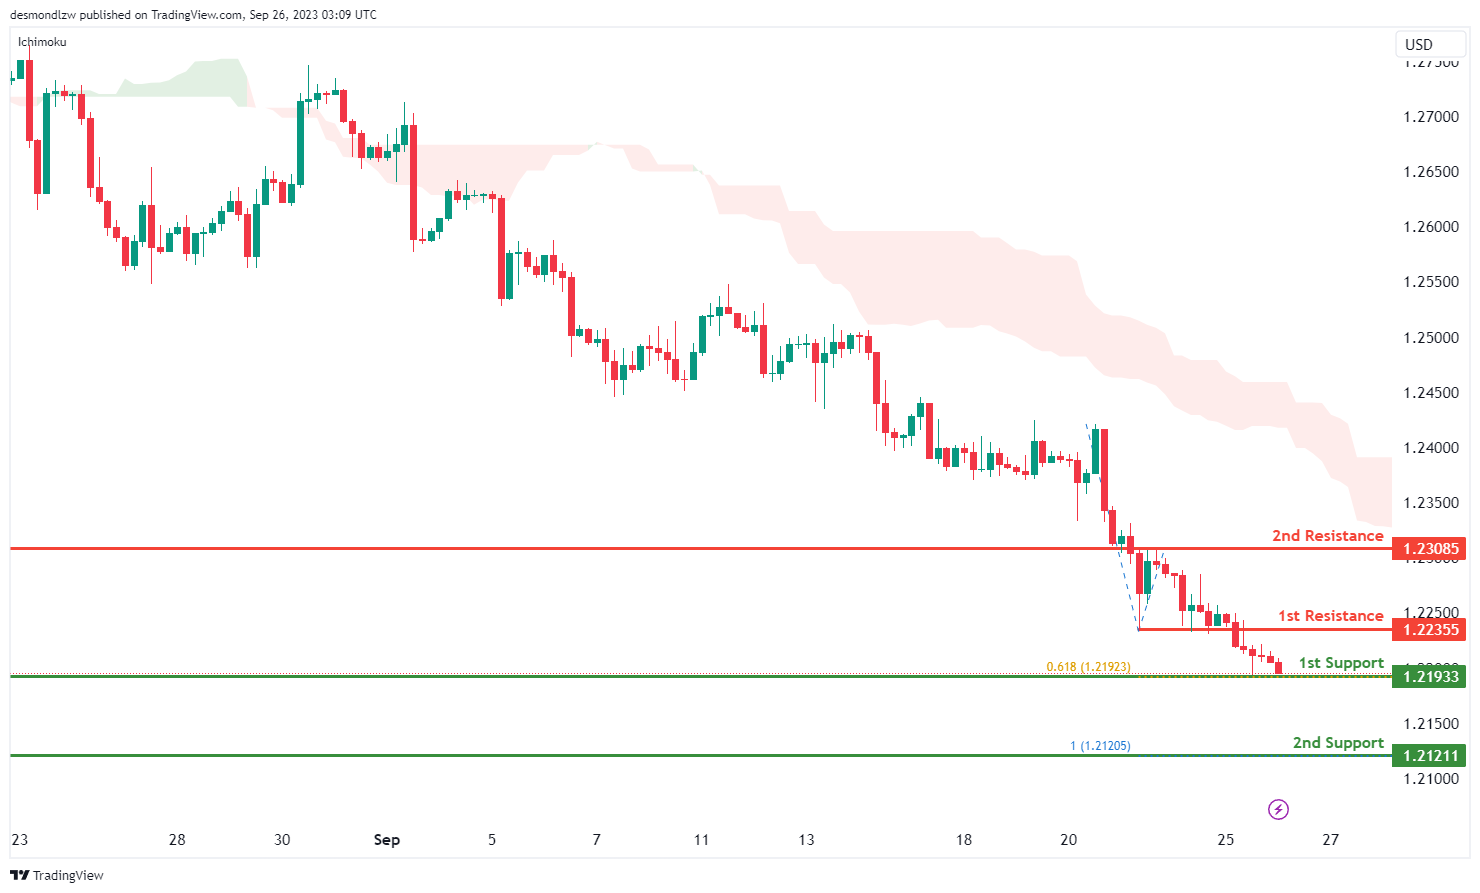
GBP/USD:
The GBP/USD chart currently indicates a bearish momentum, influenced by the price being below the bearish Ichimoku cloud. In the short term, the price might rise towards the 1st resistance level at 1.2235 before potentially reversing and declining to the 1st support at 1.2193. This support level is significant due to its characterization as an overlap support and its association with the 61.80% Fibonacci Projection.
The 2nd support at 1.2121 stands out as a swing low support and is marked by the 100% Fibonacci Projection.
On the resistance side, both the 1st resistance at 1.2235 and the 2nd resistance at 1.2308 are identified as overlap resistances, indicating potential barriers for price increases.
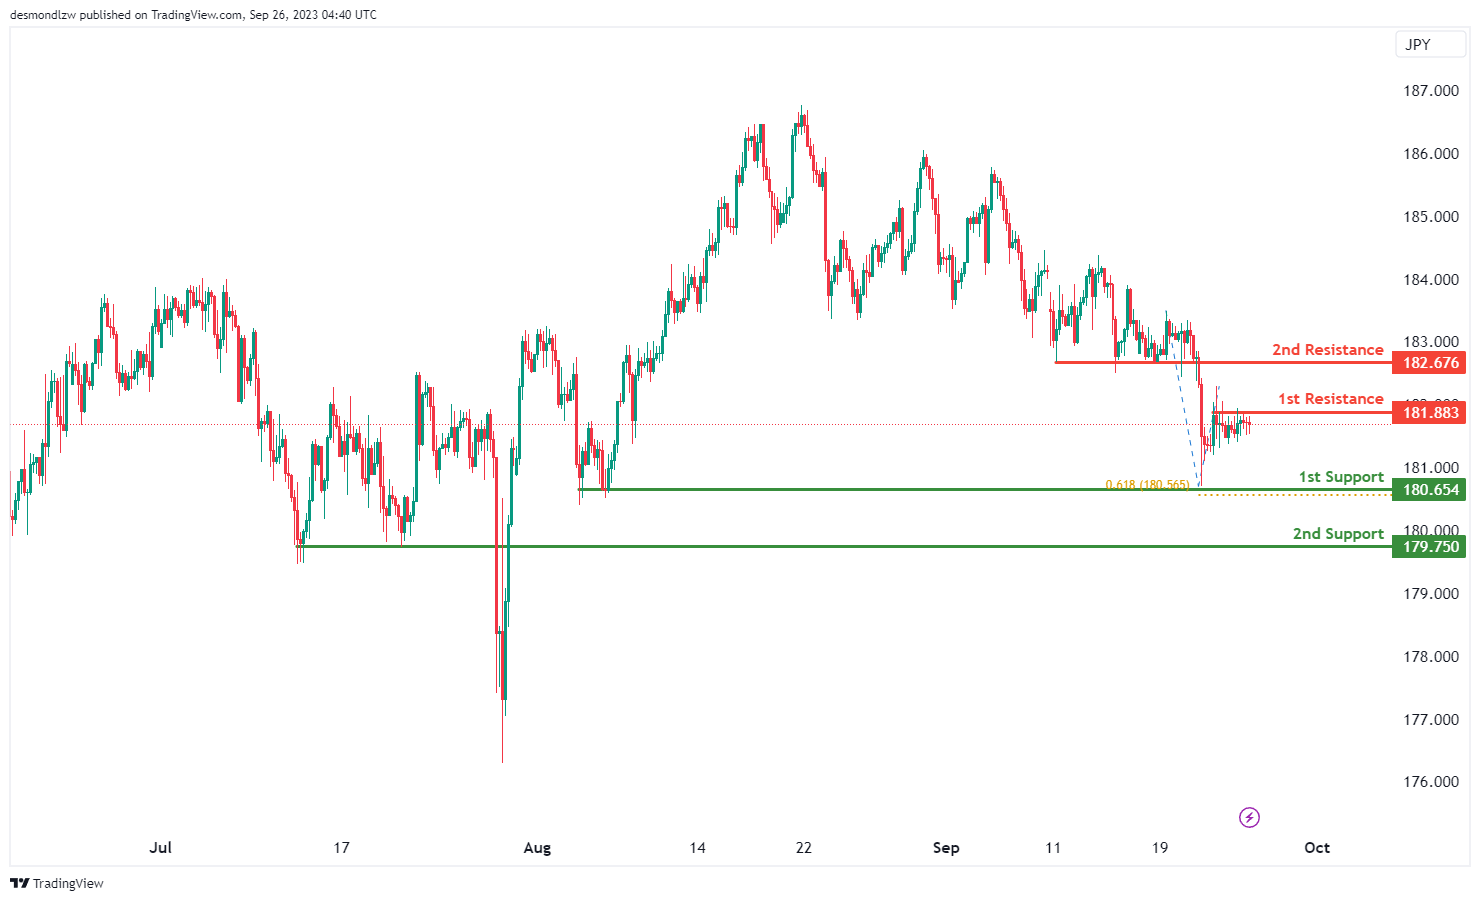
GBP/JPY:
The instrument GBP/JPY currently indicates a bearish overall momentum on the chart, and there’s potential for a bearish reaction off the 1st resistance and a drop towards the 1st support.
The 1st support at 180.65 is considered good due to its nature as a multi-swing low support. Additionally, it is associated with the 61.80% Fibonacci Projection, providing strong potential support.
The 2nd support at 179.75 is also notable as it acts as a pullback support, potentially adding to the support level.
On the resistance side, we have the 1st resistance at 181.88, which is significant because it represents a multi-swing high resistance.
Similarly, the 2nd resistance at 182.67 is noteworthy as it functions as a pullback resistance.
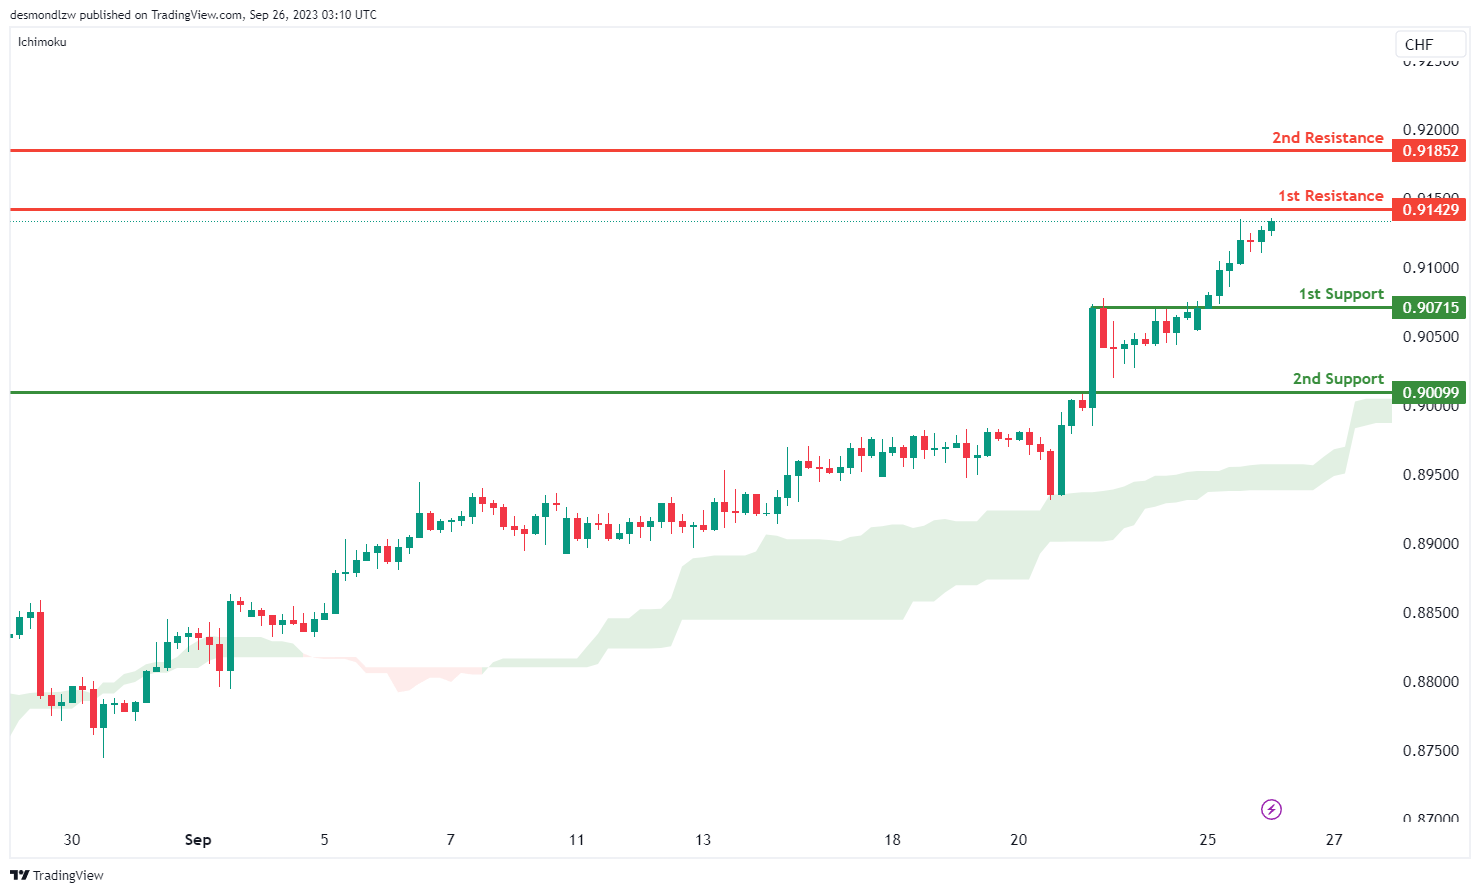
USD/CHF:
The USD/CHF chart currently demonstrates a bearish momentum. There’s a potential scenario where the price might react bearishly off the 1st resistance level at 0.9042, characterized as a swing high resistance, and decline towards the 1st support at 0.9071, which is identified as an overlap support.
The 2nd support level is at 0.9009 and is notable for being a pullback support, indicating historical levels where price has found support.
On the resistance side, beyond the 1st resistance, the 2nd resistance level is at 0.9185 and is characterized as a pullback resistance, suggesting it could act as a significant barrier for any bullish movements.
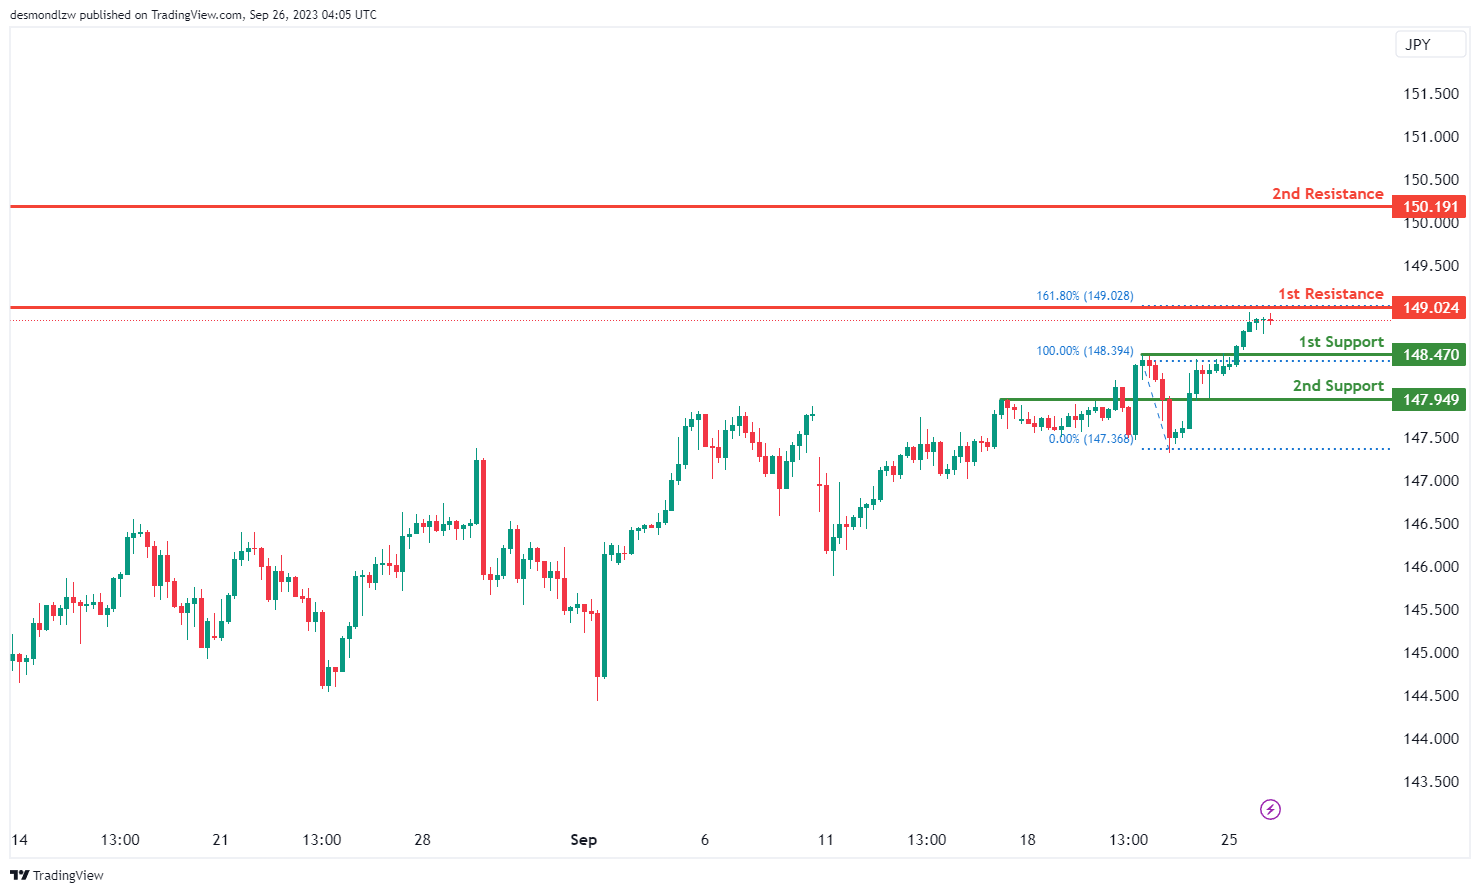
USD/JPY:
The USD/JPY chart is currently showing a bearish trend. In the upcoming sessions, there’s a possibility that the price might experience a bearish reaction upon reaching the 1st resistance level at 149.02, which is defined by a swing high resistance and the 161.80% Fibonacci Extension. If this resistance holds, the price could then decline towards the 1st support level at 148.47, characterized as a pullback support.
The 2nd support level, positioned at 147.94, is recognized as an overlap support, marking it as another potential area where the price might find support.
On the resistance side, beyond the 1st resistance, the 2nd resistance is situated at 150.19, also categorized as a swing high resistance, indicating its potential significance in halting any bullish advancements.
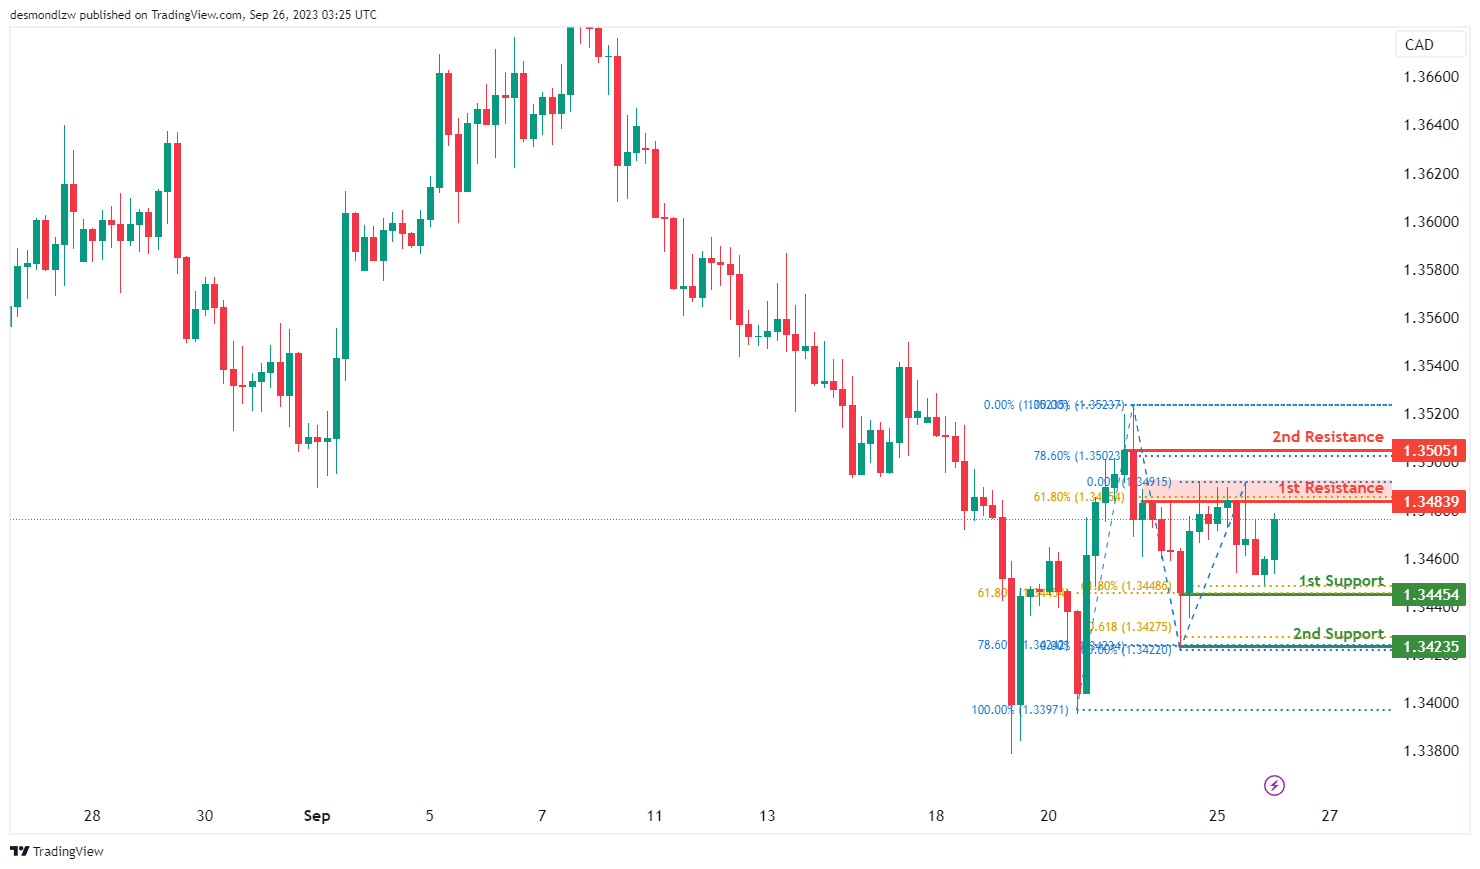
USD/CAD:
The chart for USD/CAD is currently indicating an overall bullish momentum. In this scenario, there is a potential for a bullish continuation towards the 1st resistance level.
The 1st resistance level at 1.3484 is identified as a pullback resistance that aligns with the 61.80% Fibonacci retracement level. Additionally, the 2nd resistance level at 1.3505 is marked as a swing-high resistance that aligns with the 78.60% Fibonacci retracement level.
To the downside, the 1st support level at 1.3445 is identified as a pullback support that aligns with a confluence of Fibonacci levels i.e. two distinct 61.80% retracement levels. Further below, the 2nd support level at 1.3424 is noted as a swing-low support that also aligns with a confluence of Fibonacci levels i.e. the 78.60% retracement and the 61.80% projection levels.
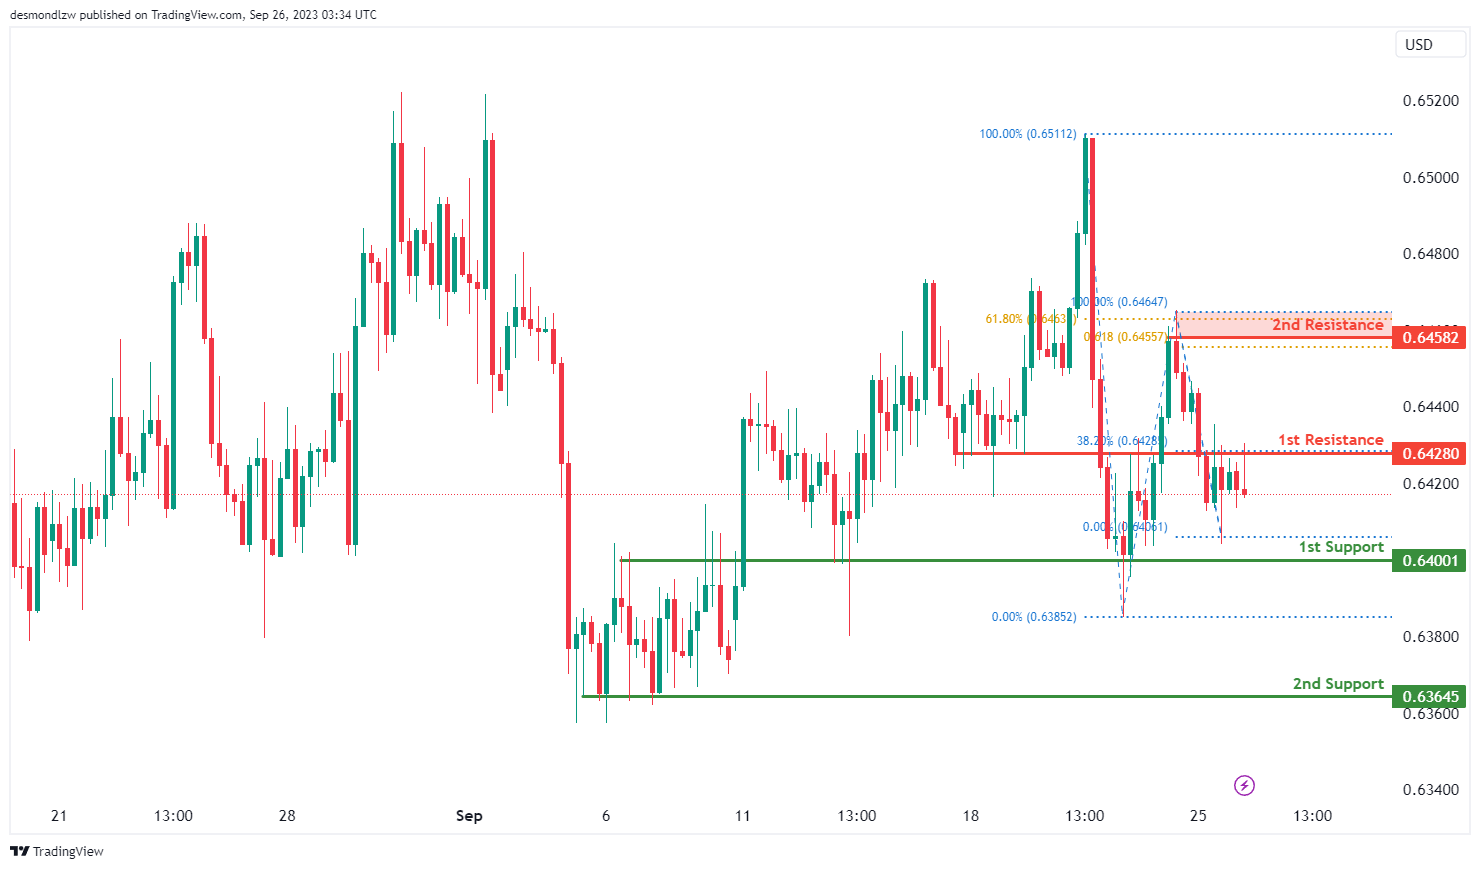
AUD/USD:
The AUD/USD chart is currently displaying an overall neutral momentum, suggesting that price may range-bound or oscillate between the 1st support and the1st resistance levels.
The 1st support level at 0.6400 is identified as an overlap support while the 2nd support level at 0.6365 is noted as a pullback support, suggesting a potential strong support level in the past.
To the upside, the 1st resistance level at 0.6428 is identified as an overlap resistance that aligns with the 38.20% Fibonacci retracement level. Further up, the 2nd resistance level at 0.6458 is marked as a swing-high resistance that aligns with a confluence of Fibonacci levels i.e. the 61.80% retracement and the 61.80% projection levels.
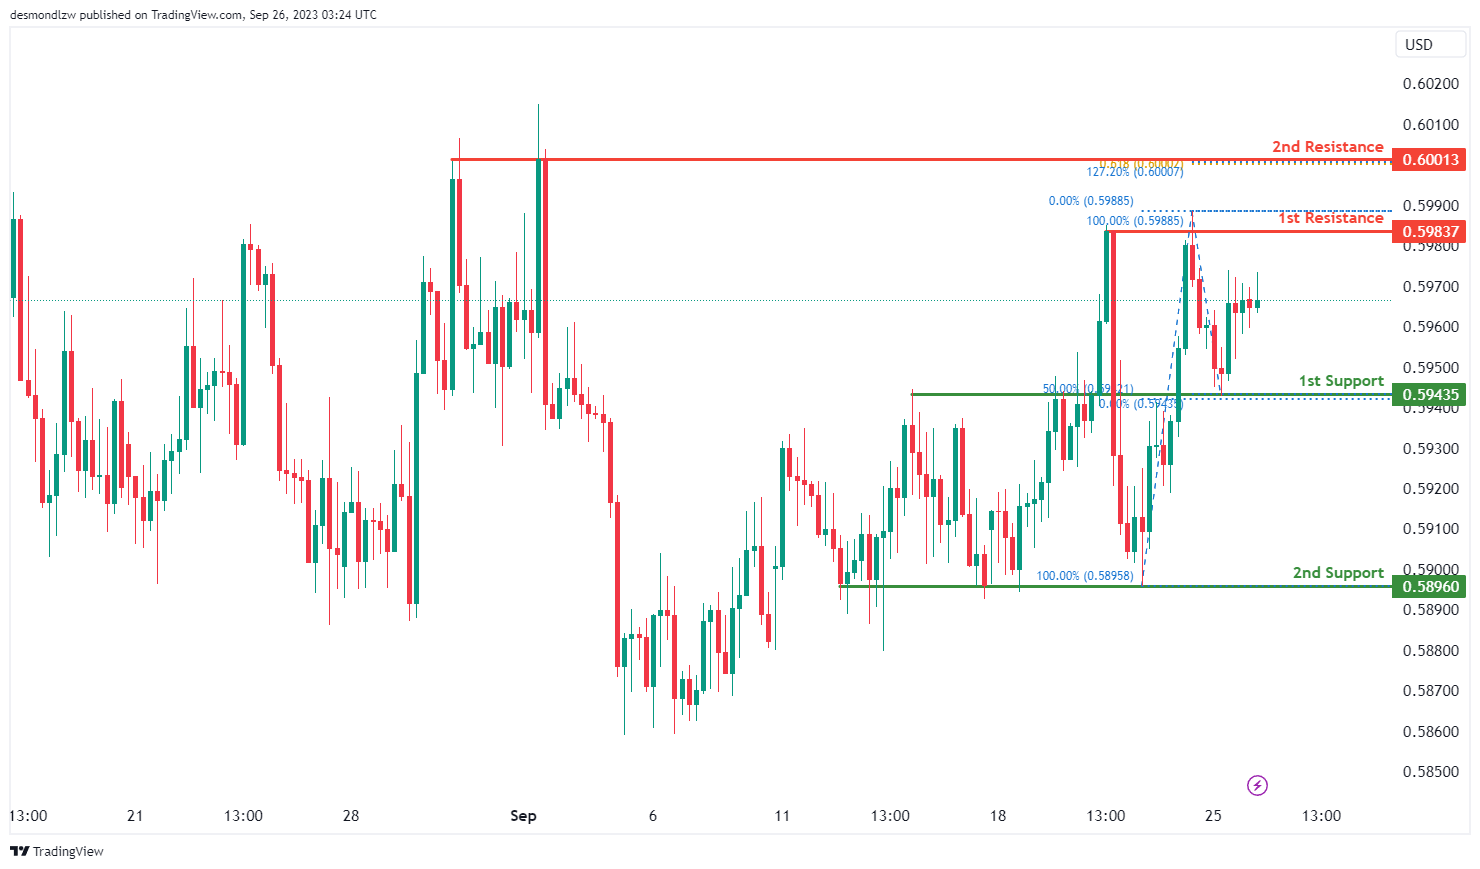
NZD/USD
The NZD/USD chart is currently showing an overall neutral momentum, suggesting that the price may consolidate or move within the 1st support and the 1st resistance levels.
The 1st support level at 0.5944 is identified as an overlap support that aligns with the 50.00% Fibonacci retracement level. Additionally, the 2nd support level at 0.5896 is marked as a pullback support which could potentially act as a major support zone.
To the upside, the 1st resistance level at 0.5984 is identified as a multi-swing-high resistance. Further up, the 2nd resistance level at 0.6001 is also marked as a multi-swing-high resistance that coincides with a confluence of Fibonacci levels i.e. the 127.20% extension and the 61.80% projection levels.
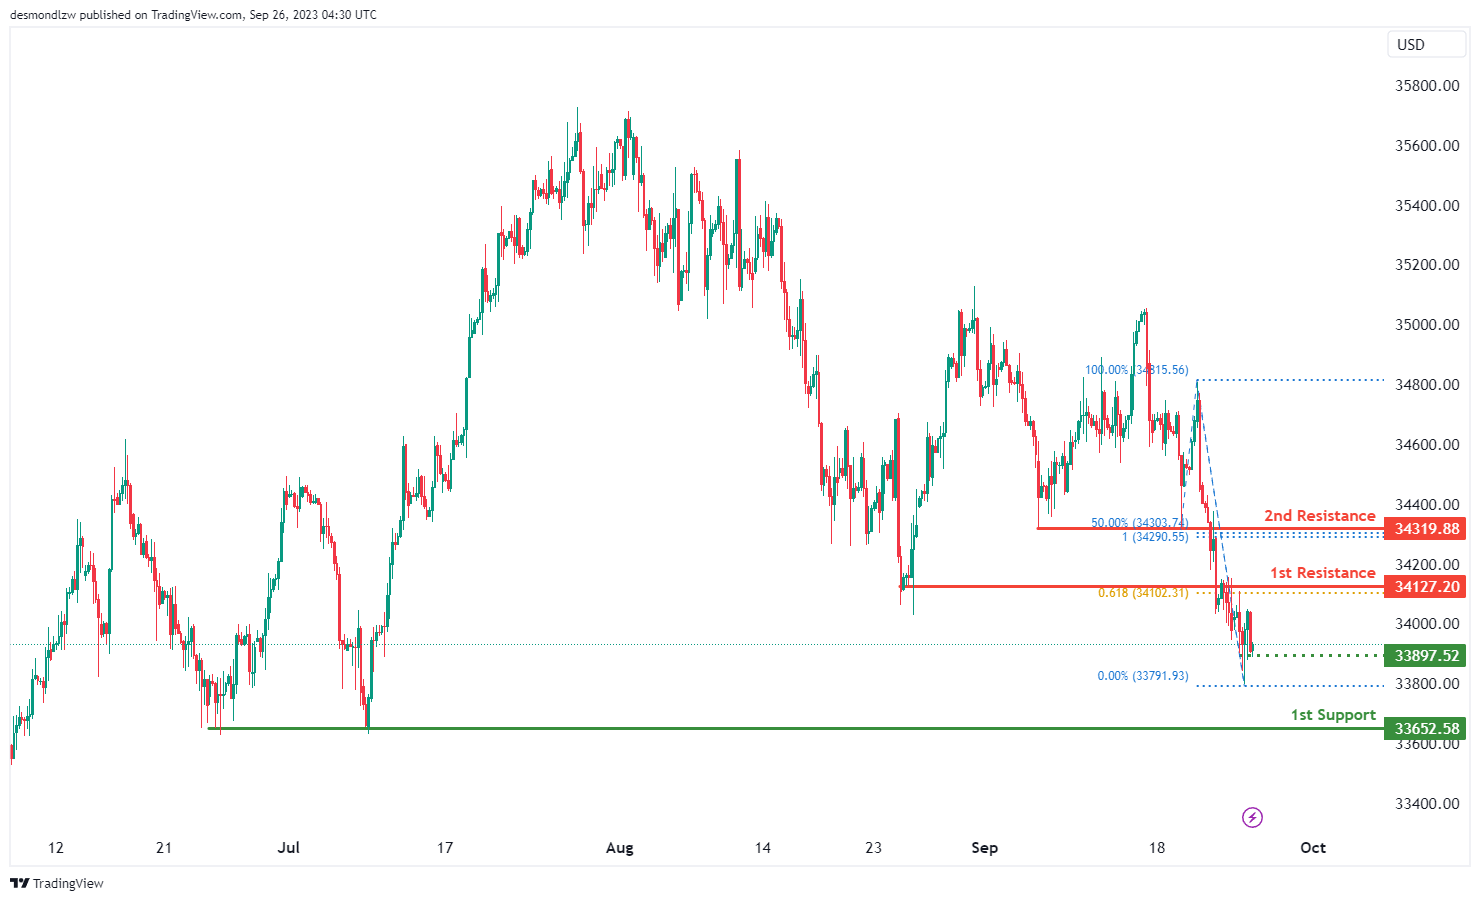
DJ30:
The instrument DJ30 currently indicates a bearish overall momentum on the chart, and there’s potential for a bearish continuation towards the 1st support.
The 1st support at 33652.58 is considered strong due to its nature as a multi-swing low support.
There is also an intermediate support at 33897.52, which is notable as it acts as a swing low support.
On the resistance side, we have the 1st resistance at 34127.20, which is significant because it represents an overlap resistance and is linked to the 61.80% Fibonacci Projection.
Furthermore, the 2nd resistance at 34319.88 is noteworthy as it functions as a pullback resistance and is associated with both the 50% Fibonacci Retracement and the 100% Fibonacci Projection, indicating potential areas of resistance convergence.
GER30:
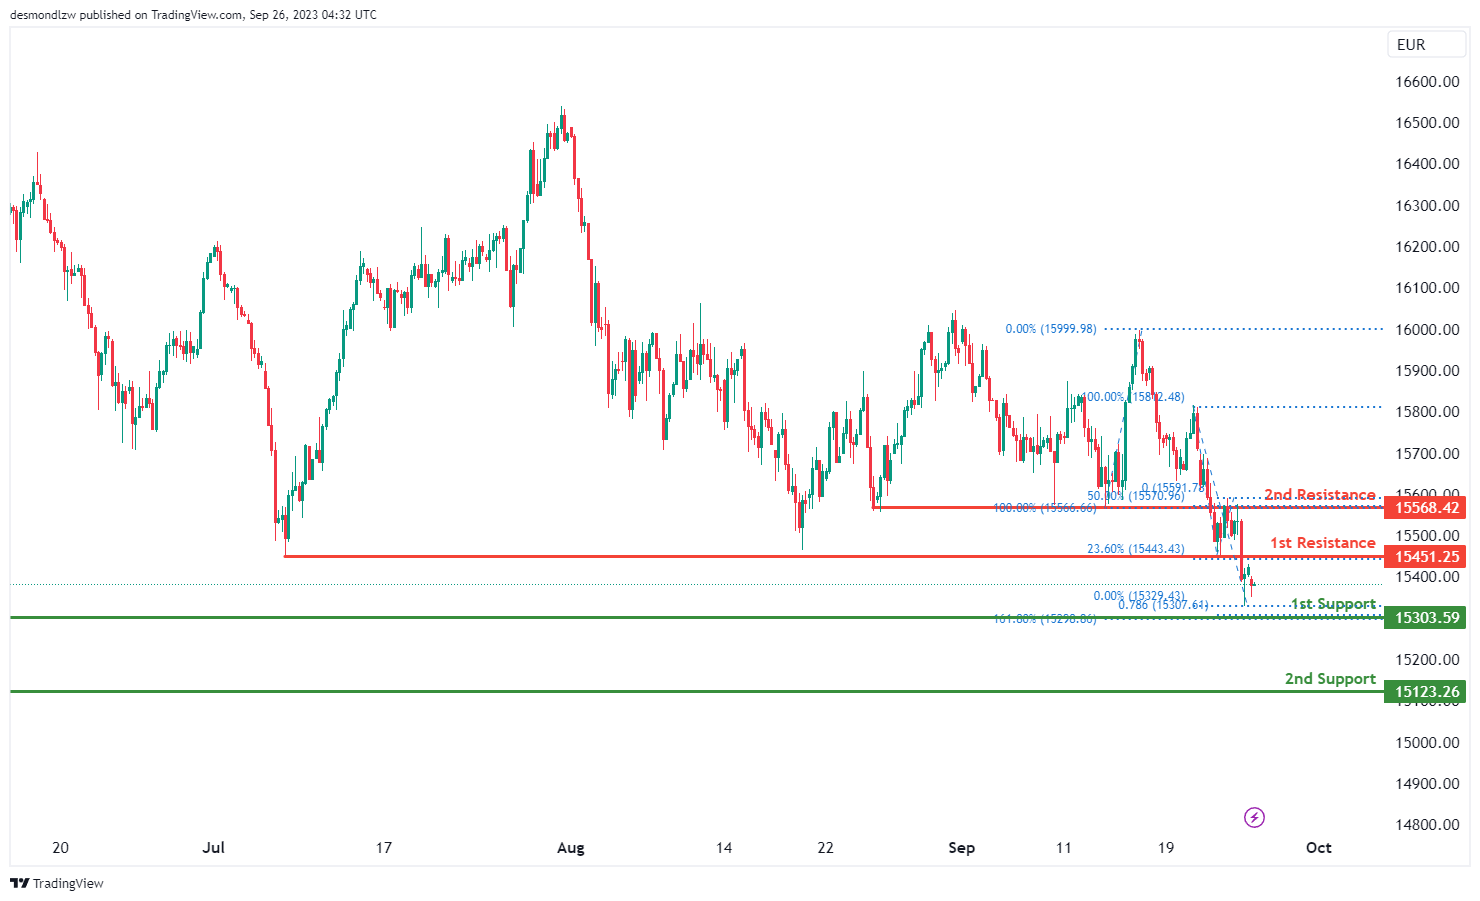
The instrument GER30 currently indicates a bearish overall momentum on the chart, and there’s potential for a bearish continuation towards the 1st support.
The 1st support at 15303.59 is considered strong due to its nature as a pullback support. It’s also associated with both the 161.80% Fibonacci Extension and the 78.60% Fibonacci Projection, indicating a potential area of Fibonacci confluence and providing robust support.
The 2nd support at 15123.26 is also notable as it acts as a swing low support and is associated with the 161.80% Fibonacci Extension, offering an additional layer of potential support.
On the resistance side, we have the 1st resistance at 15451.25, which is significant because it represents a pullback resistance and is linked to the 23.60% Fibonacci Retracement.
Furthermore, the 2nd resistance at 15568.42 is noteworthy as it functions as an overlap resistance and is associated with the 50% Fibonacci Retracement, suggesting potential barriers to further bullish movement at these levels and supporting the idea of a bearish continuation towards the 1st support.
US500
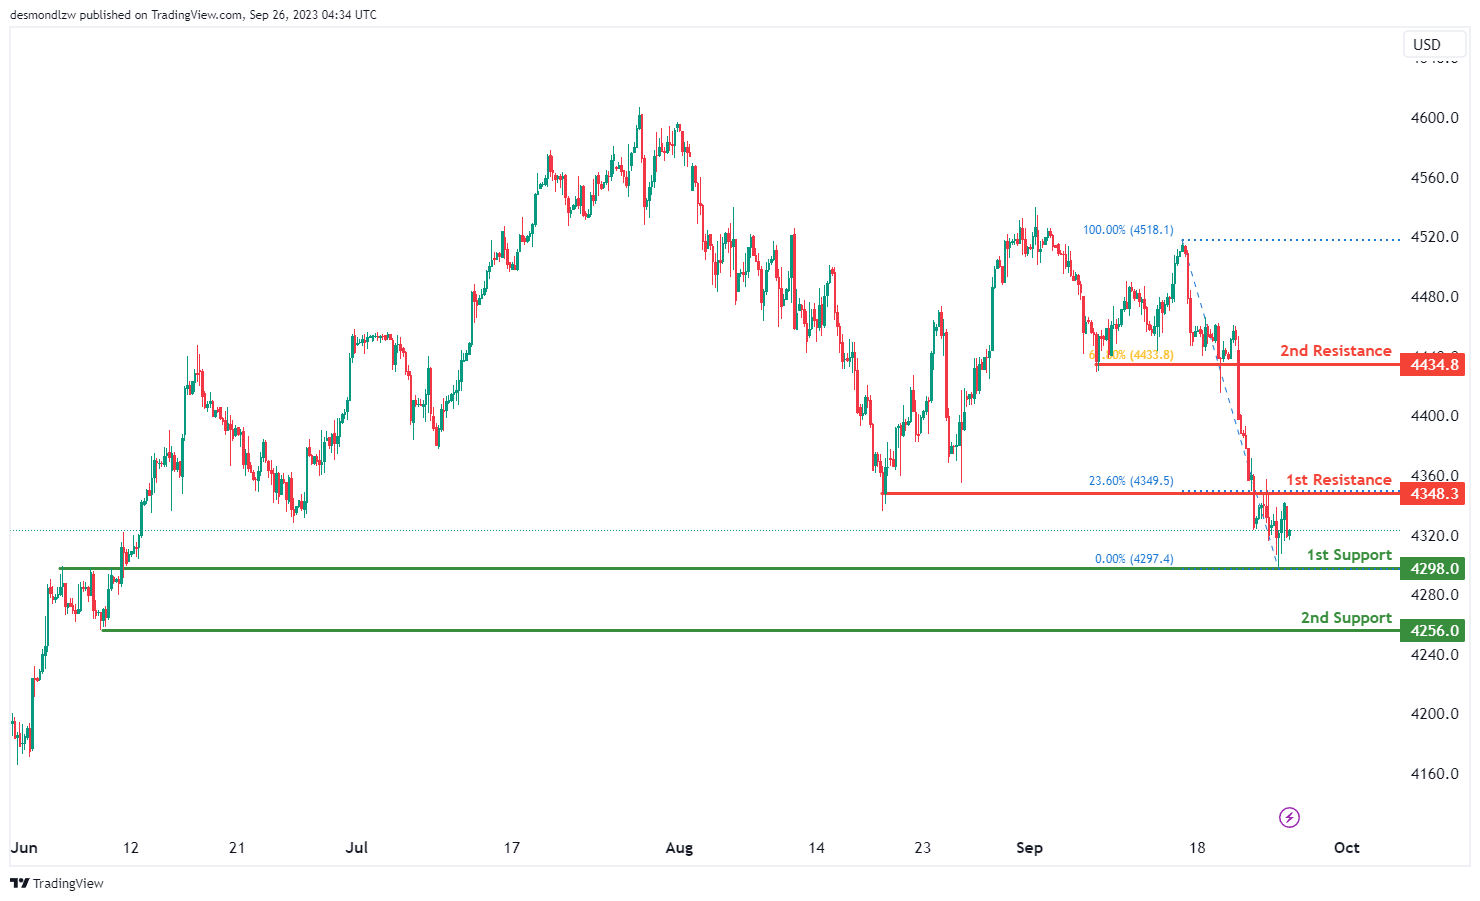
The instrument US500 currently indicates a neutral overall momentum on the chart, and there are factors contributing to this neutral momentum. As a result, there’s potential for the price to fluctuate between the 1st resistance and 1st support levels.
The 1st support at 4298.0 is considered good due to its nature as an overlap support.
The 2nd support at 4256.0 is also notable as it acts as a swing low support.
On the resistance side, we have the 1st resistance at 4348.3, which is significant because it represents an overlap resistance and is associated with the 23.60% Fibonacci Retracement.
Furthermore, the 2nd resistance at 4434.8 is noteworthy as it functions as a pullback resistance and is linked to the 61.80% Fibonacci Retracement.
BTC/USD:
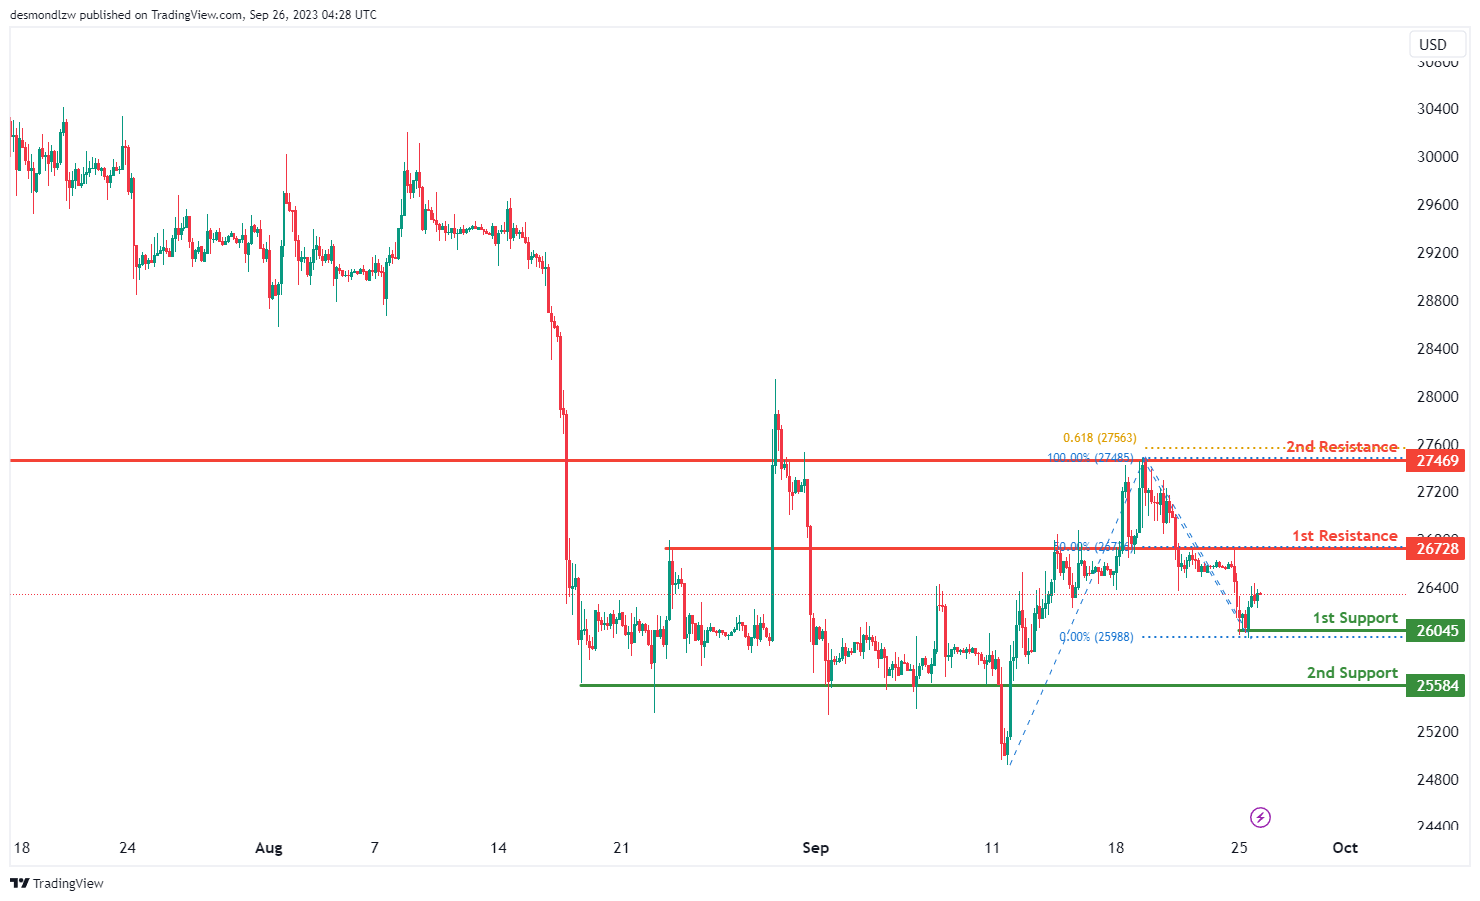
The instrument BTC/USD currently indicates a neutral overall momentum on the chart. Factors contributing to this neutral momentum include the potential for price to fluctuate between the 1st resistance and 1st support levels.
The 1st support at 26045 is considered good due to its nature as an overlap support.
The 2nd support at 25584 is also notable as it acts as a pullback support.
On the resistance side, we have the 1st resistance at 26728, which is significant because it represents an overlap resistance and is associated with the 50% Fibonacci Retracement.
Similarly, the 2nd resistance at 27469 is noteworthy as it functions as an overlap resistance and is linked to the 61.80% Fibonacci Projection, indicating potential barriers to further bullish movement at these levels.
ETH/USD:
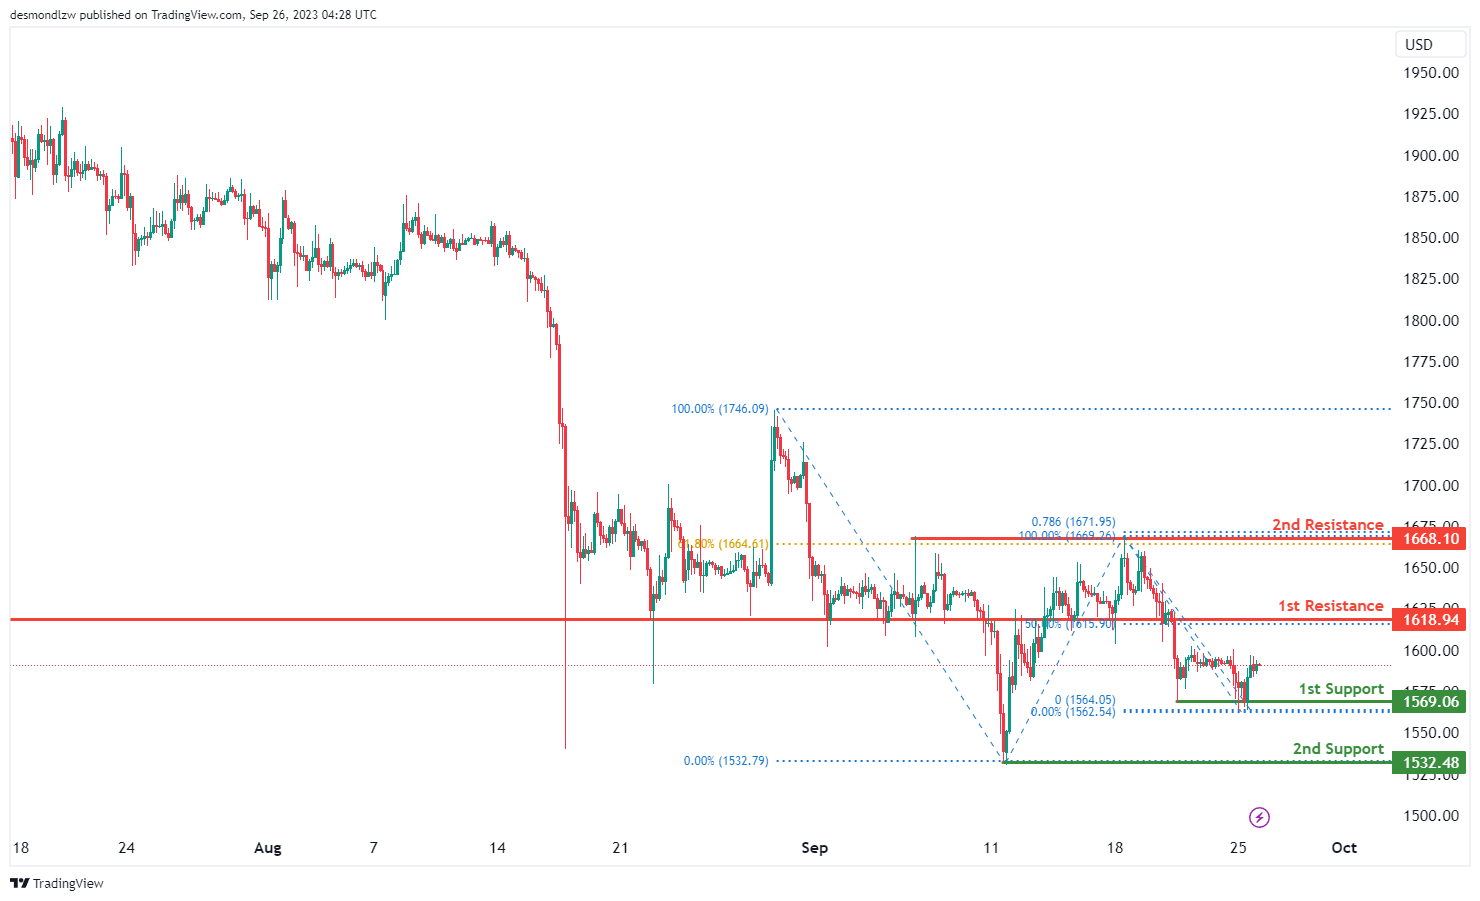
The instrument ETH/USD currently indicates a neutral overall momentum on the chart. There’s potential for the price to fluctuate between the 1st resistance and 1st support levels.
The 1st support at 1569.06 is considered good due to its nature as a multi-swing low support.
The 2nd support at 1532.48 is also notable as it acts as a swing low support.
On the resistance side, we have the 1st resistance at 1618.94, which is significant because it represents a pullback resistance and is associated with the 50% Fibonacci Retracement.
Furthermore, the 2nd resistance at 1668.10 is noteworthy as it functions as a multi-swing high resistance and is linked to both the 61.80% Fibonacci Retracement and the 78.60% Fibonacci Projection, indicating a potential area of resistance convergence. This suggests potential barriers to further bullish movement at these levels and contributes to the idea of price fluctuating within this range.
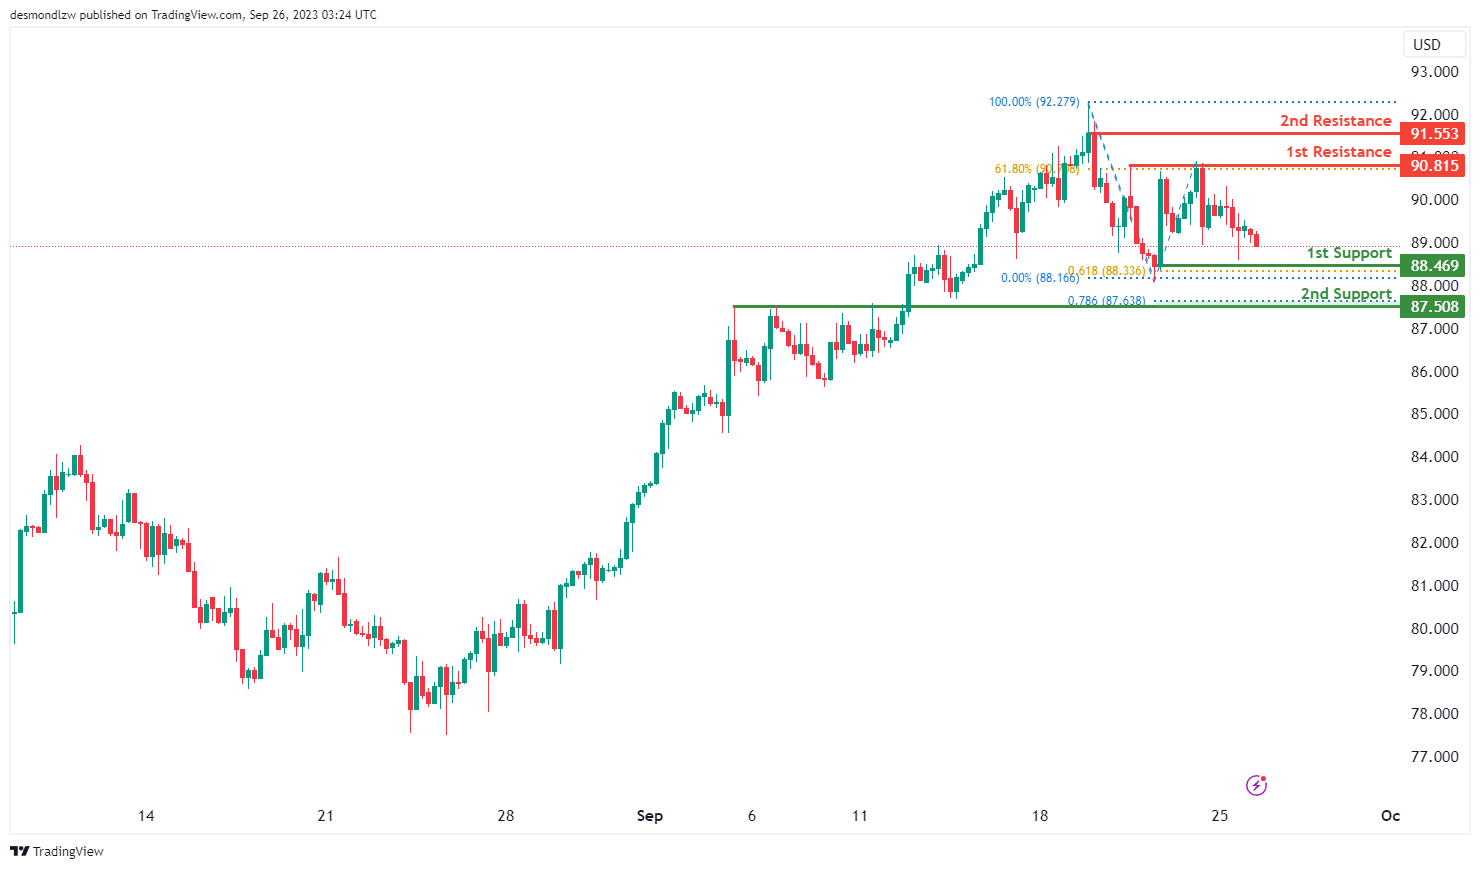
WTI/USD:
The WTI (West Texas Intermediate) chart currently exhibits a bearish momentum with price potentially falling towards the 1st support level.
The 1st support level at 88.47 is identified as a pullback support that coincides with the 61.80% Fibonacci projection level. Additionally, the 2nd support level at 87.51 is also marked as a pullback support that aligns with the 78.60% Fibonacci projection level.
To the upside, the 1st resistance level at 90.82 is identified as a pullback resistance that aligns with the 61.80% Fibonacci retracement level while the 2nd resistance level at 91.55 is marked as a swing-high resistance, which may act as a significant barrier to any potential upward movements.
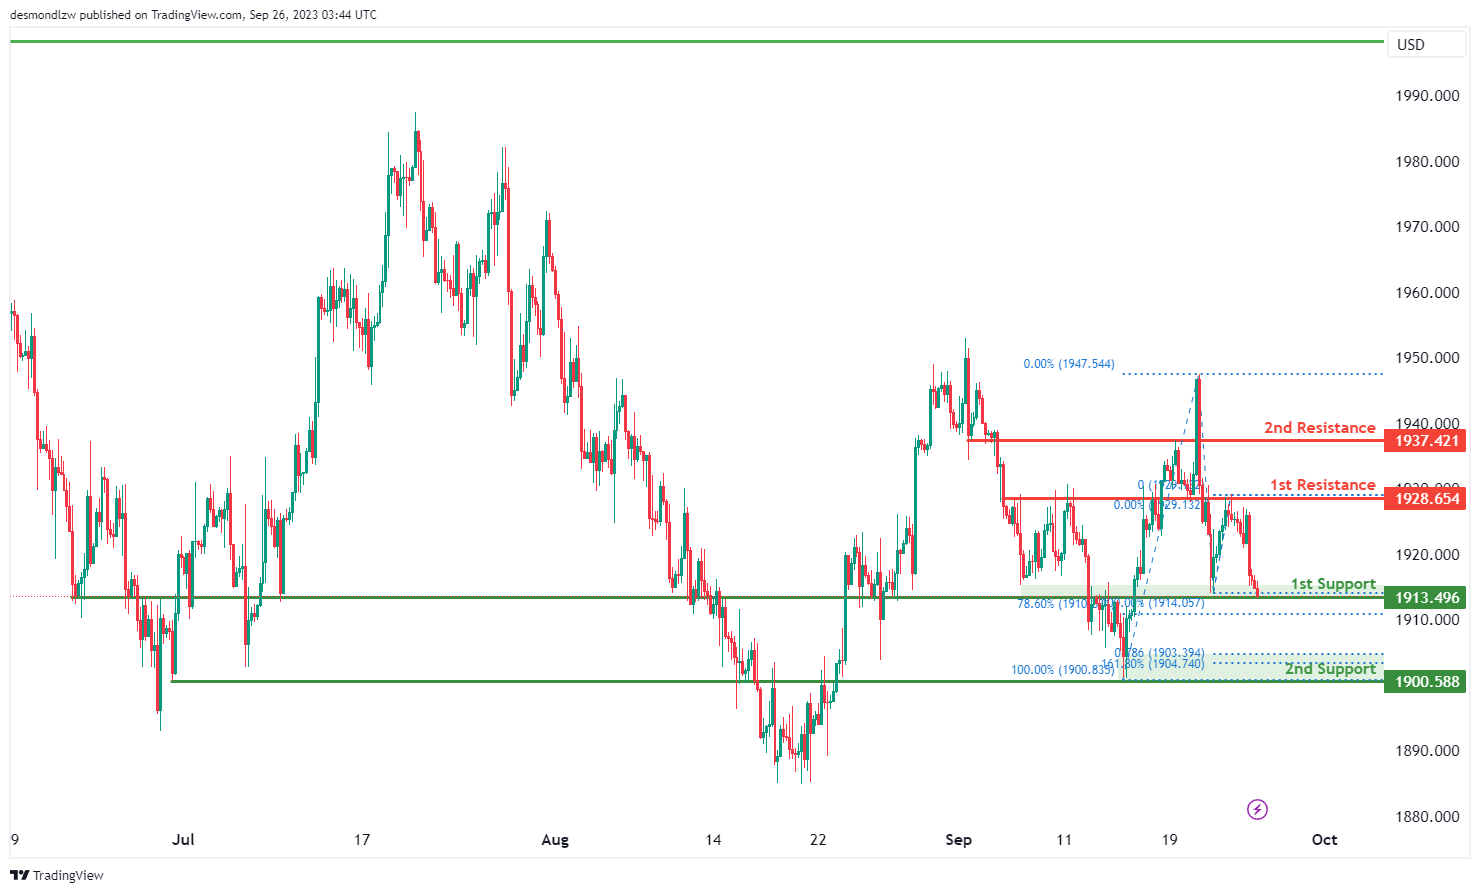
XAU/USD (GOLD):
The XAUUSD chart is presently displaying a bullish trend. Anticipations suggest that there might be a bullish bounce from the 1st support level at 1913.49, which is characterized as an overlap support, directing the price towards the 1st resistance at 1928.65, which is also identified as an overlap resistance.
In case the price delves deeper, there’s a 2nd support level at 1900.00, noteworthy due to its overlap support characteristic and the convergence of the 161.80% Fibonacci Extension and the 78.60% Fibonacci Projection, marking a Fibonacci confluence and suggesting its potential significance as a strong support zone.
On the other side, should the price attempt to push higher, the 2nd resistance at 1937.42, distinguished as a pullback resistance, could act as a potential hurdle for further bullish movements.


