
DXY:
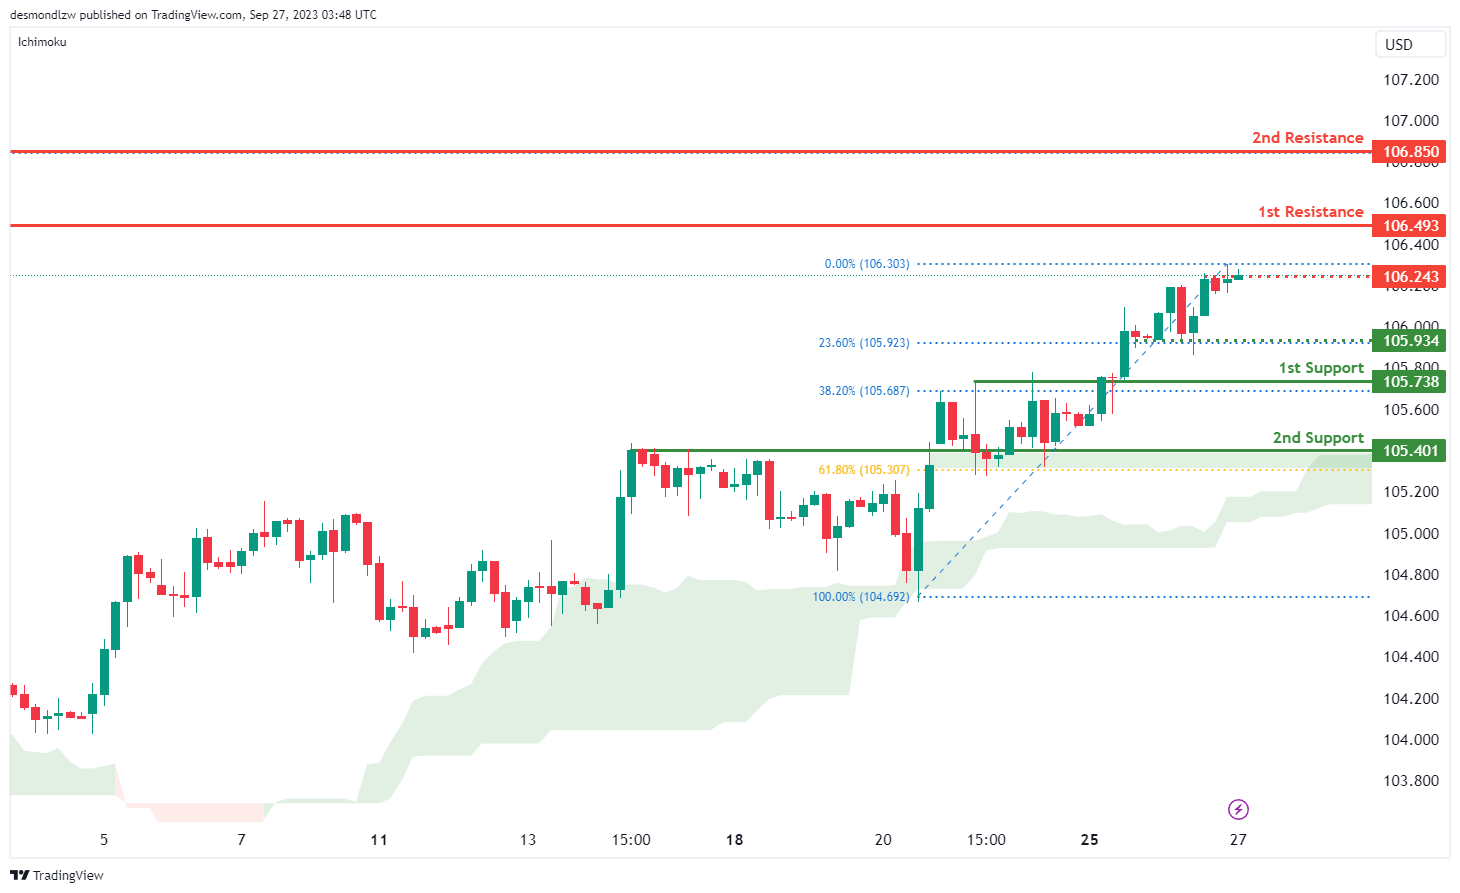
The DXY chart currently displays bullish momentum, as the price is above the bullish Ichimoku cloud, suggesting a potential bullish continuation towards the 1st resistance.
The 1st support at 105.73, noted as an overlap support, aligns with the 38.20% Fibonacci Retracement, enhancing its significance as a strong support zone. Similarly, the 2nd support at 105.40 is another overlap support, coinciding with the 61.80% Fibonacci Retracement, bolstering its importance as a key support level.
On the resistance side, the 1st resistance is found at 106.49, identified as a pullback resistance, acting as a potential barrier to upward movements. Above this, the 2nd resistance at 106.85 is a swing high resistance, associated with the 78.60% Fibonacci Projection, further marking its importance as a significant resistance level. An intermediate resistance is also present at 106.24, recognized as a multi-swing high resistance, underscoring its potential role in the current bullish scenario.
EUR/USD:
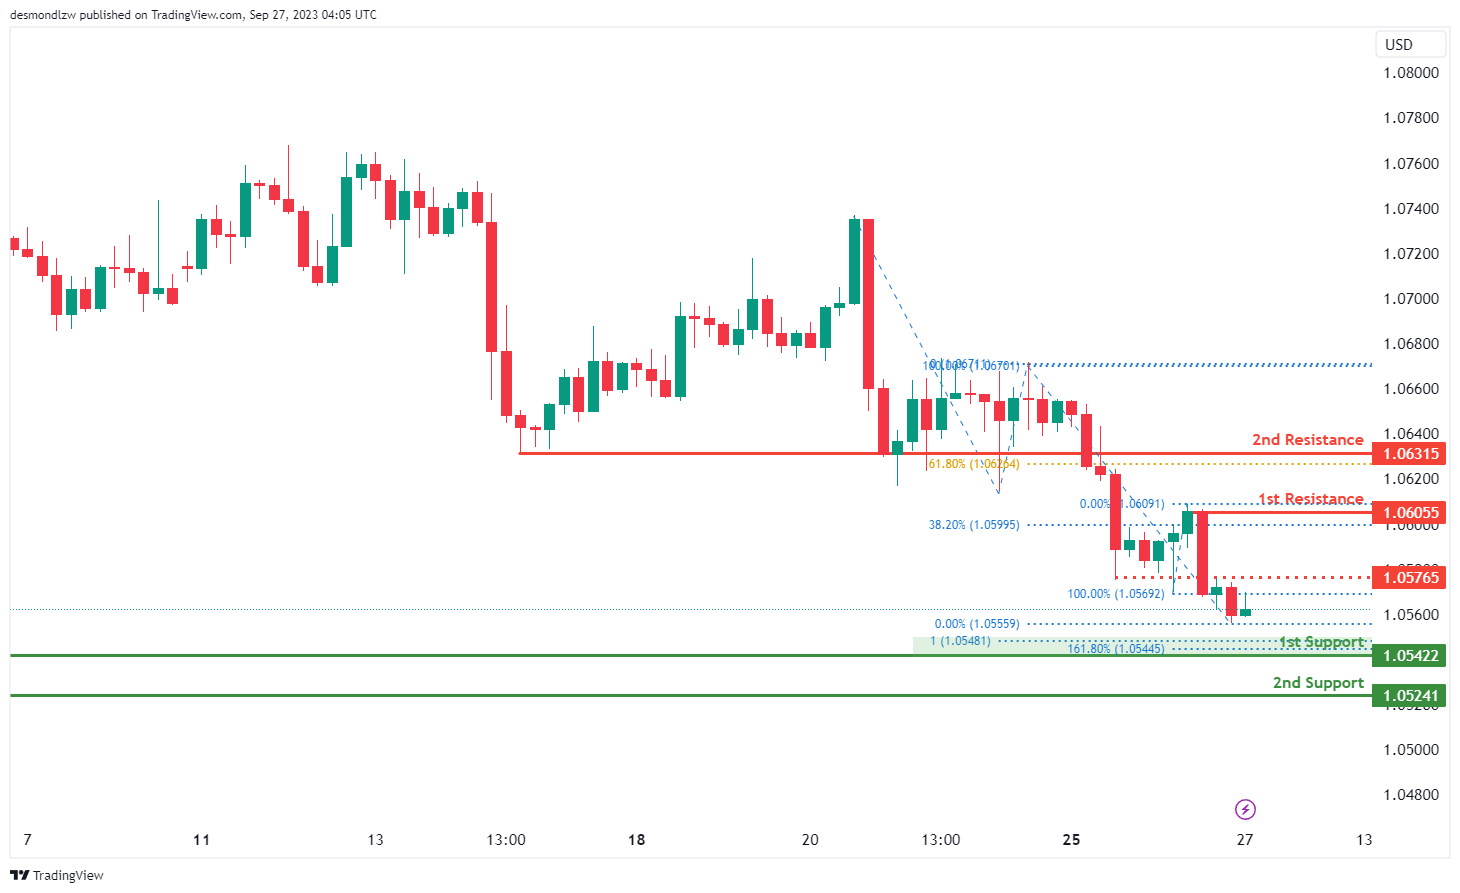
The EUR/USD chart is presently demonstrating bearish momentum, with the expectation of a potential bearish continuation heading towards the 1st support. The 1st support at 1.0542 is noteworthy, acting as a swing low support with both a 161.80% Fibonacci Extension and a 100% Fibonacci Projection, exhibiting Fibonacci confluence. The 2nd support is identified at 1.0524 and is distinguished as another crucial swing low support.
On the resistance end, the 1st resistance level is located at 1.0695, recognized as a swing high resistance and aligning with the 38.20% Fibonacci Retracement, indicating its potential significance in the market’s dynamic. Following this, the 2nd resistance at 1.0631 serves as a pullback resistance, aligning with the 61.80% Fibonacci Retracement, further reinforcing its importance. An intermediate resistance is also pinpointed at 1.0576, acknowledged as an overlap resistance
EUR/JPY:
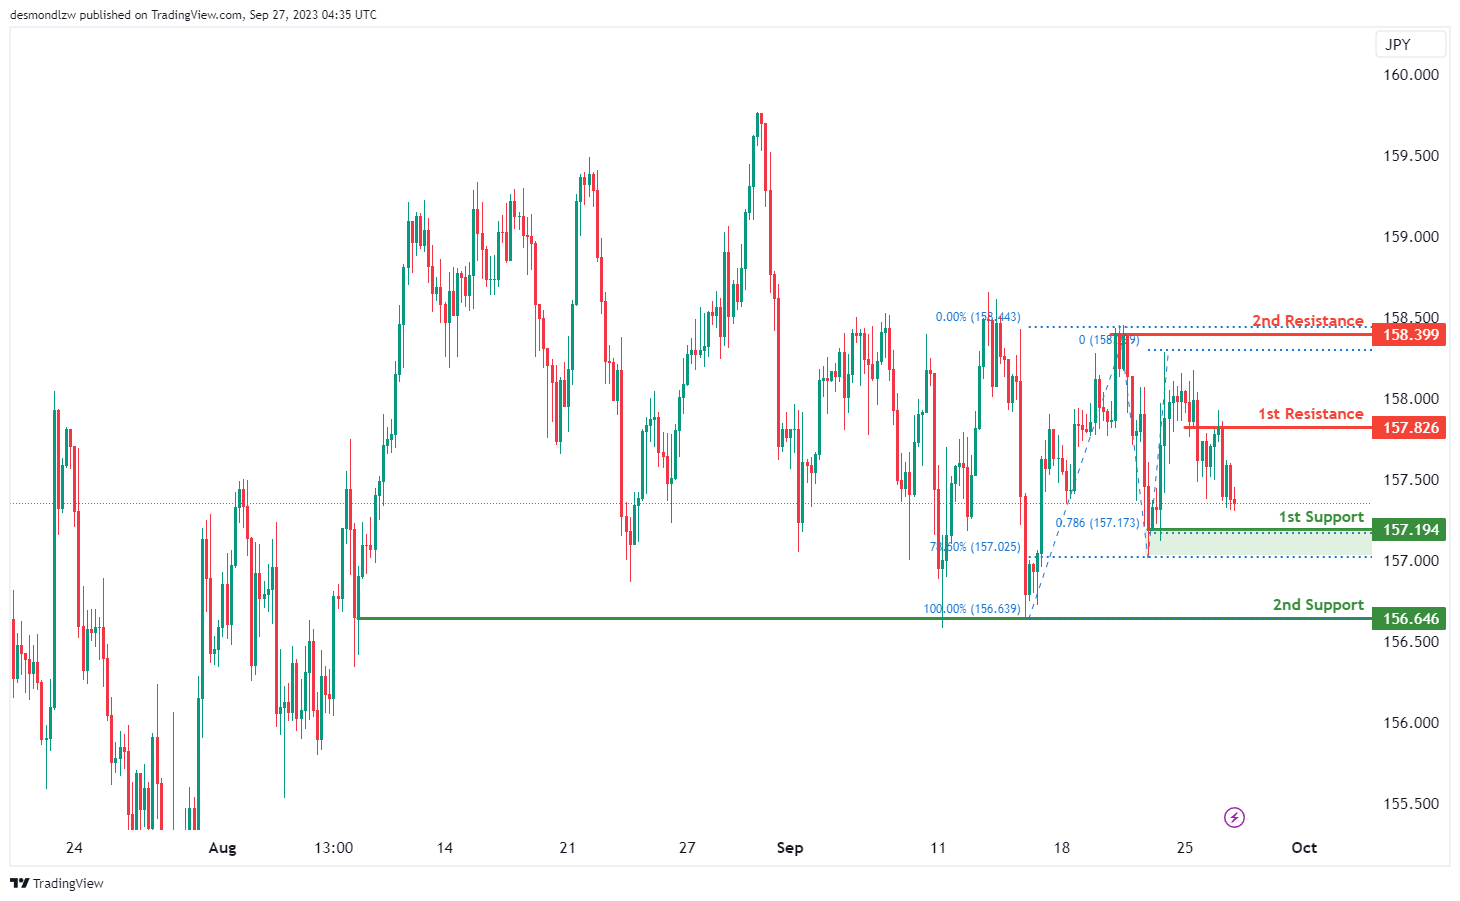
The instrument EUR/JPY currently indicates a bearish overall momentum on the chart, and there’s potential for a bearish continuation towards the 1st support.
The 1st support at 157.91 is considered strong due to several factors, including its nature as a swing low support and the fact that it coincides with both the 78.60% Fibonacci Projection and the 78.60% Fibonacci Retracement. This indicates a significant area of Fibonacci confluence, making it a compelling support level.
The 2nd support at 156.64 is also noteworthy as it acts as a multi-swing low support.
On the resistance side, we have the 1st resistance at 157.82, which is significant because it represents an overlap resistance.
Furthermore, the 2nd resistance at 158.39 is notable as it functions as a swing high resistance.
EUR/GBP:
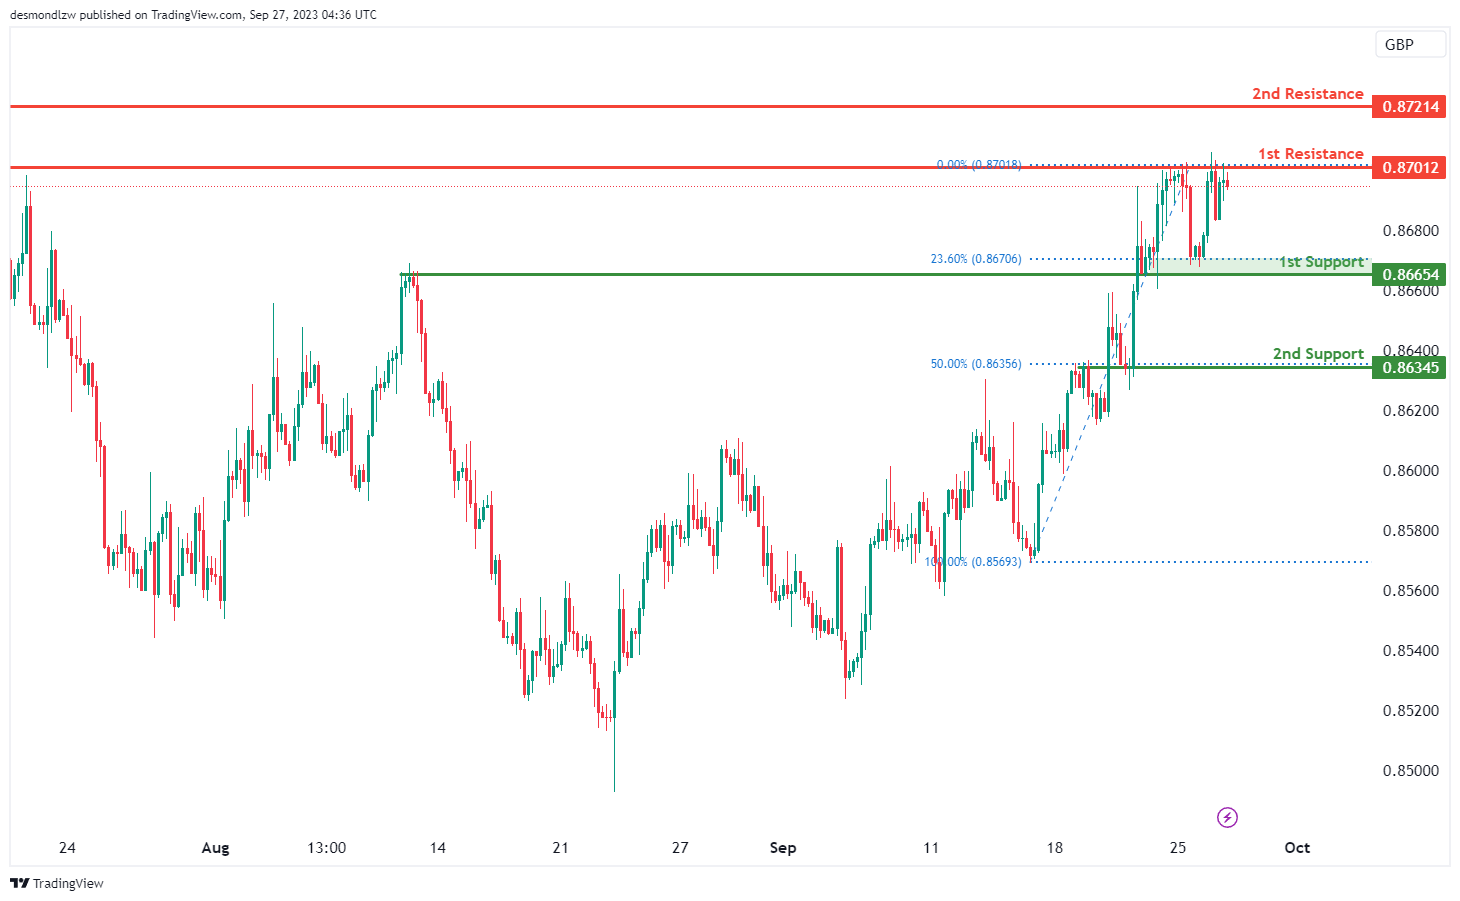
The instrument EUR/GBP currently has a bearish overall momentum on the chart, and there’s potential for a bearish reaction off the 1st resistance and a drop towards the 1st support.
The 1st support at 0.8665 is considered strong due to several factors. It acts as an overlap support and coincides with the 23.60% Fibonacci Retracement level, indicating a significant area of support.
The 2nd support at 0.8634 is also notable as it serves as an overlap support and corresponds to the 50% Fibonacci Retracement level.
On the resistance side, we have the 1st resistance at 0.8701, which is significant because it represents a multi-swing high resistance.
Furthermore, the 2nd resistance at 0.8721 is noteworthy as it acts as an overlap resistance.
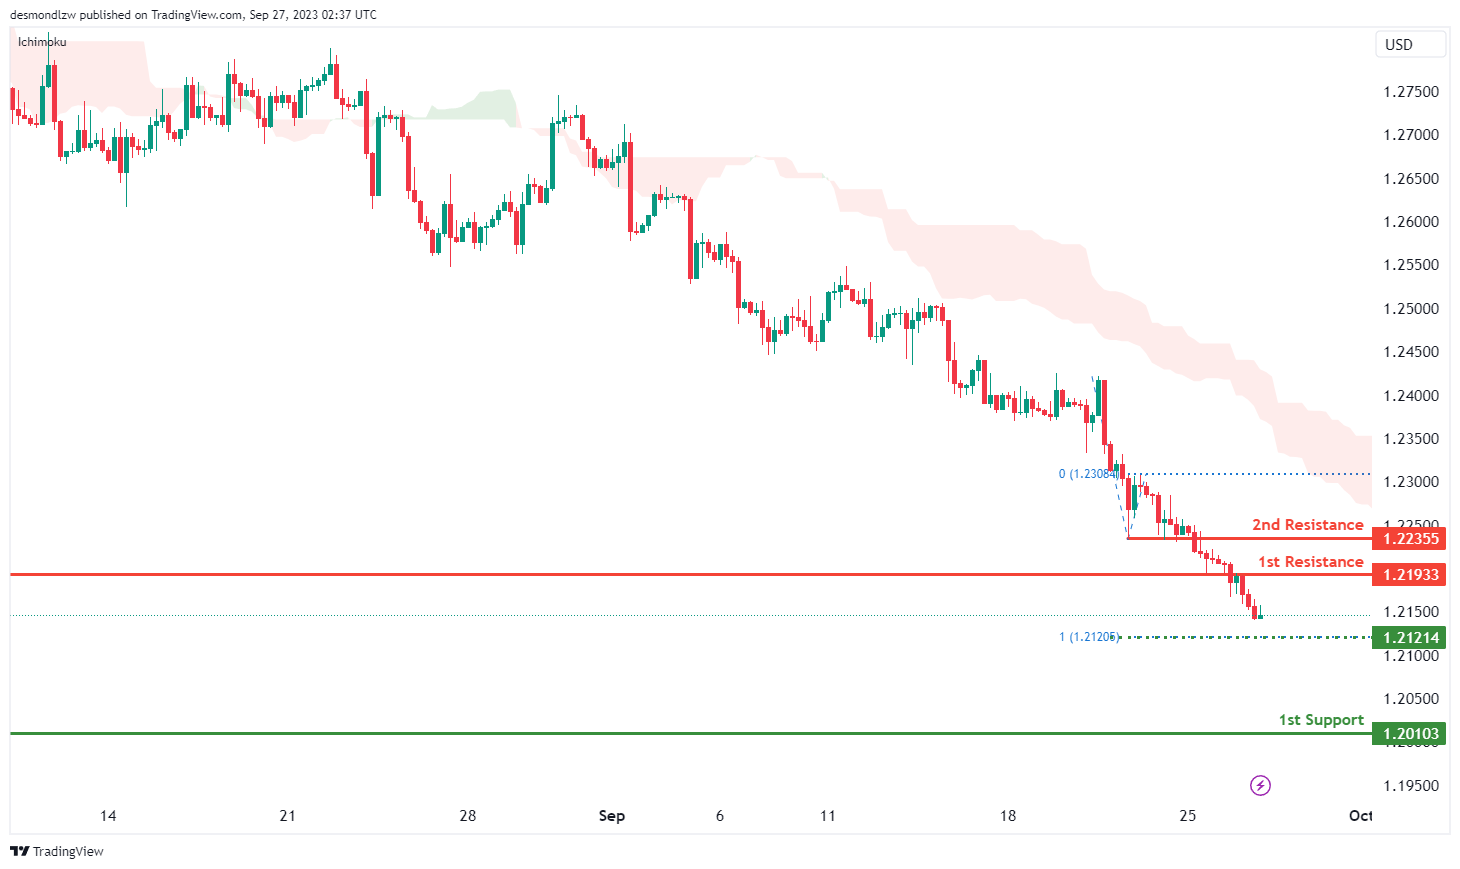
GBP/USD:
The GBP/USD chart currently indicates a bearish momentum, influenced by the price being below the bearish Ichimoku cloud. The price could break below the intermediate support level and make a bearish continuation towards the 1st support level.
The intermediate support level at 1.2121 is identified as a level that aligns with the 100.00% Fibonacci projection level while the 1st support level at 1.2010 is marked as a swing-low support.
On the resistance side, the 1st resistance level at 1.2193 is identified as an overlap resistance. Additionally, the 2nd resistance level at 1.2236 is noted as pullback resistance, indicating a potential barrier for further price increases.
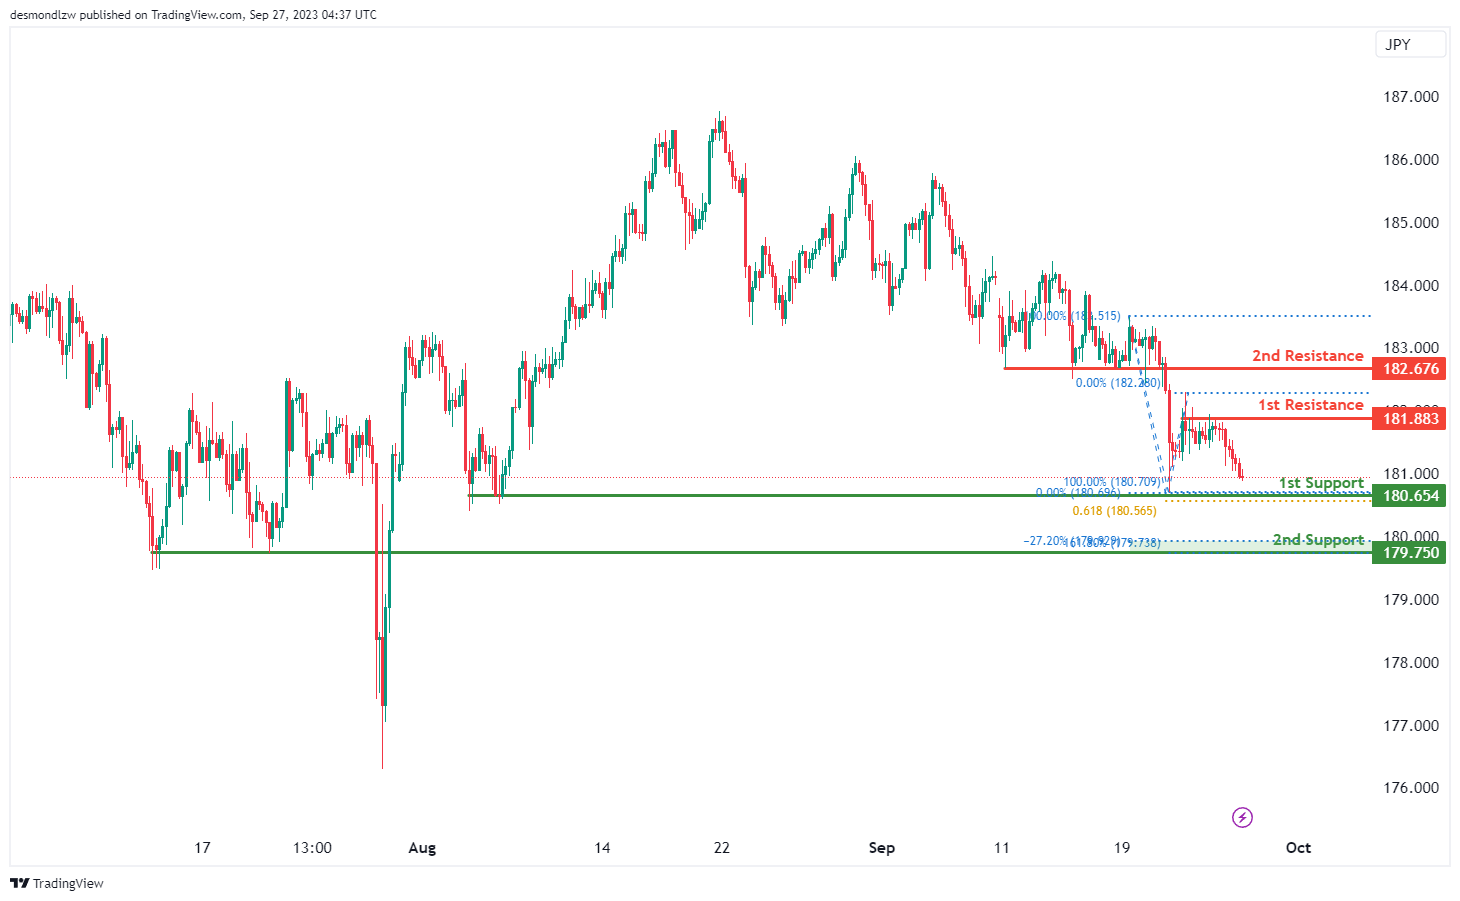
GBP/JPY:
The instrument GBP/JPY currently indicates a bearish overall momentum on the chart, and there’s potential for a bearish continuation towards the 1st support.
The 1st support at 180.65 is considered strong due to several factors. It acts as a multi-swing low support and coincides with the 61.80% Fibonacci Projection, indicating a significant area of Fibonacci confluence, making it a compelling support level.
The 2nd support at 179.75 is also noteworthy as it serves as a pullback support and corresponds to the -27% Fibonacci Expansion as well as the 161.80% Fibonacci Extension, indicating another area of Fibonacci confluence and support.
On the resistance side, we have the 1st resistance at 181.88, which is significant because it represents a multi-swing high resistance.
Furthermore, the 2nd resistance at 182.67 is notable as it acts as a pullback resistance.
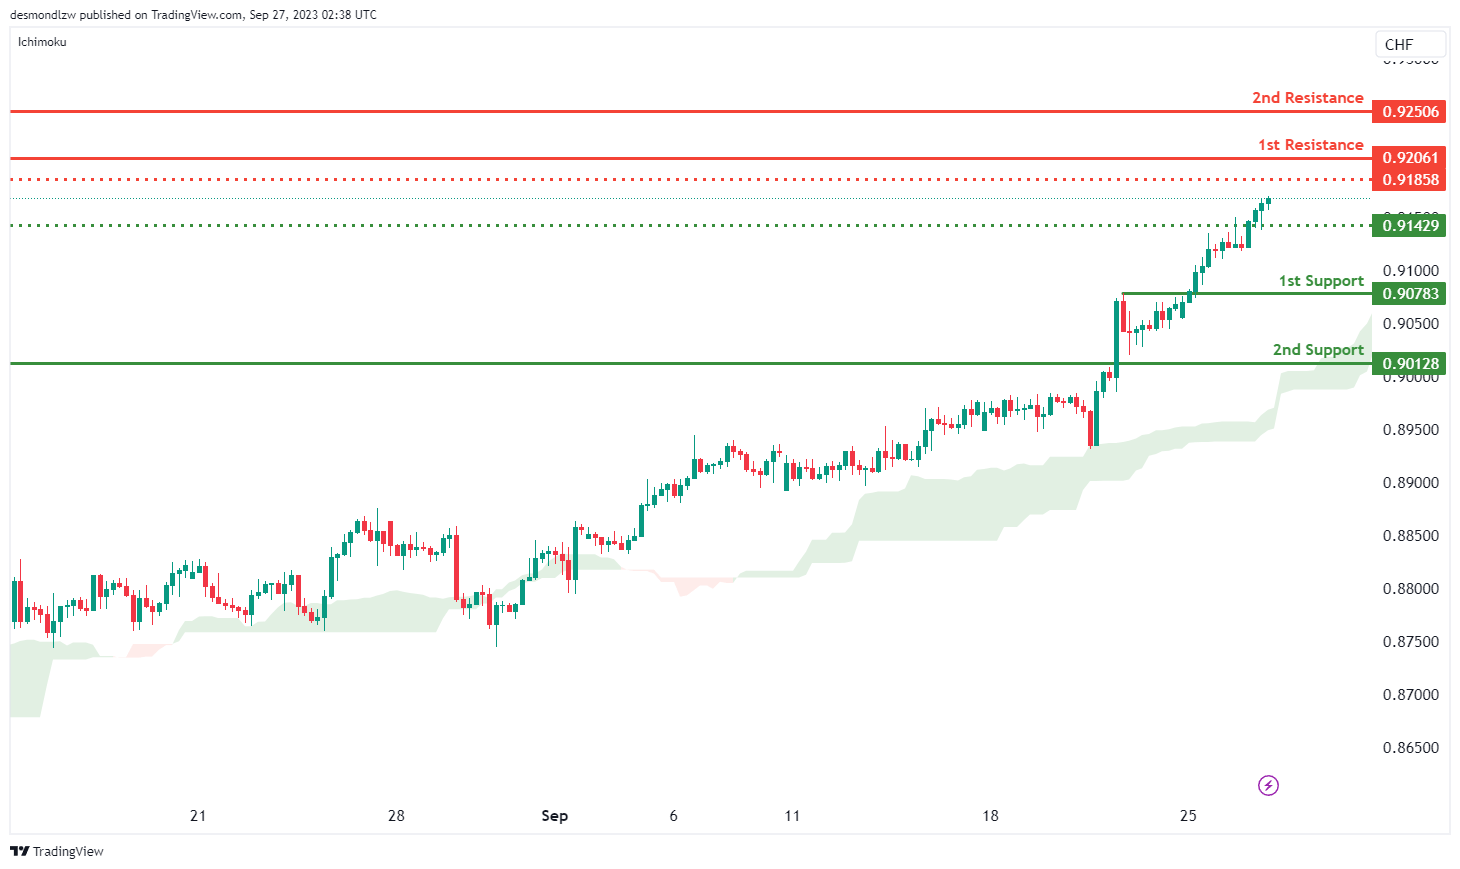
USD/CHF:
The USD/CHF chart currently demonstrates a bullish momentum. There is a potential scenario where the price might break above the intermediate resistance level and make a bullish continuation towards the 1st resistance level.
The intermediate resistance level at 0.9186 is identified as a pullback resistance while the 1st resistance level at 0.9206 is also marked as a pullback resistance. Additionally, the 2nd resistance level at 0.9251 is identified as a pullback resistance, a potential barrier for further price increases.
To the downside, the intermediate support level at 0.9143 is identified as a pullback support while the 1st support level at 0.9078 is also marked as a pullback support. Additionally, the 2nd support level at 0.9013 is identified as a pullback support.
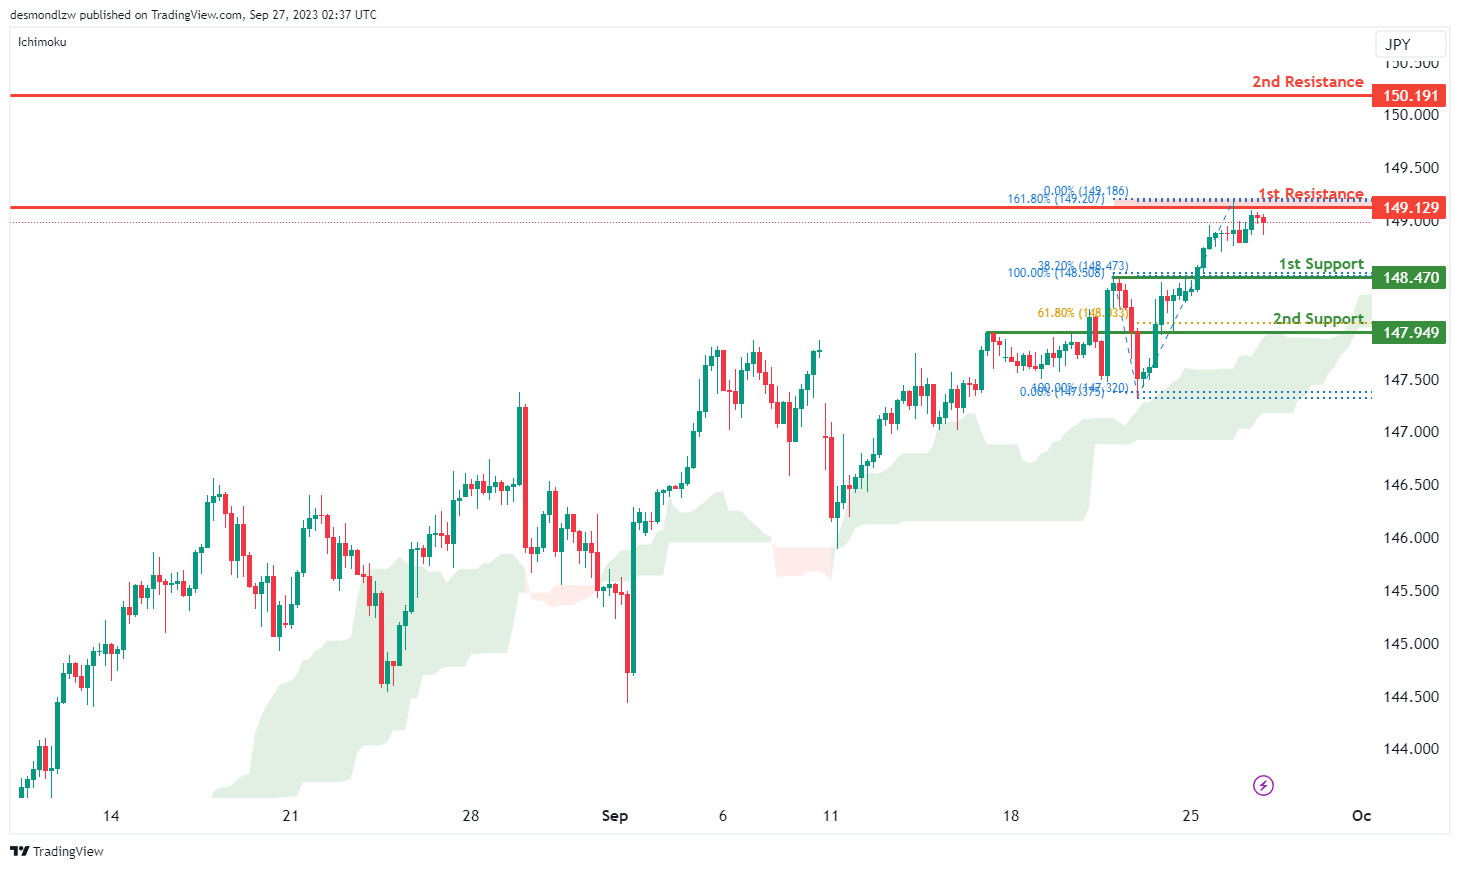
USD/JPY:
The USD/JPY chart is currently showing a bullish trend. There is a possibility that the price might experience a bullish continuation towards the 1st resistance level.
The 1st resistance level at 149.13 is identified as a pullback resistance that aligns with the 161.80% Fibonacci projection level. Further up, the 2nd resistance level at 150.19 is marked as a swing-high resistance.
To the downside, the 1st support level at 148.47 is identified as a pullback support that aligns with the 38.20% Fibonacci retracement level. Further below, the 2nd support level at 147.95 is noted as an overlap support that aligns with the 61.80% Fibonacci retracement level.
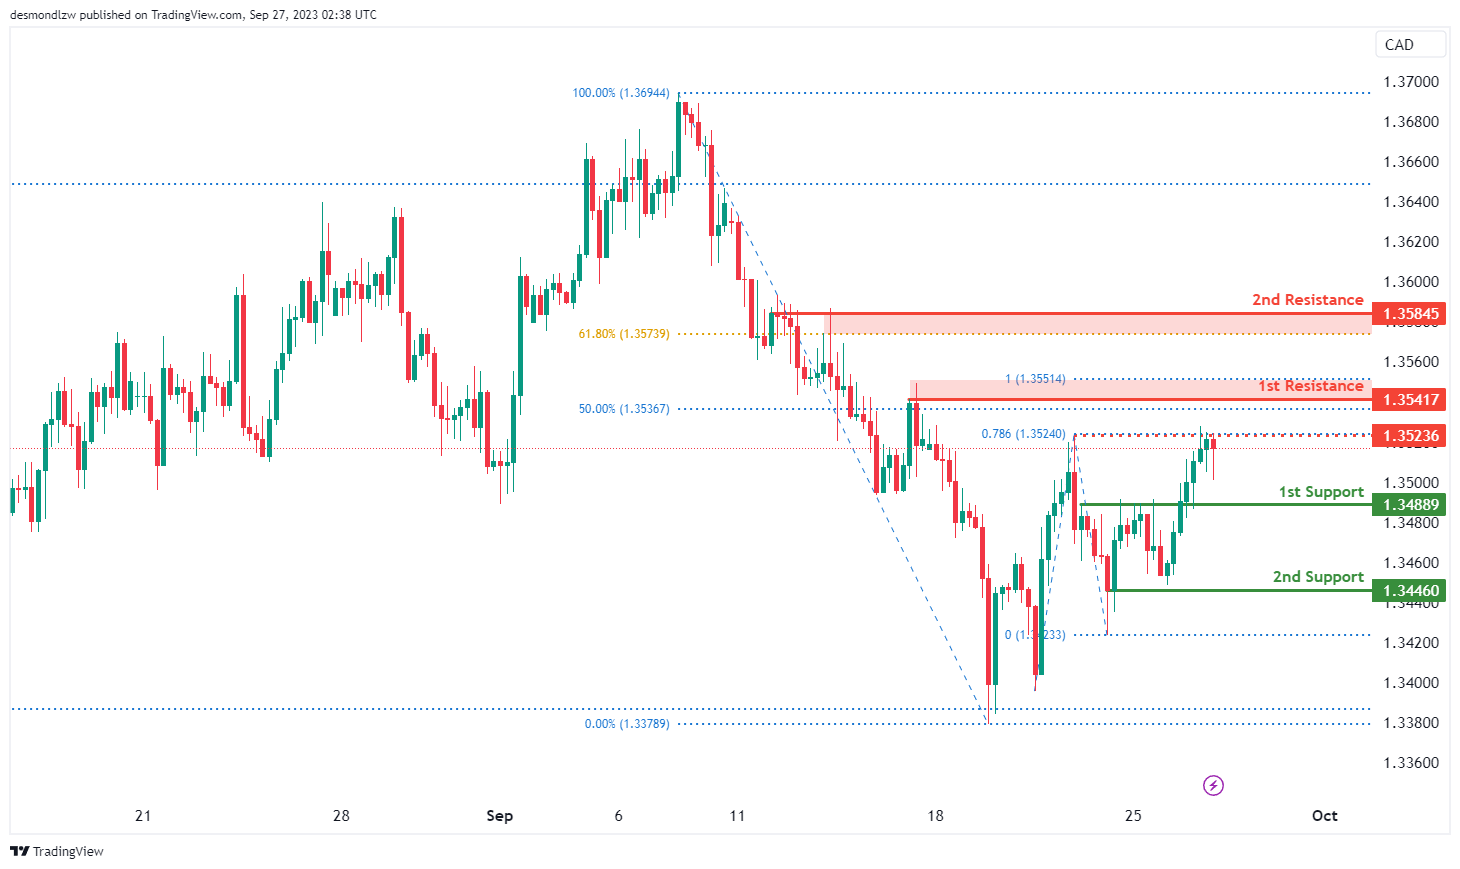
USD/CAD:
The chart for USD/CAD is currently indicating an overall bullish momentum. In this scenario, there is a potential for a bullish continuation towards the 1st resistance level should price break above the intermediate resistance level.
The intermediate resistance level at 1.3524 is identified as a pullback resistance that aligns with the 78.60% Fibonacci projection level while the 1st resistance level at 1.3542 is noted as a pullback resistance that aligns with a confluence of Fibonacci levels i.e. the 50.00% retracement and the 100.00% projection levels. Additionally, the 2nd resistance level at 1.3585 is marked as a pullback resistance that aligns with the 61.80% Fibonacci retracement level.
To the downside, the 1st support level at 1.3489 is identified as a pullback support. Further below, the 2nd support level at 1.3446 is also noted as a pullback support, suggesting a potential strong support level in the past.
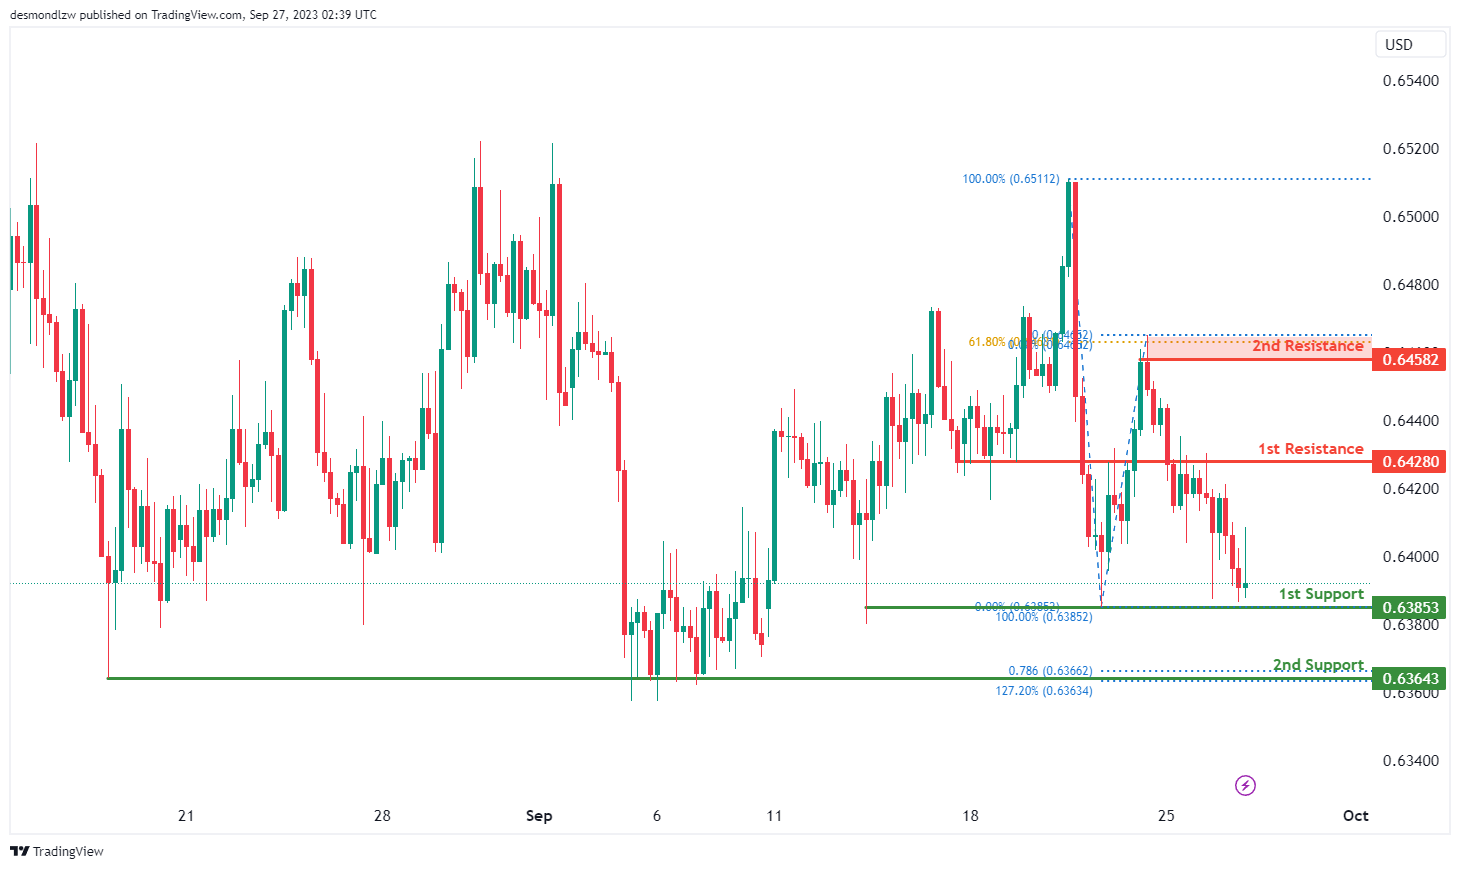
AUD/USD:
The AUD/USD chart is currently displaying an overall bearish momentum, suggesting that price may continue its bearish movement towards the 1st support level.
The 1st support level at 0.6385 is identified as a pullback support while the 2nd support level at 0.6364 is also noted as a pullback support that aligns with a confluence of Fibonacci levels i.e. the 127.20% extension and 78.60% projection levels.
To the upside, the 1st resistance level at 0.6428 is identified as an overlap resistance. Further up, the 2nd resistance level at 0.6458 is marked as a swing-high resistance that aligns with the 61.80% Fibonacci retracement level.
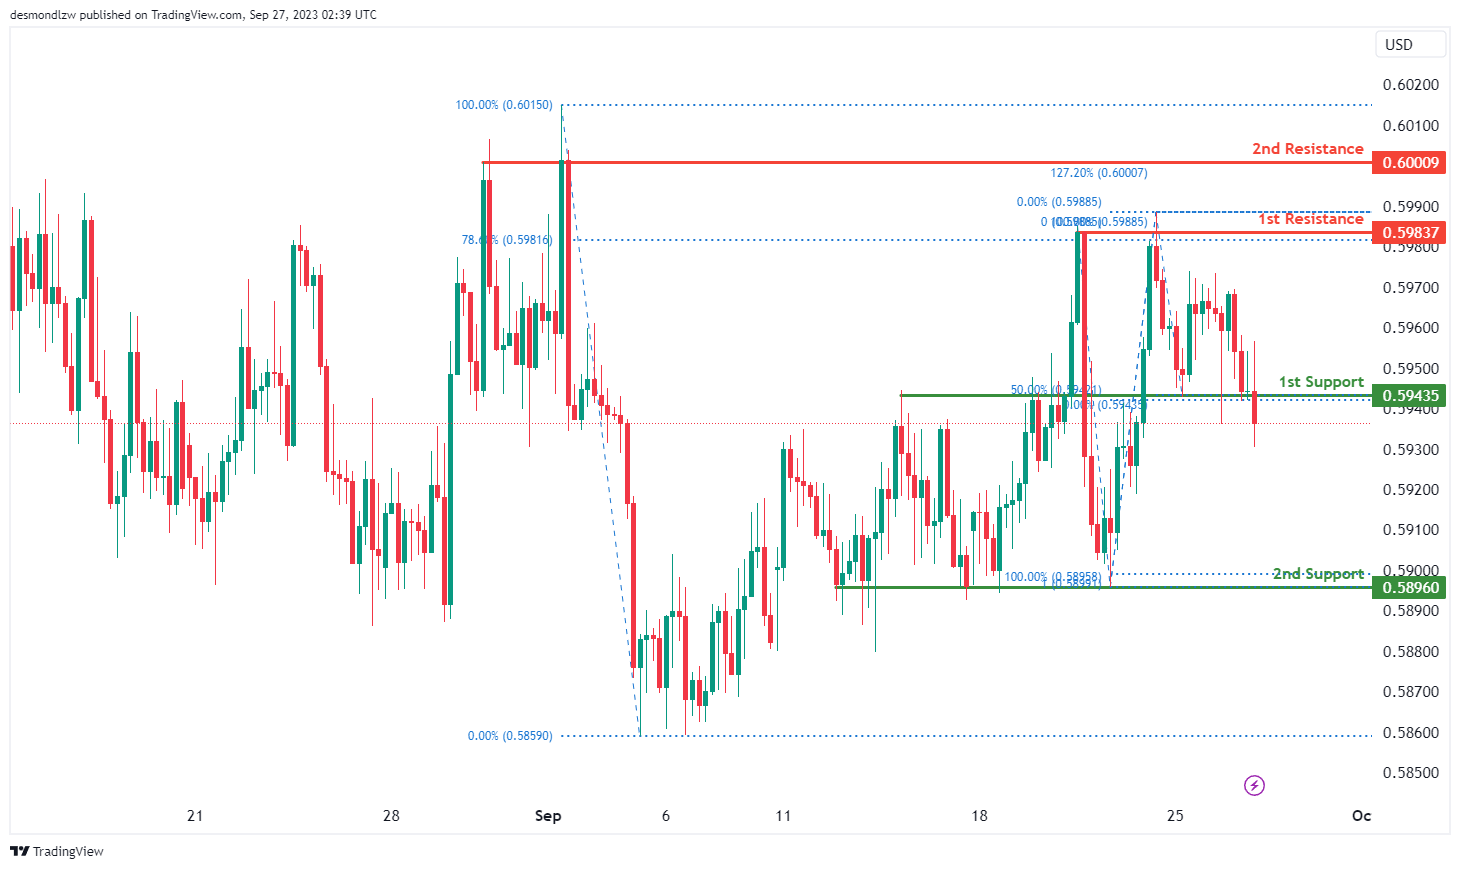
NZD/USD
The NZD/USD chart is currently showing an overall bearish momentum, suggesting that the price may break below the 1st support level and make a bearish continuation towards the 2nd support level.
The 1st support level at 0.5944 is identified as an overlap support that aligns with the 50.00% Fibonacci retracement level. Additionally, the 2nd support level at 0.5896 is marked as a pullback support which could potentially act as a major support zone.
To the upside, the 1st resistance level at 0.5984 is identified as a multi-swing-high resistance that aligns with the 78.60% Fibonacci retracement level. Further up, the 2nd resistance level at 0.6001 is also marked as a multi-swing-high resistance that coincides with the 127.20% Fibonacci extension level.
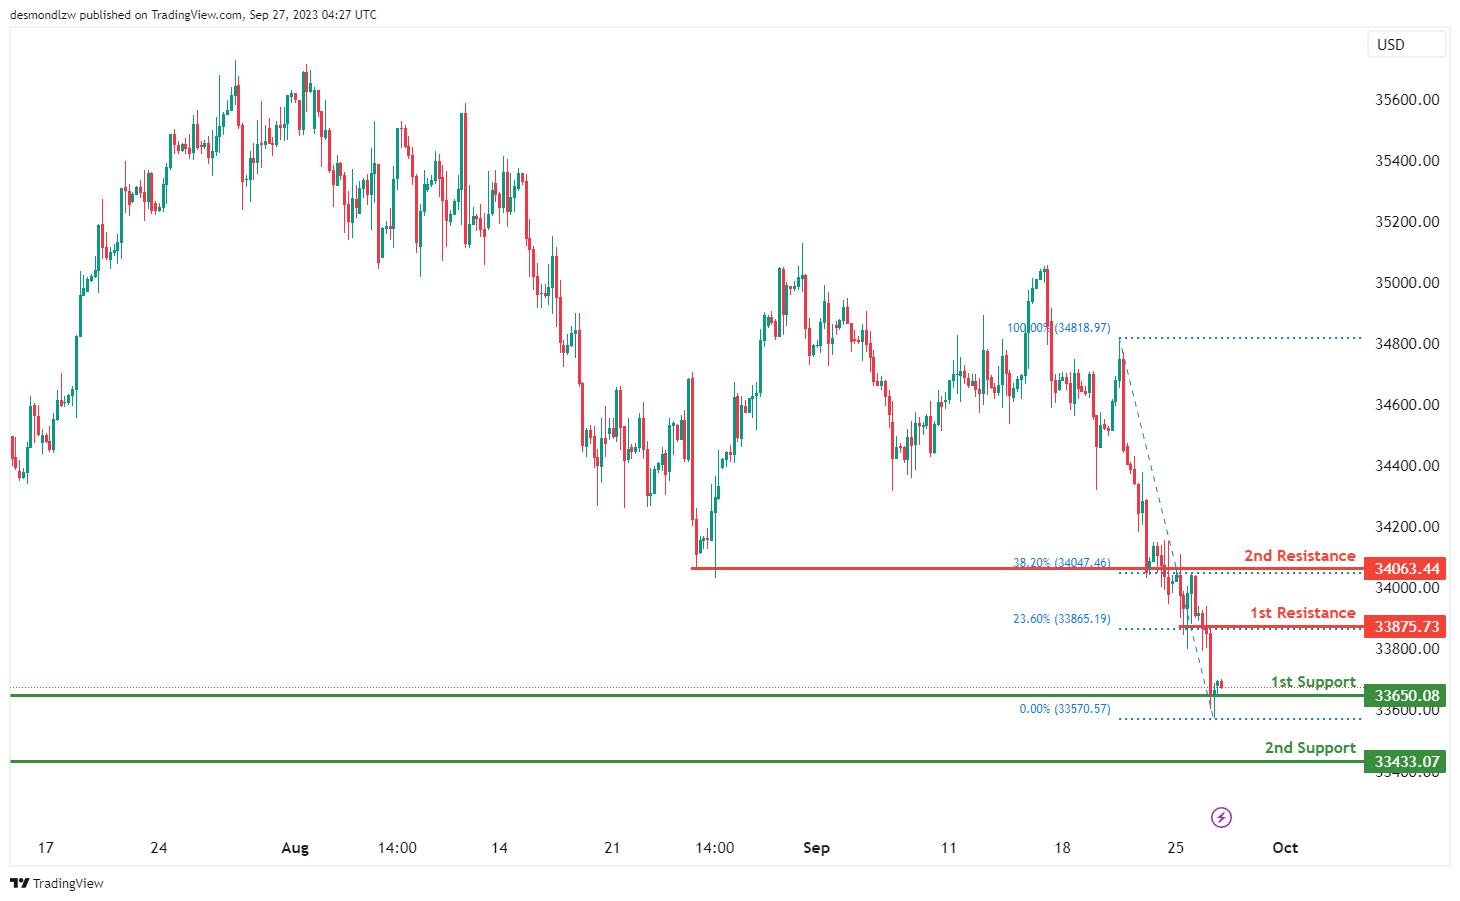
DJ30:
The instrument DJ30 currently indicates a bullish overall momentum on the chart, and there’s potential for a bullish bounce off the 1st support and a move towards the 1st resistance.
The 1st support at 33650.08 is considered good due to its nature as a multi-swing low support.
There is also an intermediate support at 33433.07, which is significant because it acts as a swing low support, providing an additional layer of potential support.
On the resistance side, we have the 1st resistance at 33875.73, which is significant because it represents a pullback resistance and is associated with the 23.60% Fibonacci Retracement.
Furthermore, the 2nd resistance at 34063.44 is noteworthy as it functions as an overlap resistance and is linked to the 38.20% Fibonacci Retracement. These resistance levels suggest potential barriers to further bearish movement at these levels, supporting the idea of a bullish bounce off the 1st support.
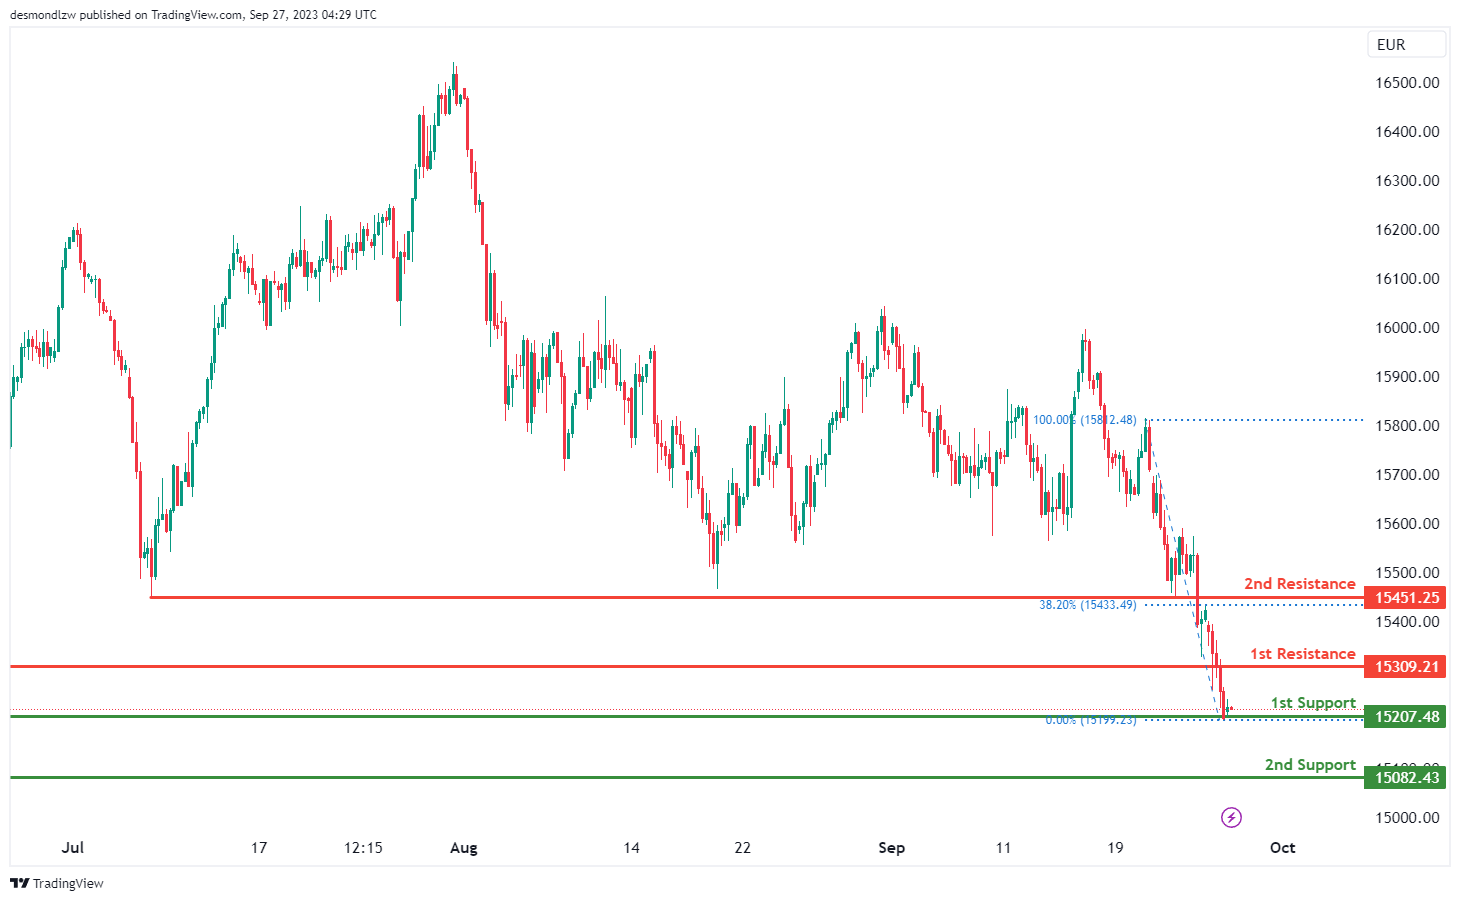
GER30:
The instrument GER30 currently indicates a bullish overall momentum on the chart, and there’s potential for a bullish bounce off the 1st support and a move towards the 1st resistance.
The 1st support at 15201.48 is considered good due to its nature as an overlap support.
The 2nd support at 15082.43 is also notable as it acts as a swing low support.
On the resistance side, we have the 1st resistance at 15309.21, which is significant because it represents a pullback resistance and is associated with the 23.60% Fibonacci Retracement.
Furthermore, the 2nd resistance at 15451.25 is noteworthy as it functions as a pullback resistance and is linked to the 61.80% Fibonacci Retracement.
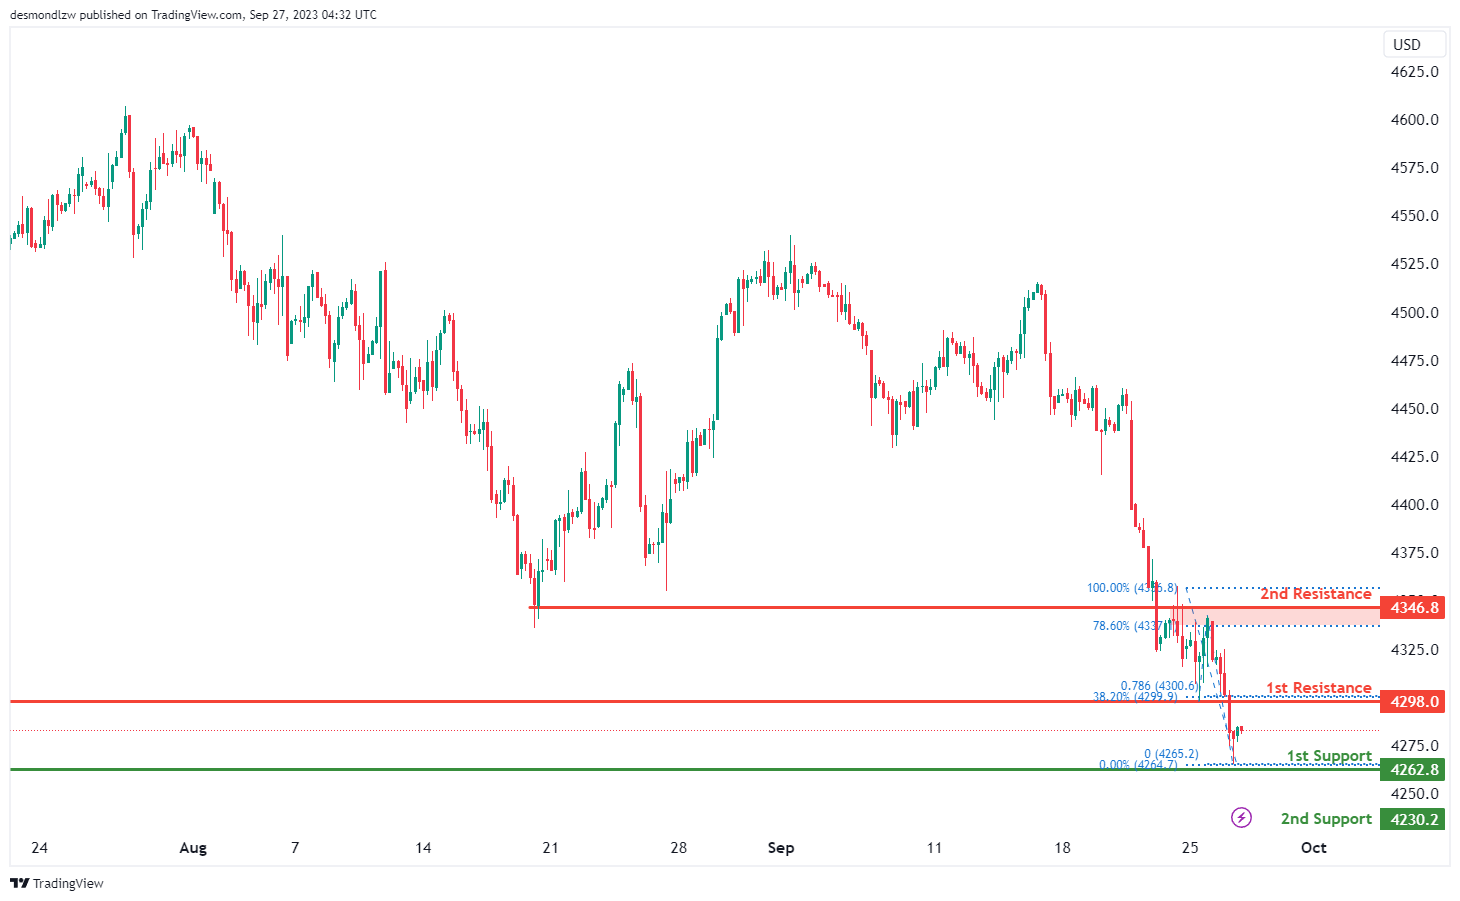
US500
The instrument US500 currently indicates a bearish overall momentum on the chart, and there’s potential for a short-term rise towards the 1st resistance before reversing off it and dropping towards the 1st support.
The 1st support at 4262.8 is considered good due to its nature as a multi-swing low support.
The 2nd support at 4256.0 is also notable as it acts as a pullback support.
On the resistance side, we have the 1st resistance at 4298.0, which is significant because it represents a pullback resistance and is associated with both the 38.20% Fibonacci Retracement and the 78.60% Fibonacci Projection, indicating a potential area of Fibonacci confluence and providing strong resistance.
Similarly, the 2nd resistance at 4346.8 is noteworthy as it functions as an overlap resistance and is linked to the 78.60% Fibonacci Retracement.
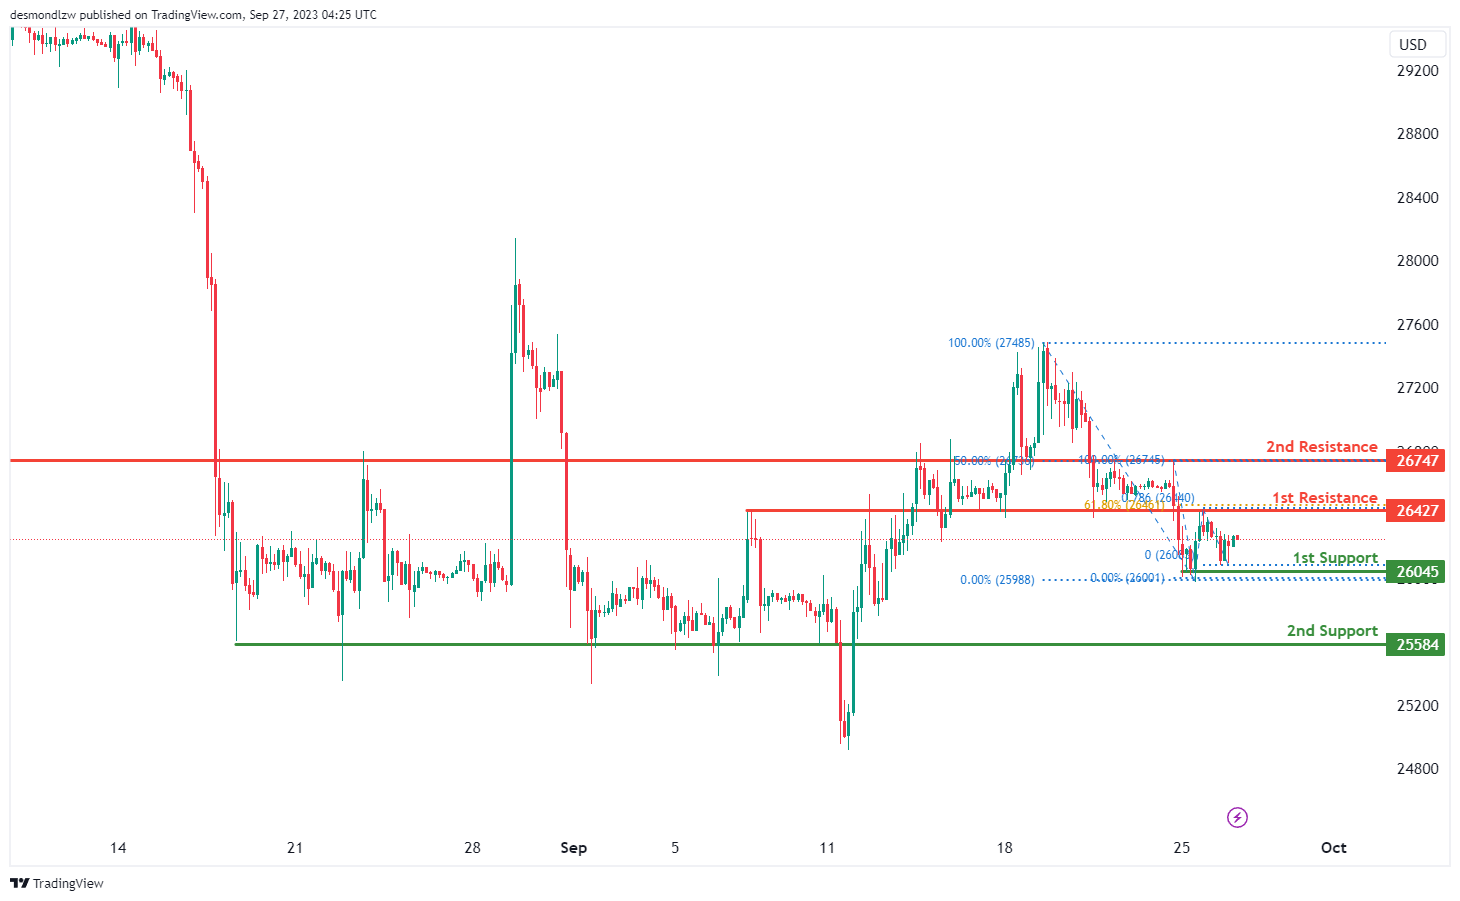
BTC/USD:
The instrument BTC/USD currently indicates a bearish overall momentum on the chart, with factors contributing to this momentum.
There’s potential for the price to make a short-term rise towards the 1st resistance before reversing off it and dropping towards the 1st support.
The 1st support at 26045 is considered good due to its nature as an overlap support.
The 2nd support at 25584 is also notable as it acts as a pullback support.
On the resistance side, we have the 1st resistance at 26427, which is significant because it represents an overlap resistance and is associated with both the 61.80% Fibonacci Retracement and the 78.60% Fibonacci Projection, indicating a potential area of Fibonacci confluence and providing strong resistance.
Similarly, the 2nd resistance at 26747 is noteworthy as it functions as an overlap resistance and is linked to the 50% Fibonacci Retracement, suggesting potential barriers to further bullish movement at these levels and supporting the idea of a reversal off the 1st resistance.
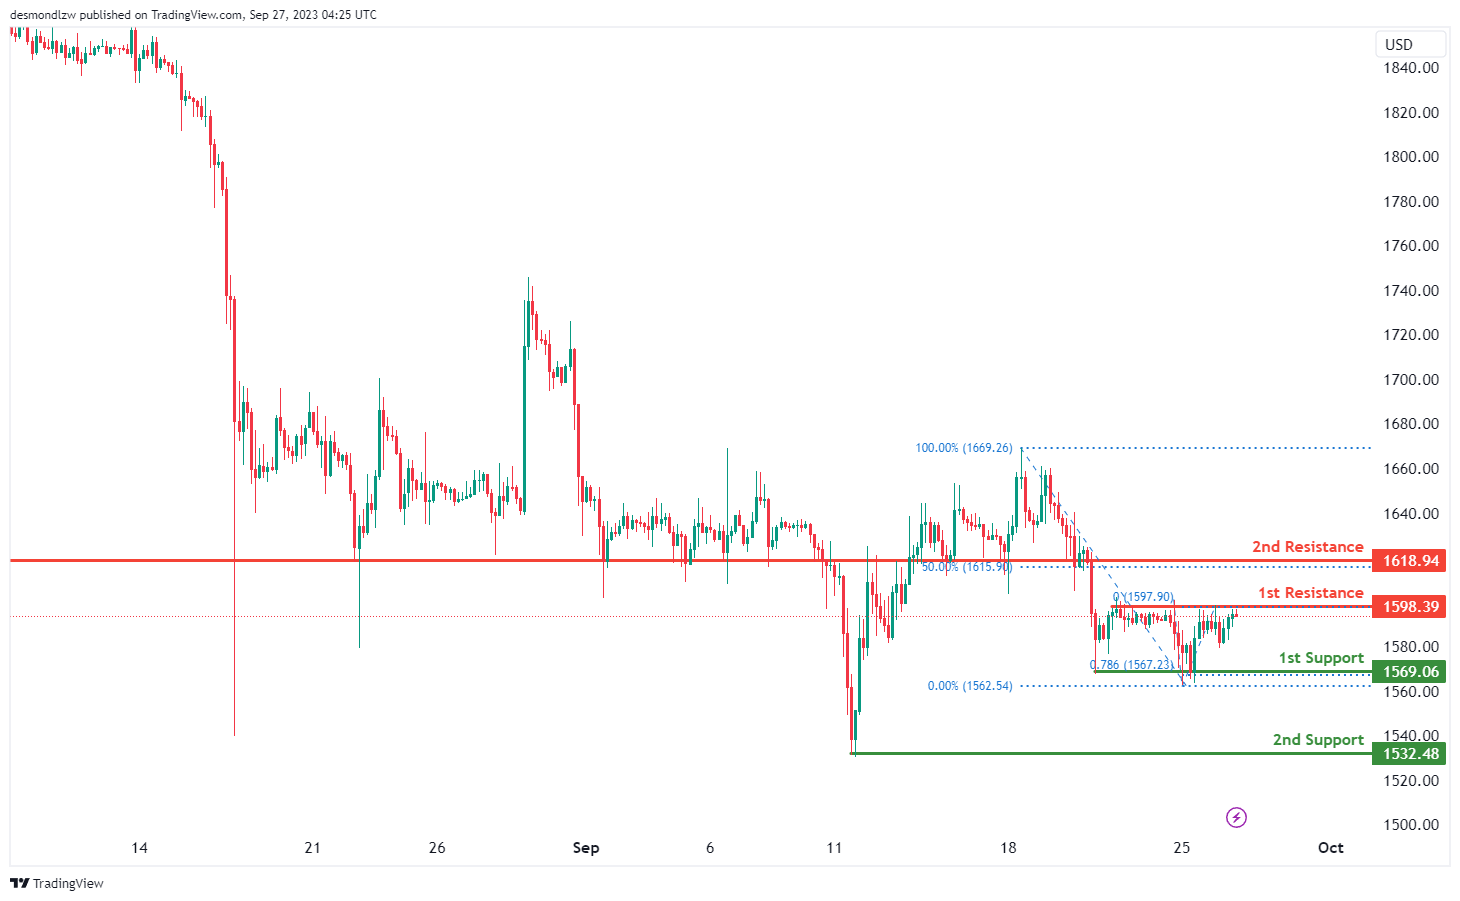
ETH/USD:
The instrument ETH/USD currently indicates a bearish overall momentum on the chart, and there’s potential for a bearish reaction off the 1st resistance and a drop towards the 1st support.
The 1st support at 1569.06 is considered good due to its nature as a multi-swing low support.
The 2nd support at 1532.48 is also notable as it acts as a swing low support.
On the resistance side, we have the 1st resistance at 1598.39, which is significant because it represents a multi-swing high resistance and is associated with the 50% Fibonacci Retracement.
Similarly, the 2nd resistance at 1618.94 is noteworthy as it functions as a pullback resistance and is linked to the 50% Fibonacci Retracement.
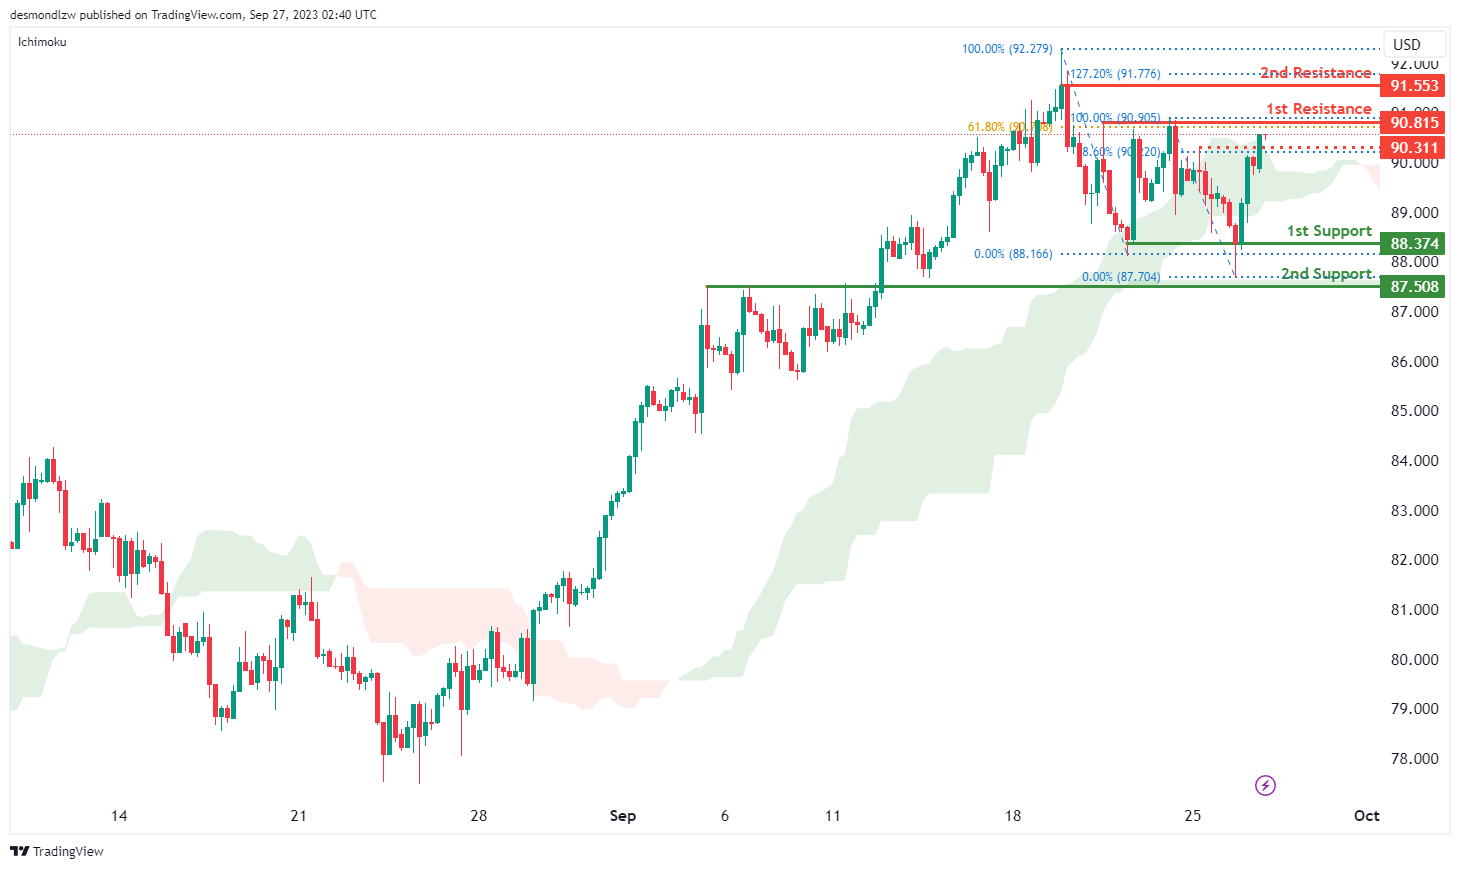
WTI/USD:
The WTI (West Texas Intermediate) chart currently exhibits a bullish momentum with price potentially breaking above the intermediate resistance level and making a bullish continuation towards the 1st resistance level.
The intermediate resistance level at 90.31 is identified as a pullback resistance that aligns with the 78.60% Fibonacci retracement level while the the 1st resistance level at 90.82 is also noted as a pullback resistance that aligns with the 61.80% Fibonacci retracement level. Additionally, the 2nd resistance level at 91.55 is marked as a swing-high resistance that aligns with the 127.20% Fibonacci extension level.
To the downside, the 1st support level at 88.37 is identified as a pullback support while the 2nd support level at 87.51 is also marked as a pullback support, suggesting a potential strong support level in the past.
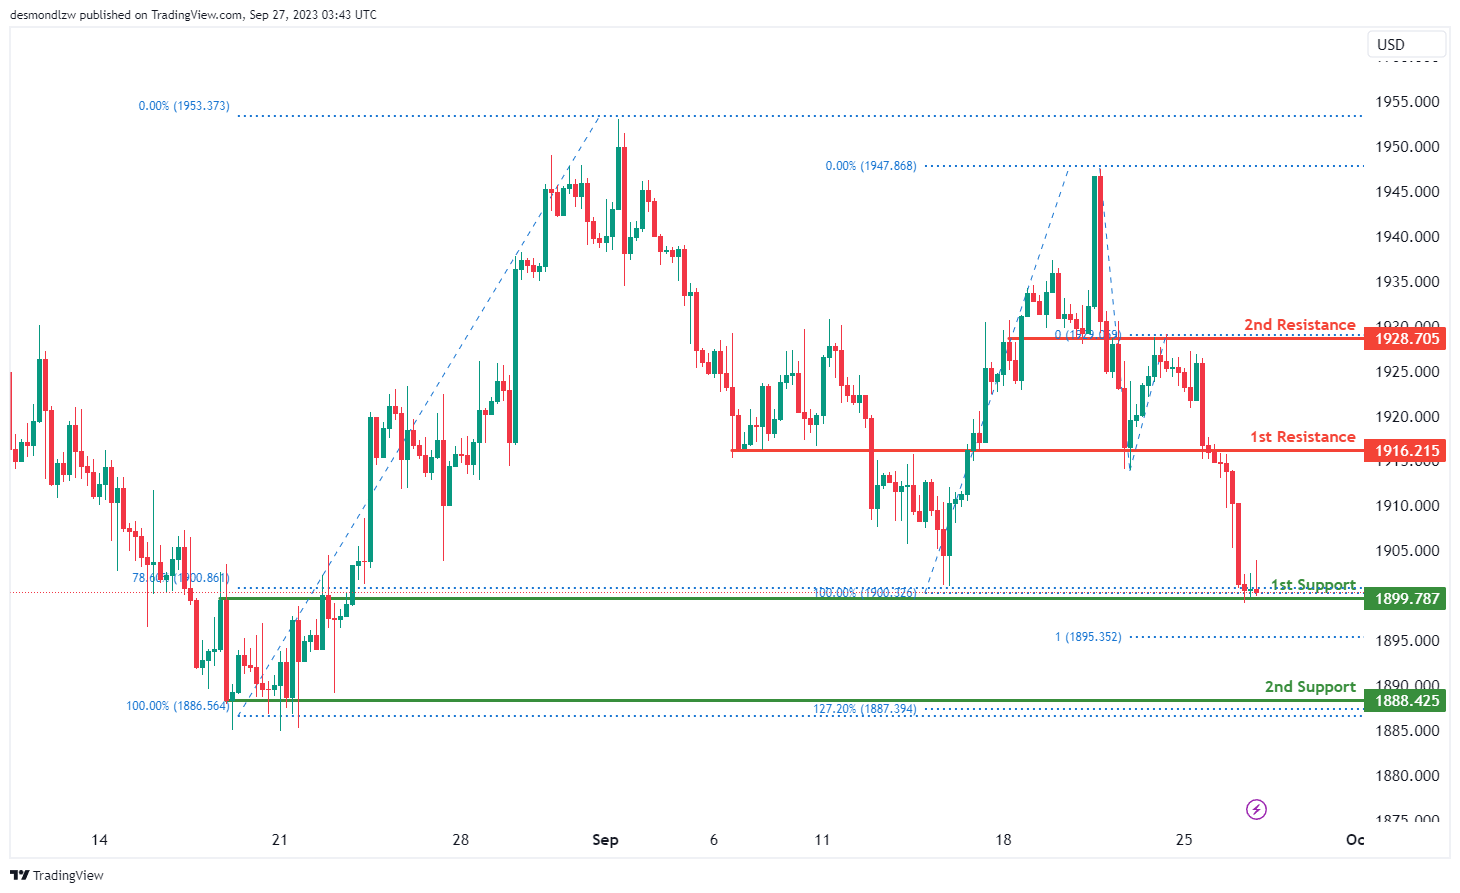
XAU/USD (GOLD):
The XAUUSD chart currently signals bullish momentum, anticipating a potential bullish bounce off the 1st support heading towards the 1st resistance. The 1st support is set at 1899.78, acting as an overlap support and aligning with the 78.60% Fibonacci Retracement, underlining its significant supportive role. Furthermore, the 2nd support is located at 1888.42, distinguished as a multi-swing low support and coinciding with the 127.20% Fibonacci Extension, amplifying its importance.
On the flip side, resistance levels are mapped out with the 1st resistance at 1915.43, identified as a pullback resistance, playing a crucial role in potential price reversal scenarios. Beyond this, the 2nd resistance is pegged at 1928.70, acknowledged as an overlap resistance.


