
DXY:
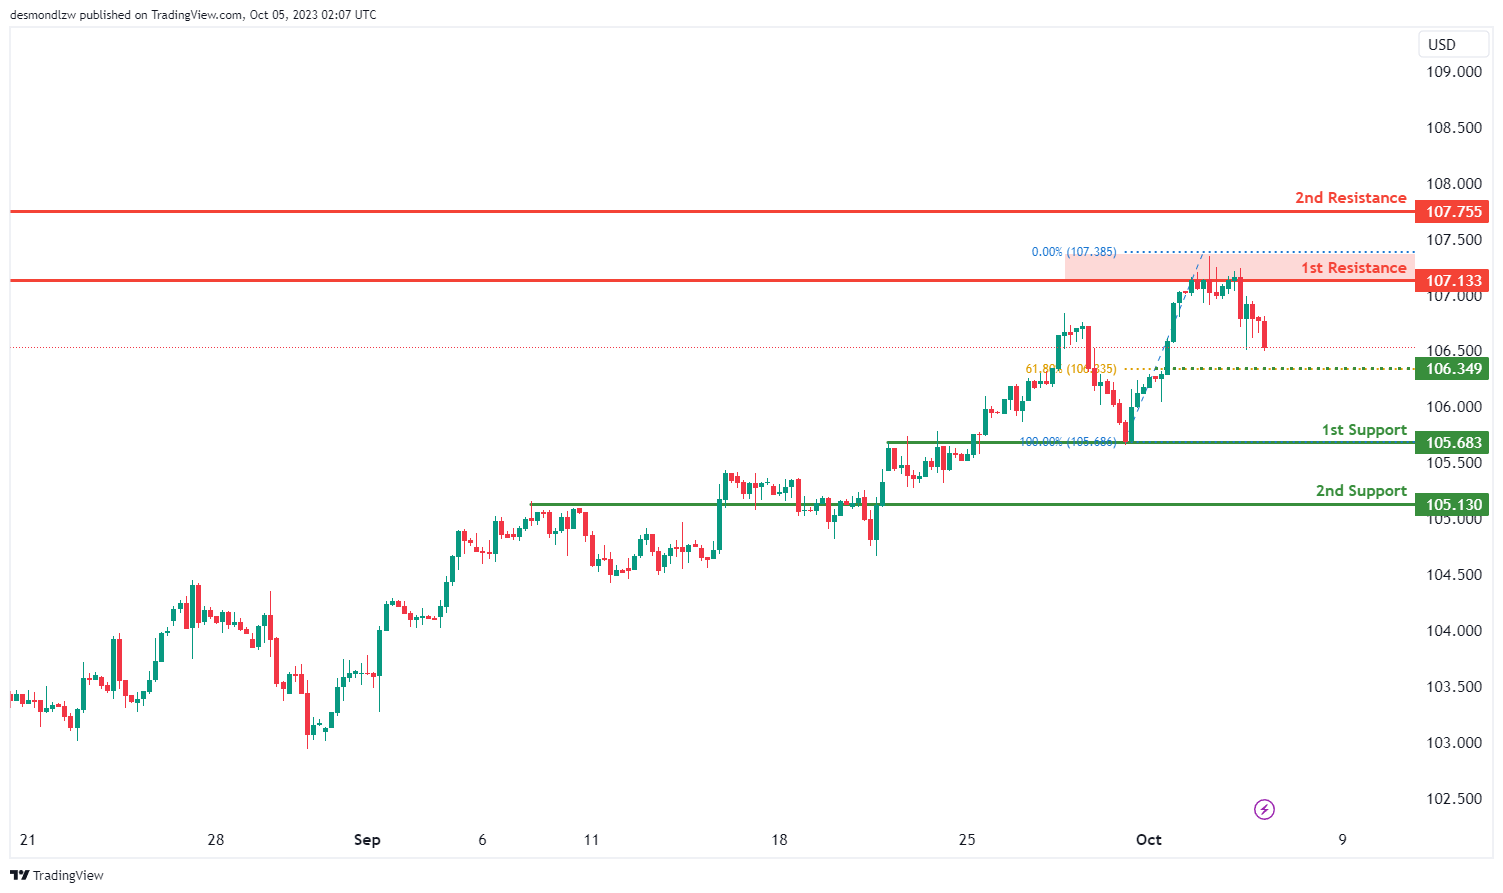
The DXY (US Dollar Index) chart currently exhibits a bearish momentum, and there’s a potential scenario of a bearish continuation towards the 1st support level at 105.68, which is considered significant as it’s identified as an overlap support.
The 2nd support at 105.13 is also notable as a pullback support, further reinforcing its potential role as a support level.
On the resistance side, the 1st resistance level at 107.13 is characterized as a multi-swing high resistance, which suggests it could act as a barrier to upward movements.
Additionally, there’s an intermediate support level at 106.34, which is identified as a pullback support.
EUR/USD:
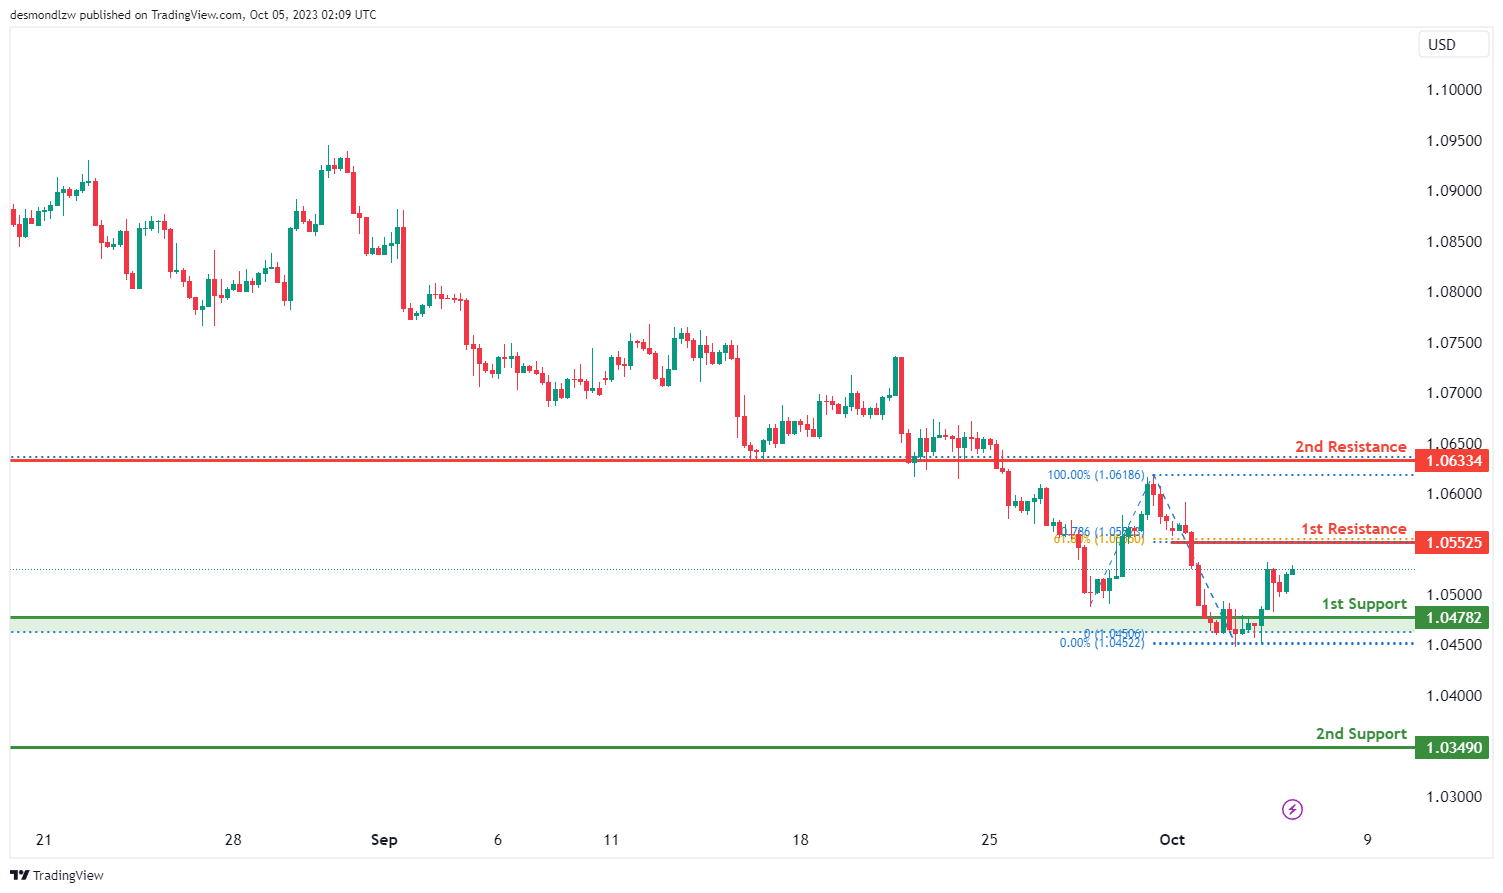
The EUR/USD chart currently exhibits bullish momentum, and there’s a potential scenario of a bullish continuation towards the 1st resistance level at 1.0552. This level is considered significant as it aligns with both the 61.80% Fibonacci Retracement and the 78.60% Fibonacci Projection, indicating a potential Fibonacci confluence.
The 1st support at 1.0478 is another notable level, characterized as a multi-swing low support, which suggests it could provide support in case of a price pullback.
Additionally, the 2nd support at 1.0349 is identified as a swing low support, further reinforcing its importance as a potential support level.
EUR/JPY:
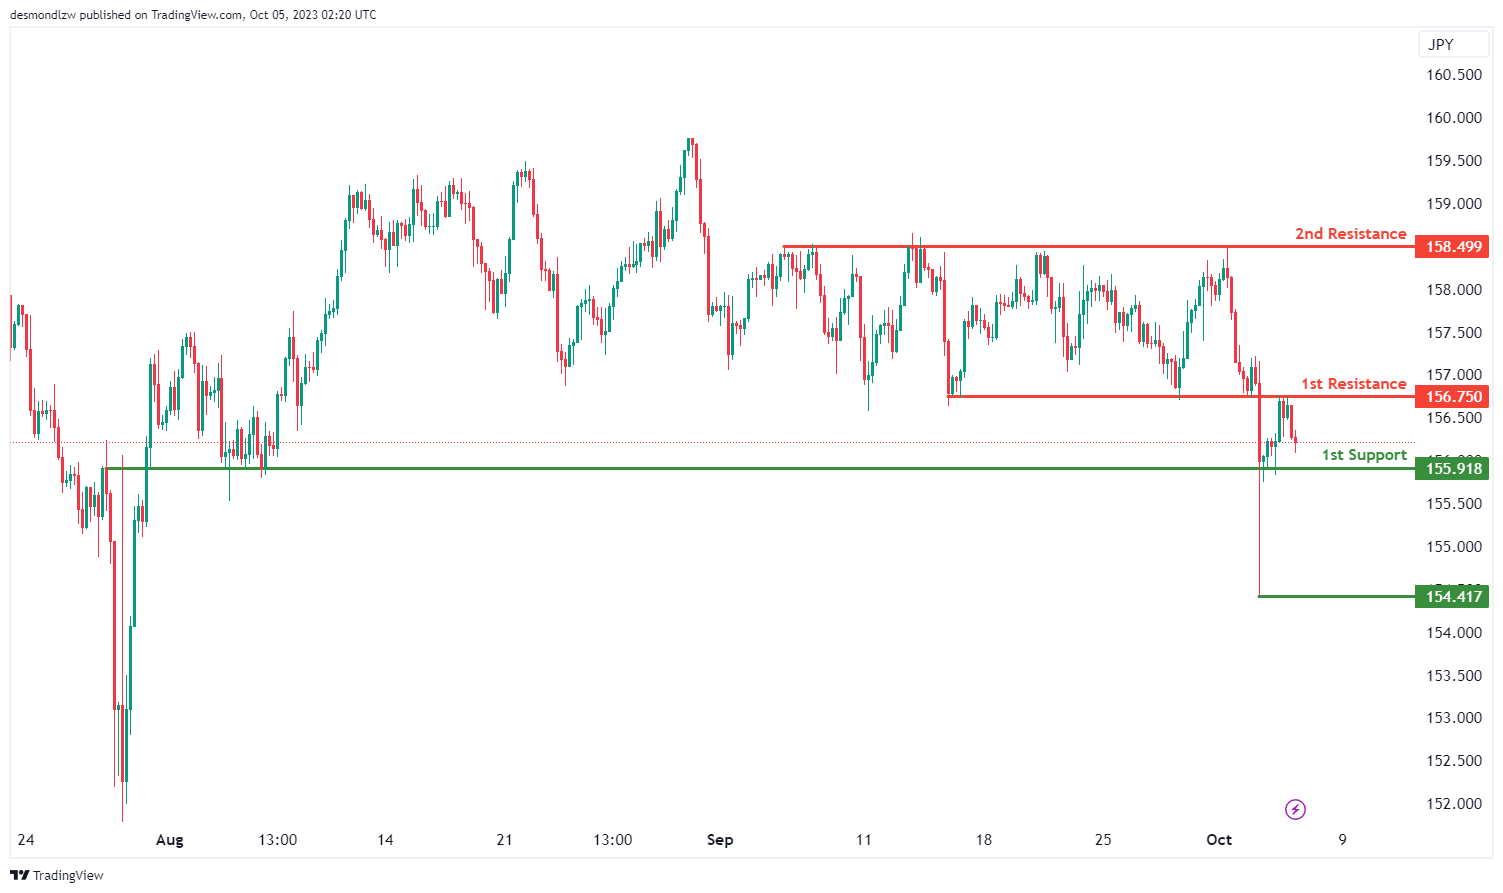
The EUR/JPY chart currently exhibits bearish overall momentum, and there’s a potential scenario of a bearish continuation towards the 1st support level.
The 1st support at 155.91 is considered significant as it’s identified as an overlap support, making it a crucial level for potential price support. Additionally, the 2nd support at 154.41 is categorized as a swing low support, further reinforcing its importance as a potential zone where the price may find support.
On the resistance side, the 1st resistance level at 156.75 is recognized as an overlap resistance, suggesting it may act as a barrier to price increases. Beyond this, the 2nd resistance at 158.49 is identified as a multi-swing high resistance, emphasizing its significance in potential price reversals.
EUR/GBP:
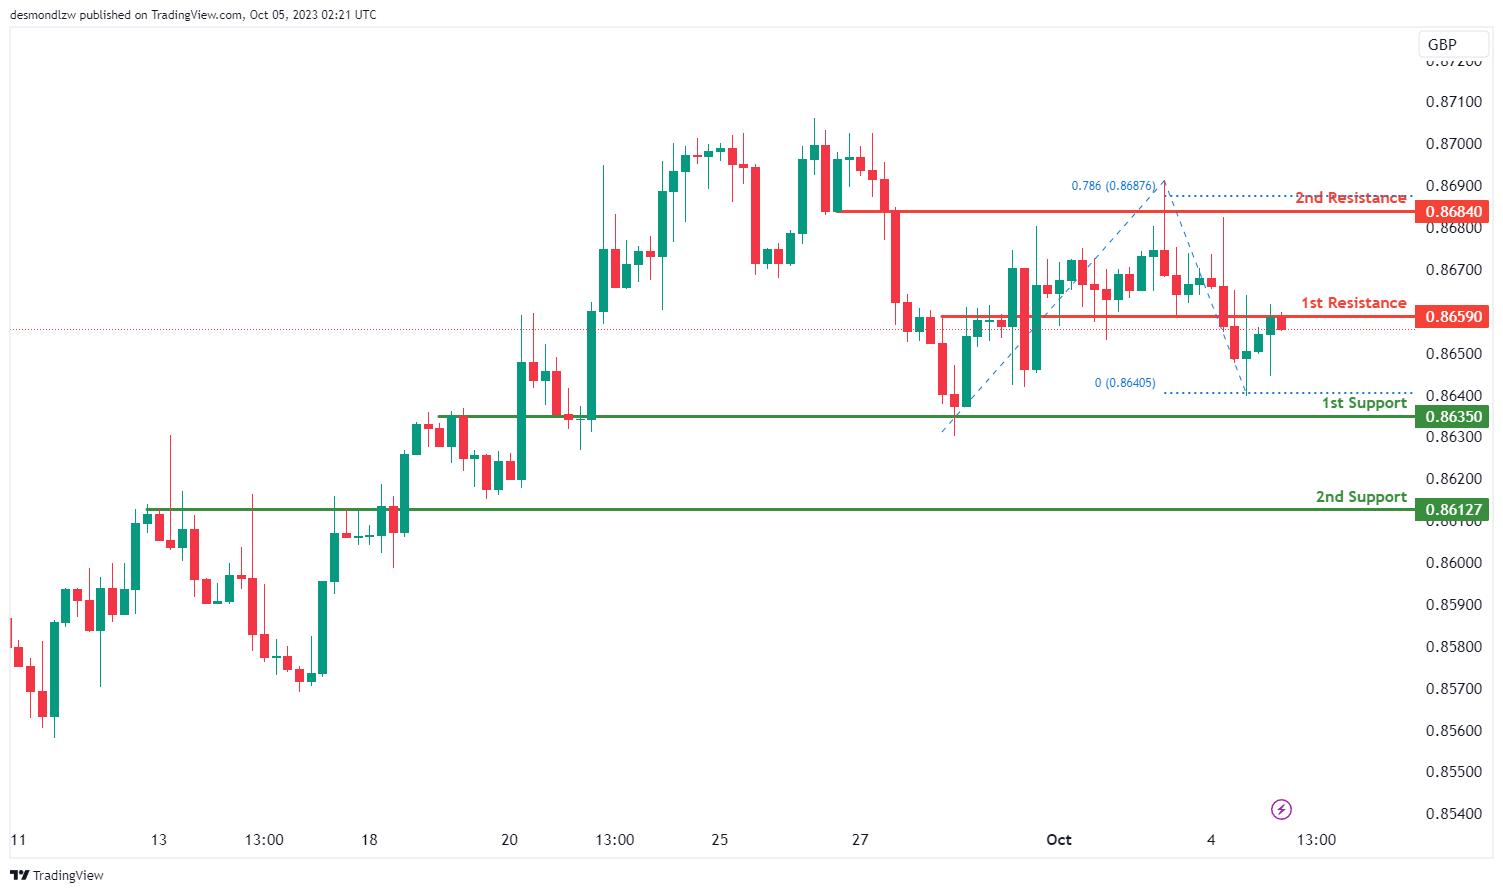
The EUR/GBP chart currently exhibits a bearish overall momentum, and there’s a potential scenario of a bearish reaction off the 1st resistance level towards the 1st support level.
The 1st support at 0.8635 is considered significant as it’s identified as an overlap support, making it a crucial level for potential price support. Furthermore, the 2nd support at 0.8612 is also categorized as an overlap support, reinforcing its importance as a potential zone where the price may find support.
On the resistance side, the 1st resistance level at 0.8659 is recognized as an overlap resistance, suggesting it may act as a barrier to price increases. Similarly, the 2nd resistance at 0.8684 is also identified as an overlap resistance, further emphasizing its significance in potential price reversals.
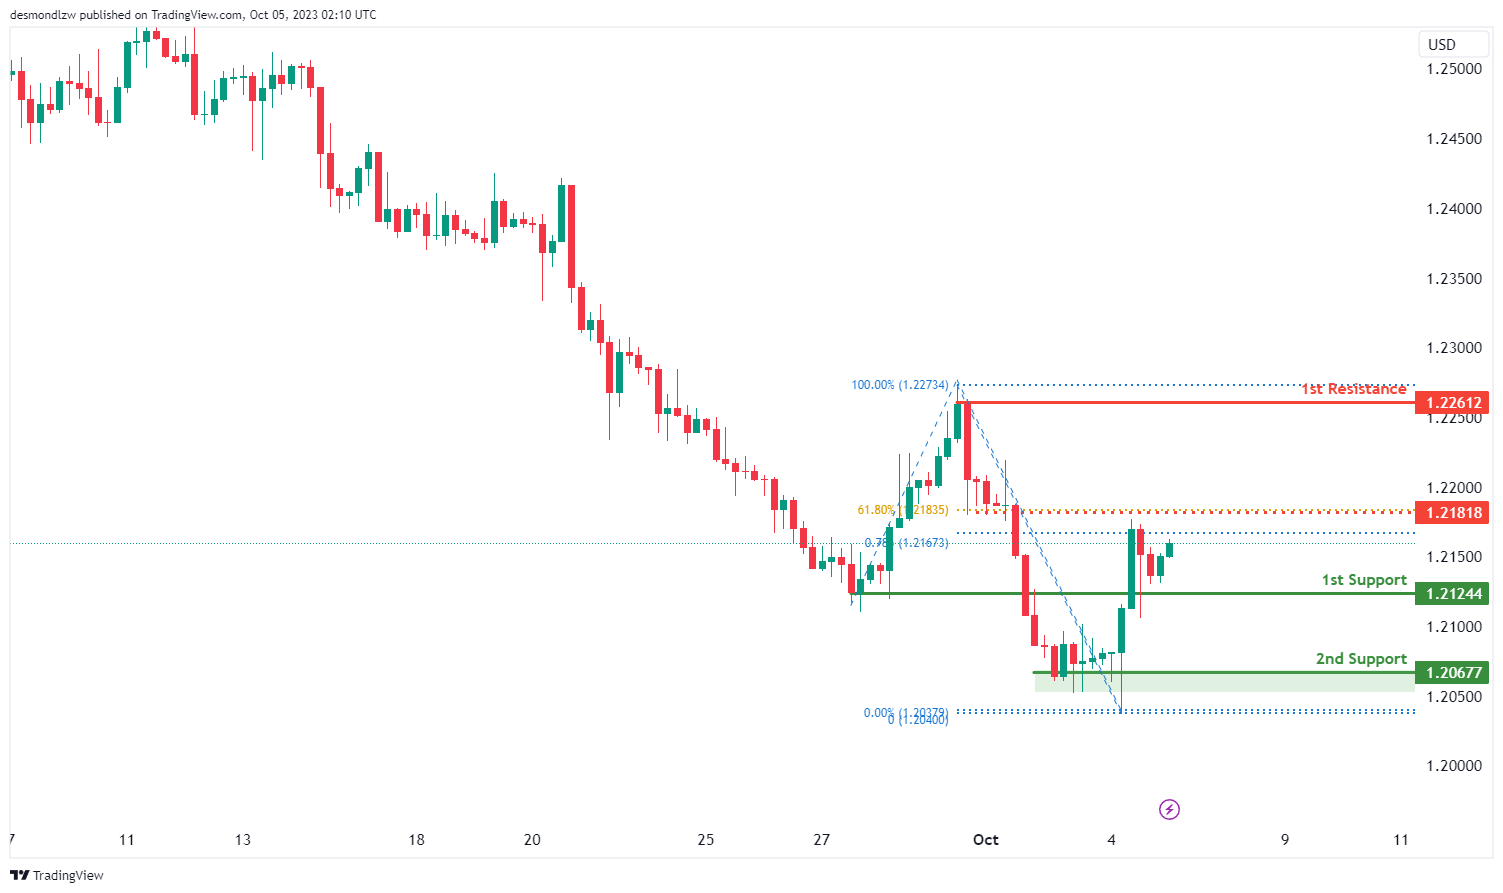
GBP/USD:
The GBP/USD chart currently maintains a bullish momentum, with the potential scenario of a bullish continuation towards the 1st resistance level at 1.2261. This level is identified as a swing high resistance, suggesting it could act as a barrier to further price increases.
Support levels are also in play, with the 1st support at 1.2124 categorized as an overlap support, reinforcing its significance as a potential level where the price may find support. Additionally, the 2nd support at 1.2067 is characterized as a multi-swing low support, further highlighting its importance as a potential support zone.
An intermediate resistance level at 1.2181 is identified as an overlap resistance and is supported by the 61.80% Fibonacci Retracement, which could potentially influence price movements.
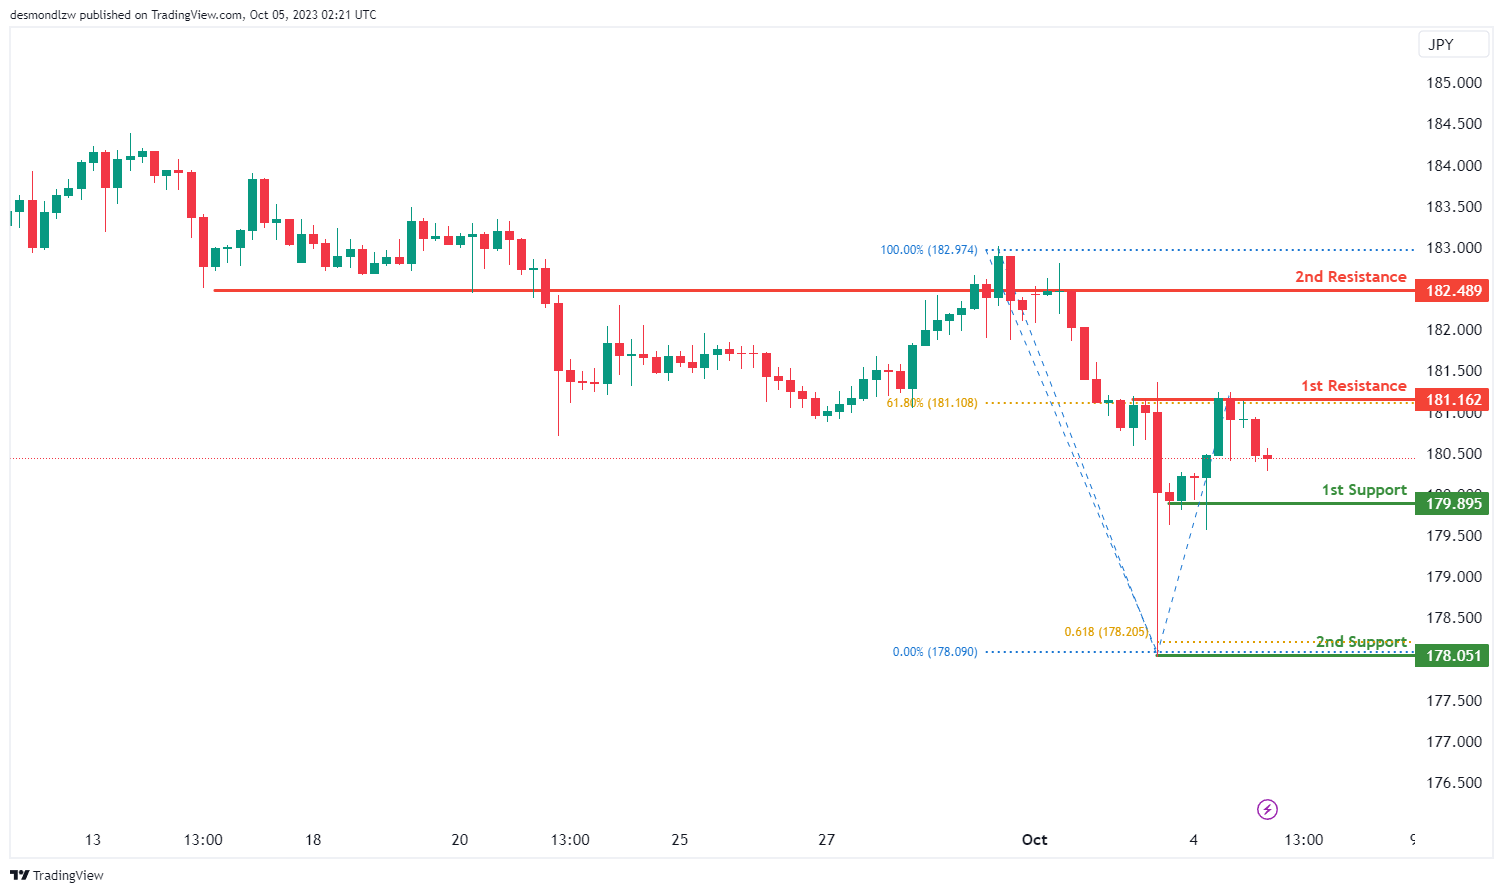
GBP/JPY:
The GBP/JPY chart currently maintains a bearish overall momentum, and there’s a potential scenario of a bearish continuation towards the 1st support level.
The 1st support at 179.89 is considered significant as it’s identified as a multi-swing low support, making it an important level for potential price support. Additionally, the 2nd support at 178.05 is categorized as a swing low support and is reinforced by the presence of the 61.80% Fibonacci Projection, further emphasizing its significance as a potential support level.
On the resistance side, the 1st resistance level at 181.16 is characterized as a multi-swing high resistance and coincides with the 61.80% Fibonacci Retracement, suggesting it may act as a barrier to bullish movements. Beyond this, the 2nd resistance at 182.48 is identified as an overlap resistance, indicating its potential role as a resistance level.
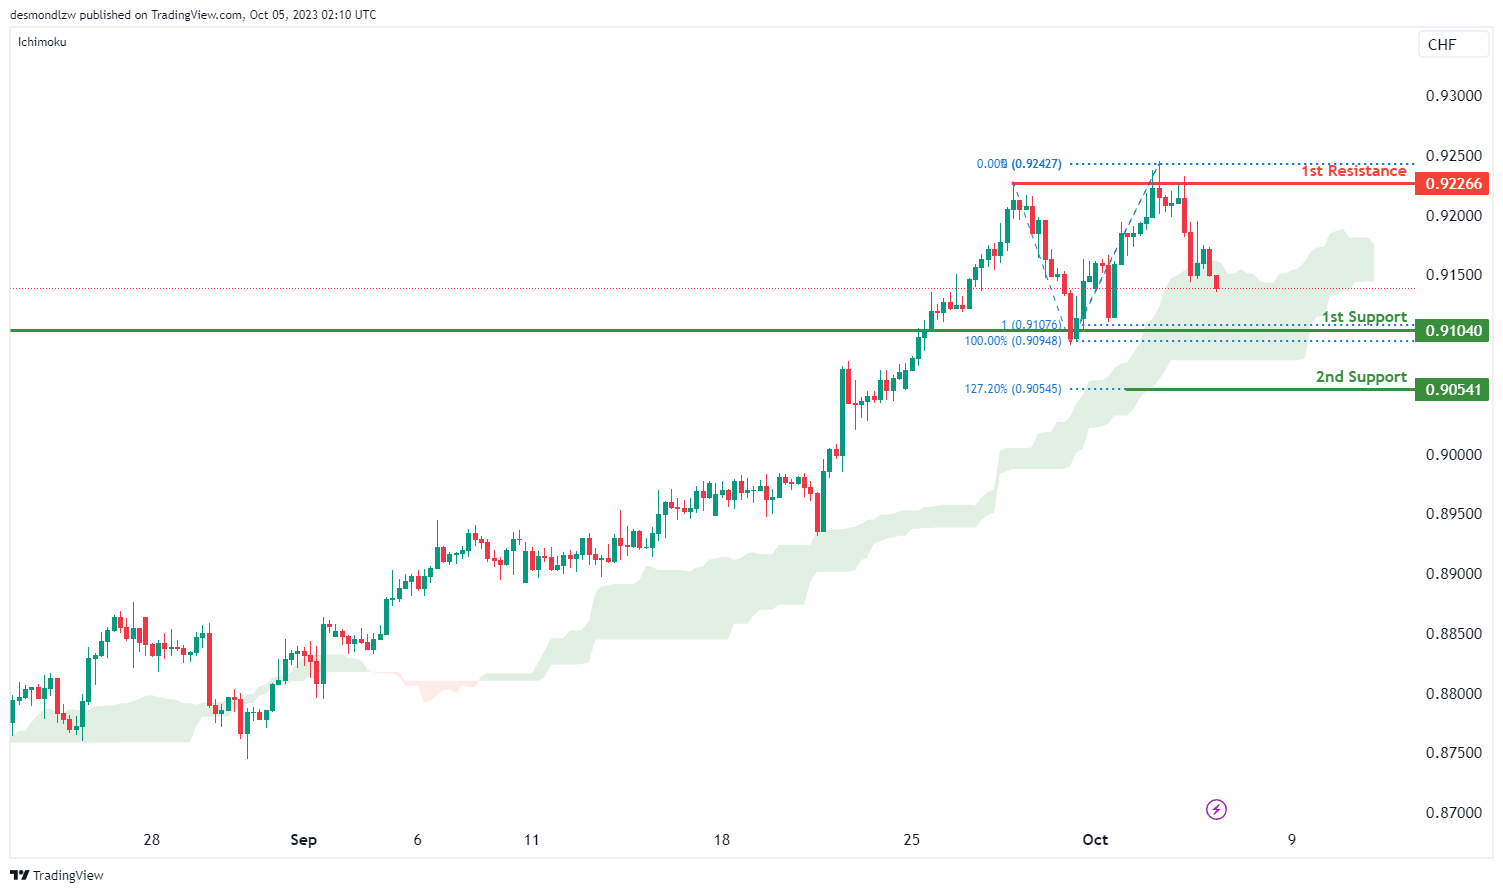
USD/CHF:
The USD/CHF chart currently exhibits a bearish momentum, with several factors contributing to this direction. One key factor is that the price is within the bearish Ichimoku cloud, which typically suggests that a reversal might occur from this area.
There is a potential scenario of a bearish continuation towards the 1st support level at 0.9104. This support is considered significant due to the presence of the 100% Fibonacci Projection, further reinforcing its importance as a potential level where price may find support. Additionally, the 2nd support at 0.9054 is identified as an overlap support and is supported by the 127.20% Fibonacci Extension, making it another noteworthy level for potential price reversals.
On the resistance side, the 1st resistance level at 0.9226 is marked as a multi-swing high resistance, which could act as a barrier to upward movements.
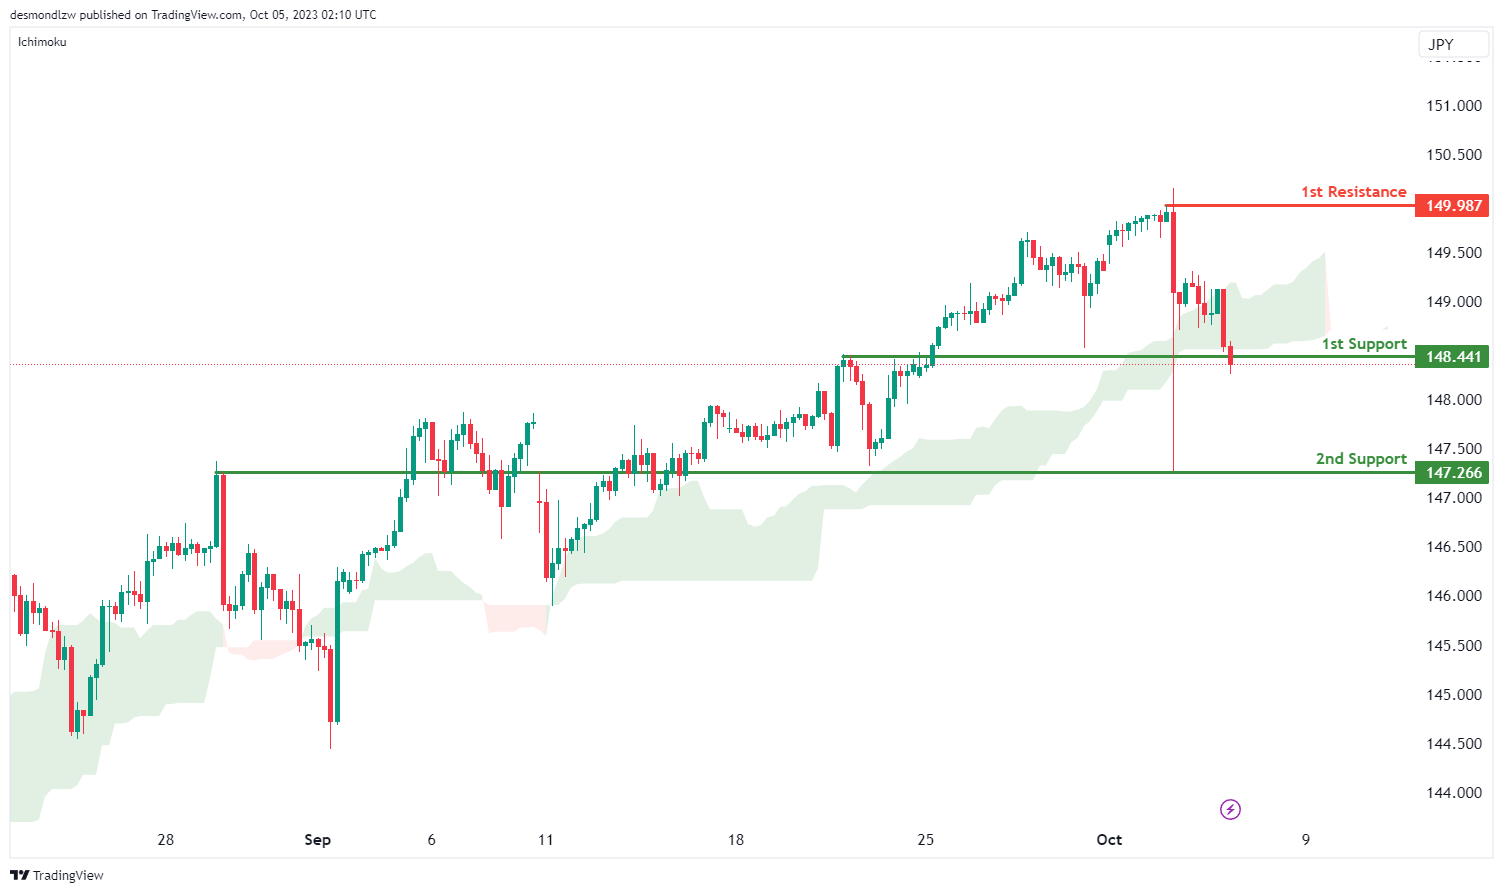
USD/JPY:
The USD/JPY chart is currently displaying a bearish momentum, with one significant contributing factor being that the price has crossed below the Ichimoku cloud. Given this context, there is a potential scenario where price could experience a bearish break off the 1st support level and drop towards the 2nd support.
The 1st support at 148.44 is considered a pullback support and could be a crucial level for potential price support. Additionally, the 2nd support at 147.26 is identified as an overlap support, reinforcing its significance as a potential zone where price may find support.
On the resistance side, the 1st resistance level at 149.98 is marked as a swing high resistance, which could act as a barrier to upward movements.
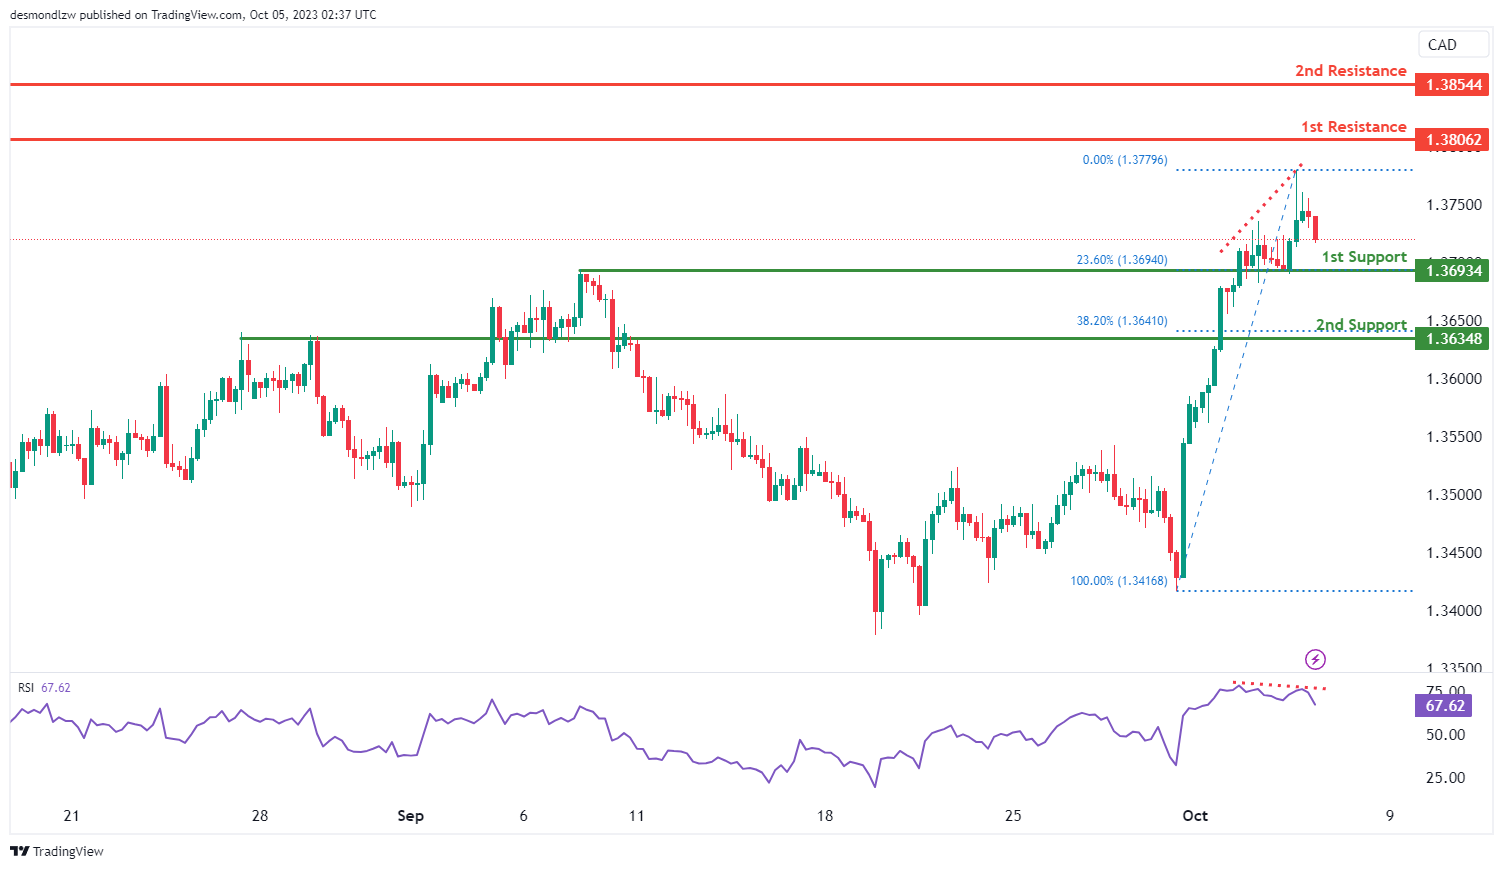
USD/CAD:
The USD/CAD chart is currently showing an overall bearish momentum suggesting the possibility of a bearish continuation towards the 1st support, supported by the Relative Strength Index (RSI) which is highlighting a bearish divergence versus price action.
The 1st support level at 1.3693 is identified as an overlap support that aligns with the 23.60% Fibonacci retracement level. Additionally, the 2nd support level at 1.3634 is also noted as an overlap support that aligns with the 38.20% Fibonacci retracement level, further reinforcing its importance.
To the upside, the 1st resistance level at 1.3806 is identified as a pullback resistance while the 2nd resistance level at 1.3854 is also marked as a pullback resistance.
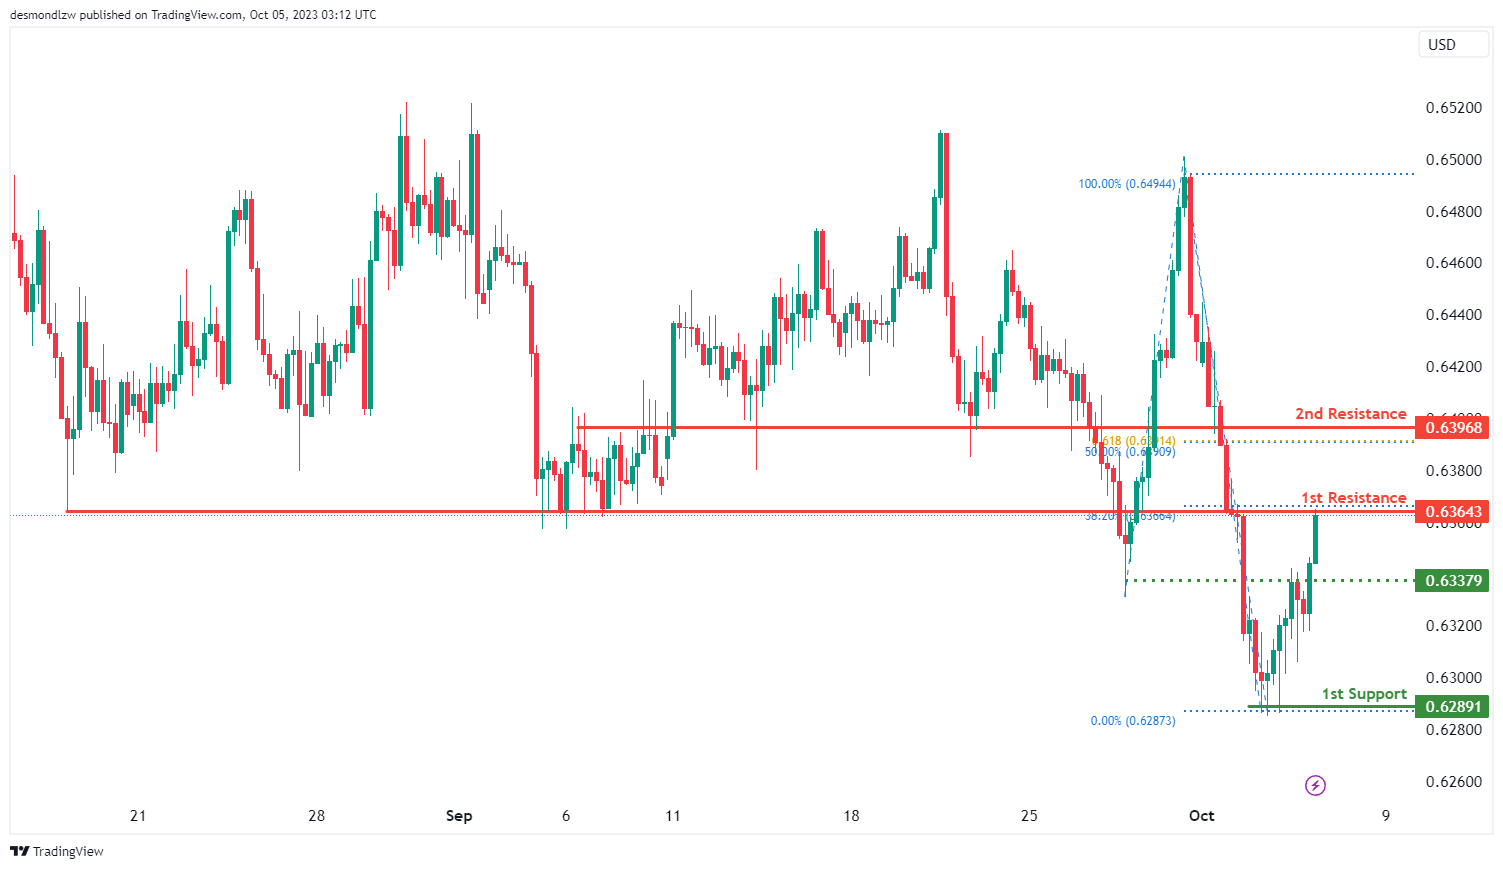
AUD/USD:
The AUD/USD chart currently exhibits an overall bullish momentum with a potential scenario of a bullish continuation towards the 1st resistance level.
The 1st resistance level at 0.6364 is identified as a pullback resistance that aligns with the 38.20% Fibonacci retracement level. Further up, the 2nd resistance level at 0.6397 is marked as an overlap resistance that aligns with a confluence of Fibonacci levels i.e. the 50% retracement and the 61.80% projection levels.
To the downside, the intermediate support level at 0.6338 is identified as an overlap support while the 1st support level at 0.6289 is marked as a swing-low support, reinforcing its importance as a potential support level.
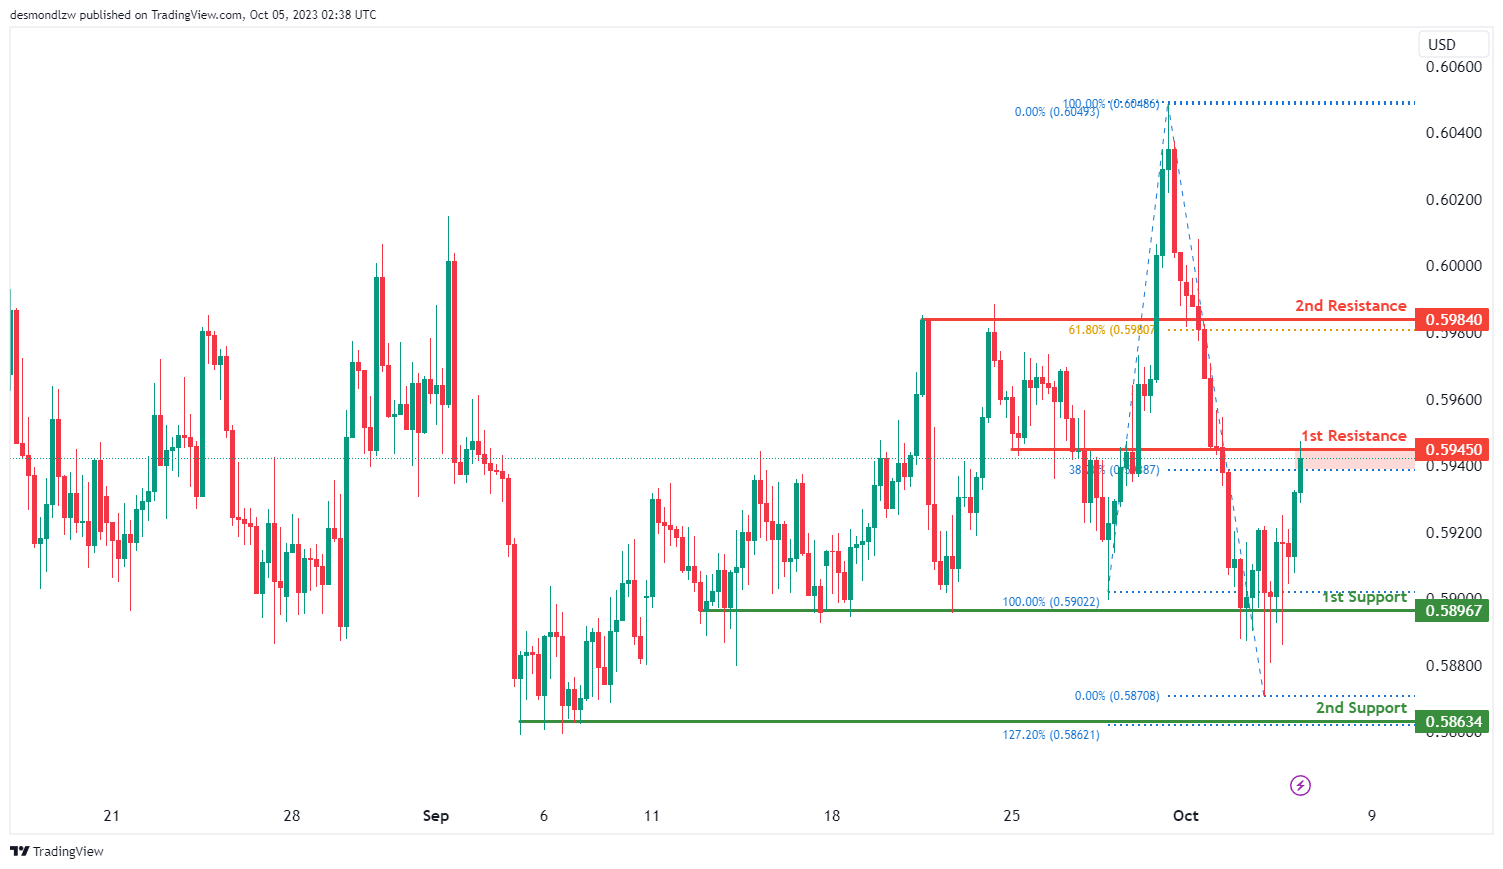
NZD/USD
The NZD/USD chart currently exhibits an overall bullish momentum with a potential scenario of a bullish continuation towards the 1st resistance level.
The 1st resistance level at 0.5945 is identified as an overlap resistance that aligns close to the 38.20% Fibonacci retracement level. Additionally, the 2nd resistance level at 0.5984 is marked as a pullback resistance that aligns with the 61.80% Fibonacci Retracement, further emphasizing its significance as a barrier for future price increases..
To the downside, the 1st support level at 0.5897 is identified as a pullback support while the 2nd support level at 0.5863 is also noted as pullback support that coincides with the 127.20% Fibonacci extension level.
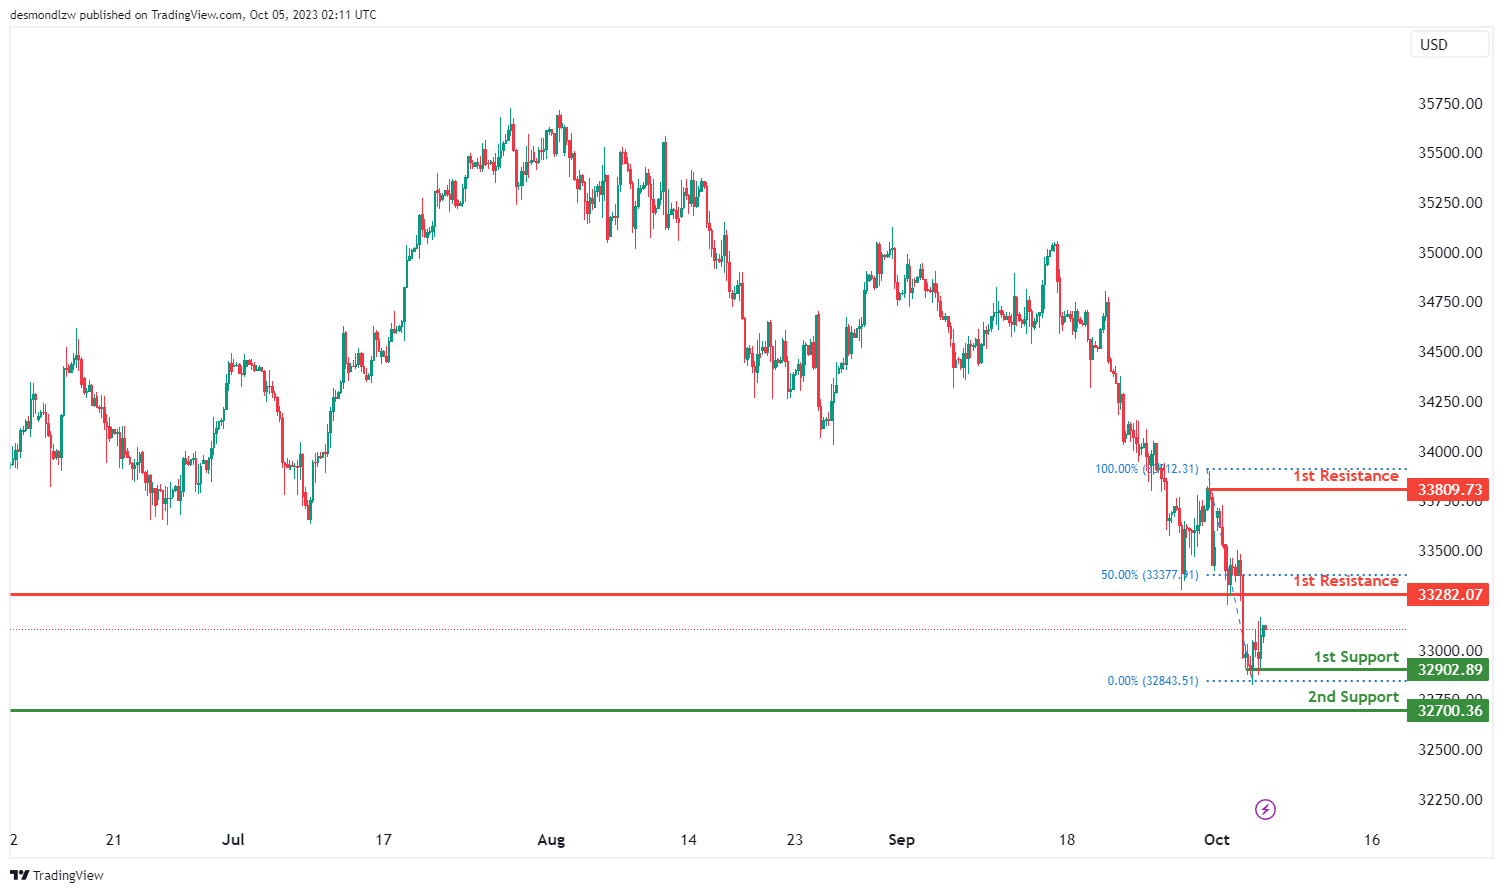
DJ30:
The DJ30 (Dow Jones Industrial Average) chart currently exhibits a bullish overall momentum, and there’s a potential scenario of a bullish continuation towards the 1st resistance level.
The 1st support at 32902.89 is considered significant as it’s identified as a multi-swing low support, making it an important level for potential price support. Additionally, the 2nd support at 37700.36 is also categorized as a multi-swing low support, reinforcing its significance as a potential support zone.
On the resistance side, the 1st resistance level at 33282.07 is marked as a pullback resistance, potentially limiting upward movements. Beyond this, the 2nd resistance at 33809.73 is identified as a swing high resistance, further emphasizing its significance in potential price reversals.
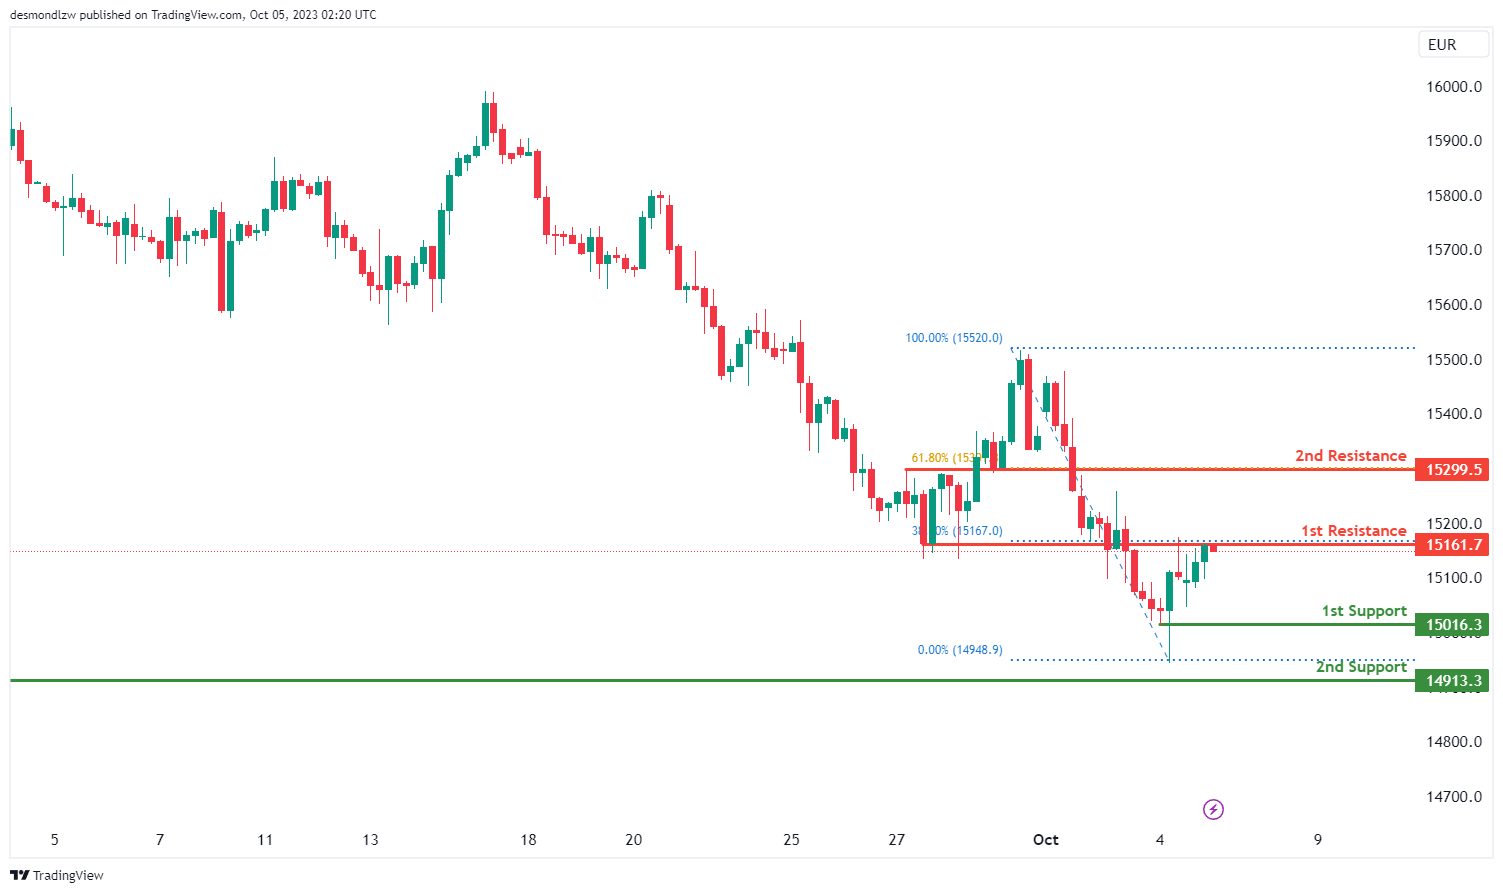
GER40:
The GER40 (DAX 30) chart currently has a bearish overall momentum, and there’s a potential scenario where the price could react bearishly off the 1st resistance level and drop towards the 1st support level.
The 1st support at 15016.30 is identified as a swing low support, making it a significant level for potential price support. Additionally, the 2nd support at 14913.30 is also marked as a swing low support, reinforcing its importance as a potential level where the price may find support.
On the resistance side, the 1st resistance level at 15161.70 is characterized as an overlap resistance and is accompanied by the presence of a 38.20% Fibonacci Retracement level, suggesting it may act as a barrier to price increases. Beyond this, the 2nd resistance at 15299.50 is identified as a pullback resistance and is associated with a 61.80% Fibonacci Retracement level.
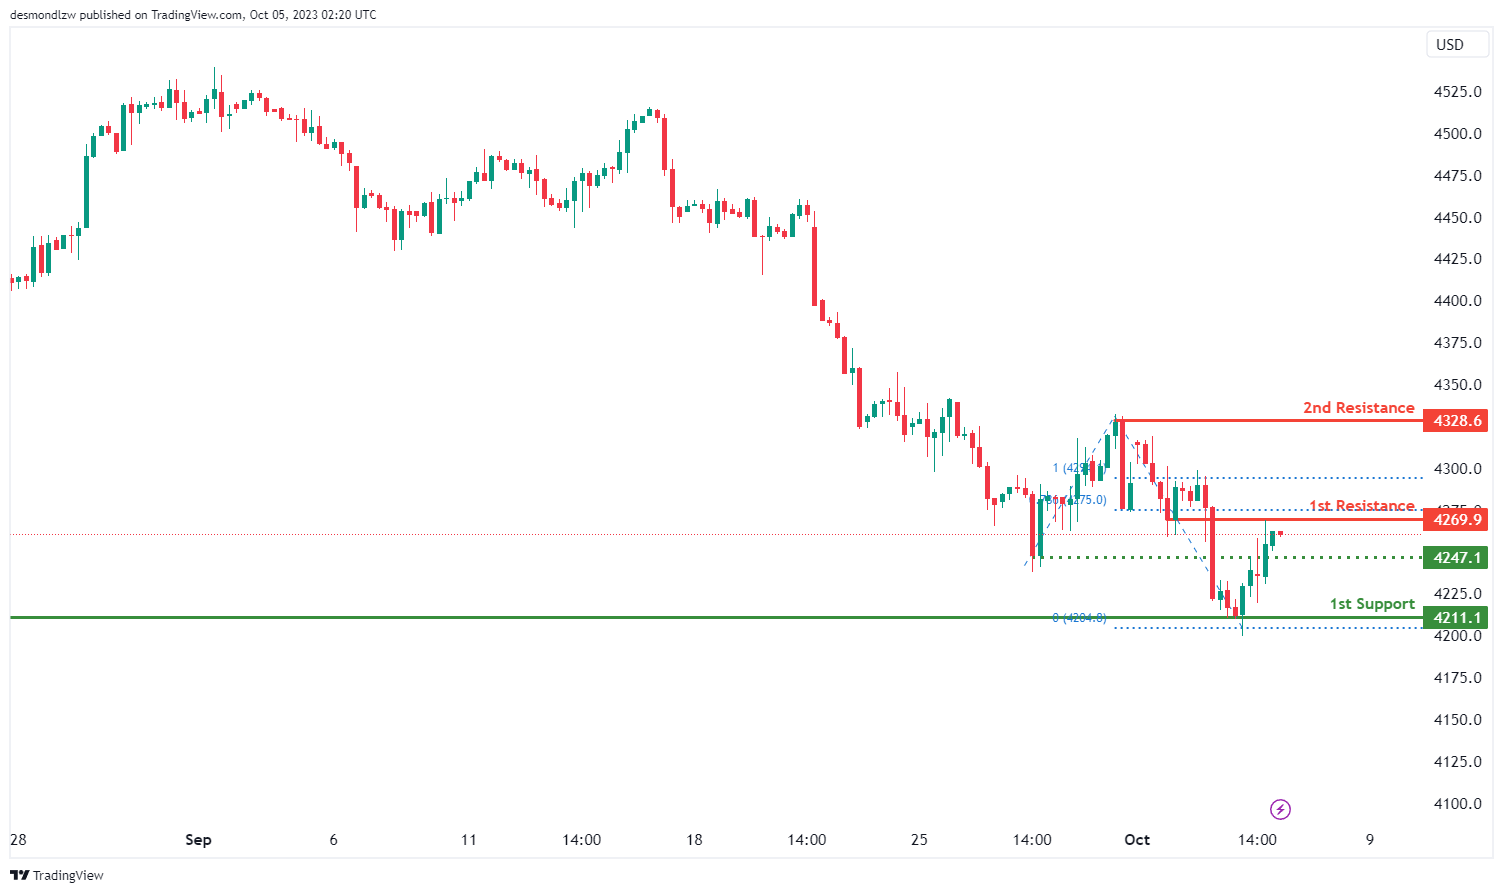
US500
The US500 (S&P 500) chart currently exhibits a bearish overall momentum, and there’s a potential scenario where the price could react bearishly off the 1st resistance level and drop towards the 1st support level.
The 1st support at 4211.1 is identified as a swing low support, making it a noteworthy level for potential price support. Additionally, there is an intermediate support at 4247.1, marked as a pullback support, further reinforcing its significance as a potential level where the price may find support.
On the resistance side, the 1st resistance level at 4269.9 is characterized as an overlap resistance and is accompanied by the presence of a 78.60% Fibonacci Projection level, suggesting it may act as a barrier to price increases. Beyond this, the 2nd resistance at 4328.6 is identified as a swing high resistance.
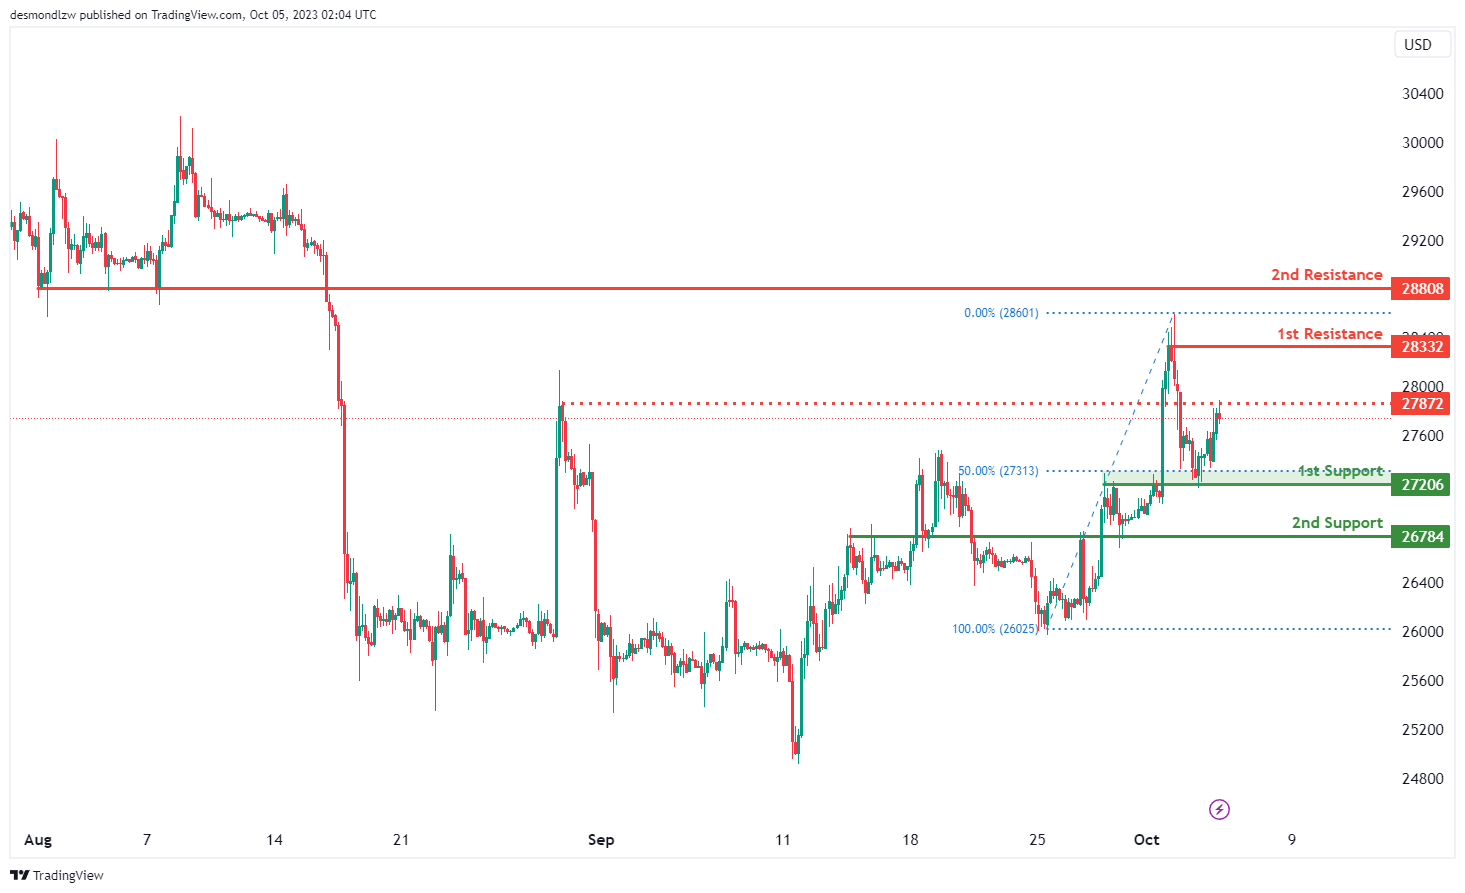
BTC/USD:
The BTC/USD (Bitcoin/US Dollar) chart currently has a bearish overall momentum, and there’s a potential scenario where the price could continue its bearish movement towards the 1st support level.
The 1st support at 27206 is considered significant as it’s identified as an overlap support and is accompanied by a 50% Fibonacci Retracement level, suggesting potential price support. Additionally, the 2nd support at 26784 is categorized as an overlap support, reinforcing its importance as a potential level where the price may find support.
On the resistance side, the 1st resistance level at 28332 is marked as a swing high resistance. Beyond this, the 2nd resistance at 28808 is identified as a pullback resistance, indicating it may act as a barrier to the price’s upward movement. There is also an intermediate resistance at 27872, which is marked as an overlap resistance.
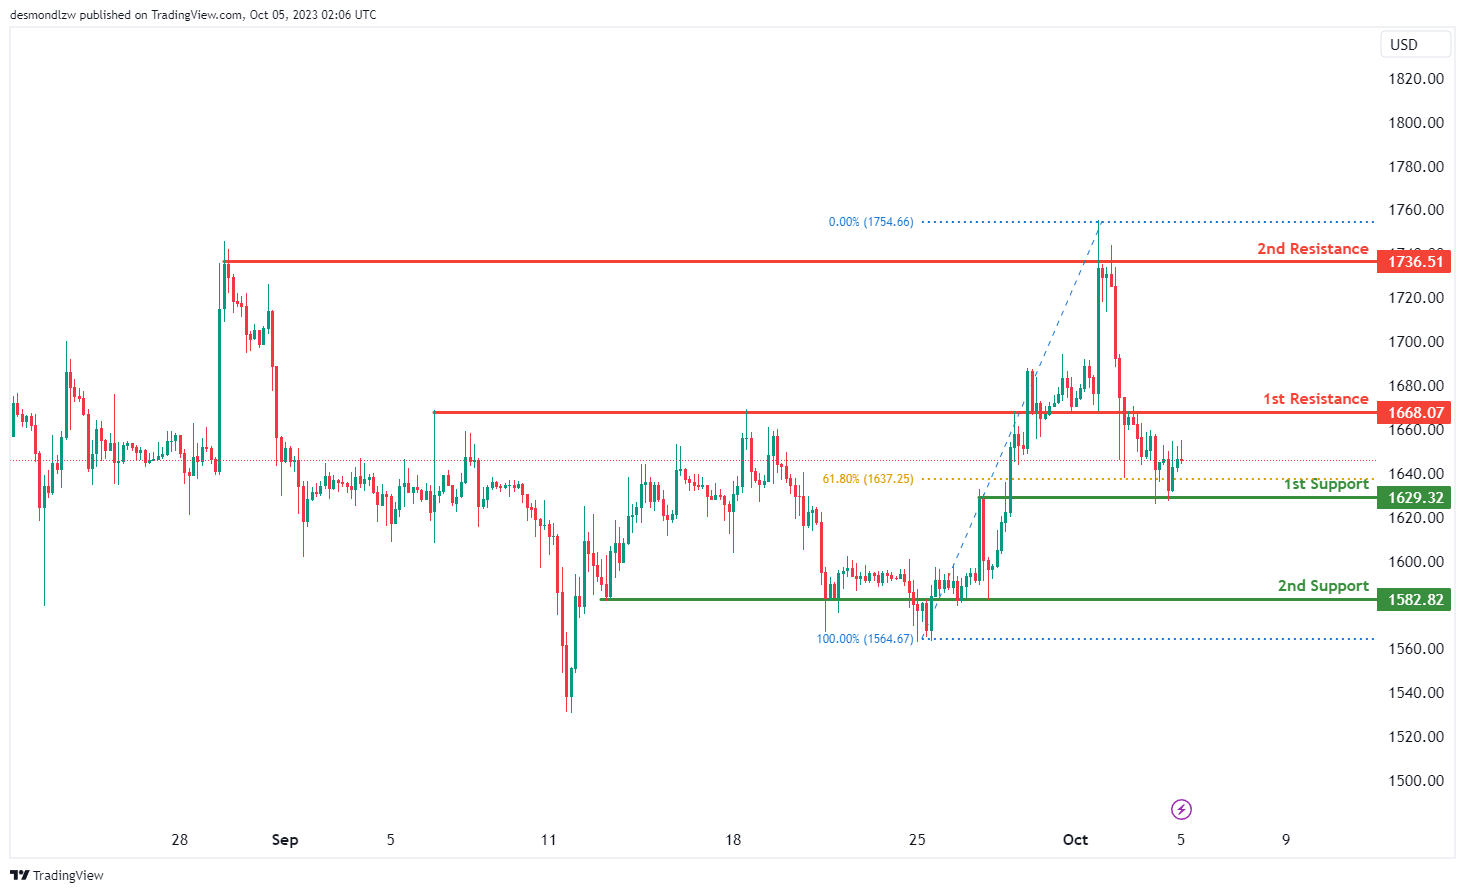
ETH/USD:
The ETH/USD (Ethereum/US Dollar) chart is currently exhibiting a neutral momentum, and there’s a potential scenario where the price may fluctuate between the 1st resistance and 1st support levels.
The 1st support at 1629.32 is considered significant as it’s identified as an overlap support and is accompanied by a 61.80% Fibonacci Retracement level, indicating potential price support. Additionally, the 2nd support at 1582.82 is categorized as an overlap support, reinforcing its significance as a potential area where the price may find support.
On the resistance side, the 1st resistance level at 1668.07 is marked as an overlap resistance. Beyond this, the 2nd resistance at 1736.51 is identified as a multi-swing high resistance, which suggests that it could potentially act as a barrier to the price’s upward movement.
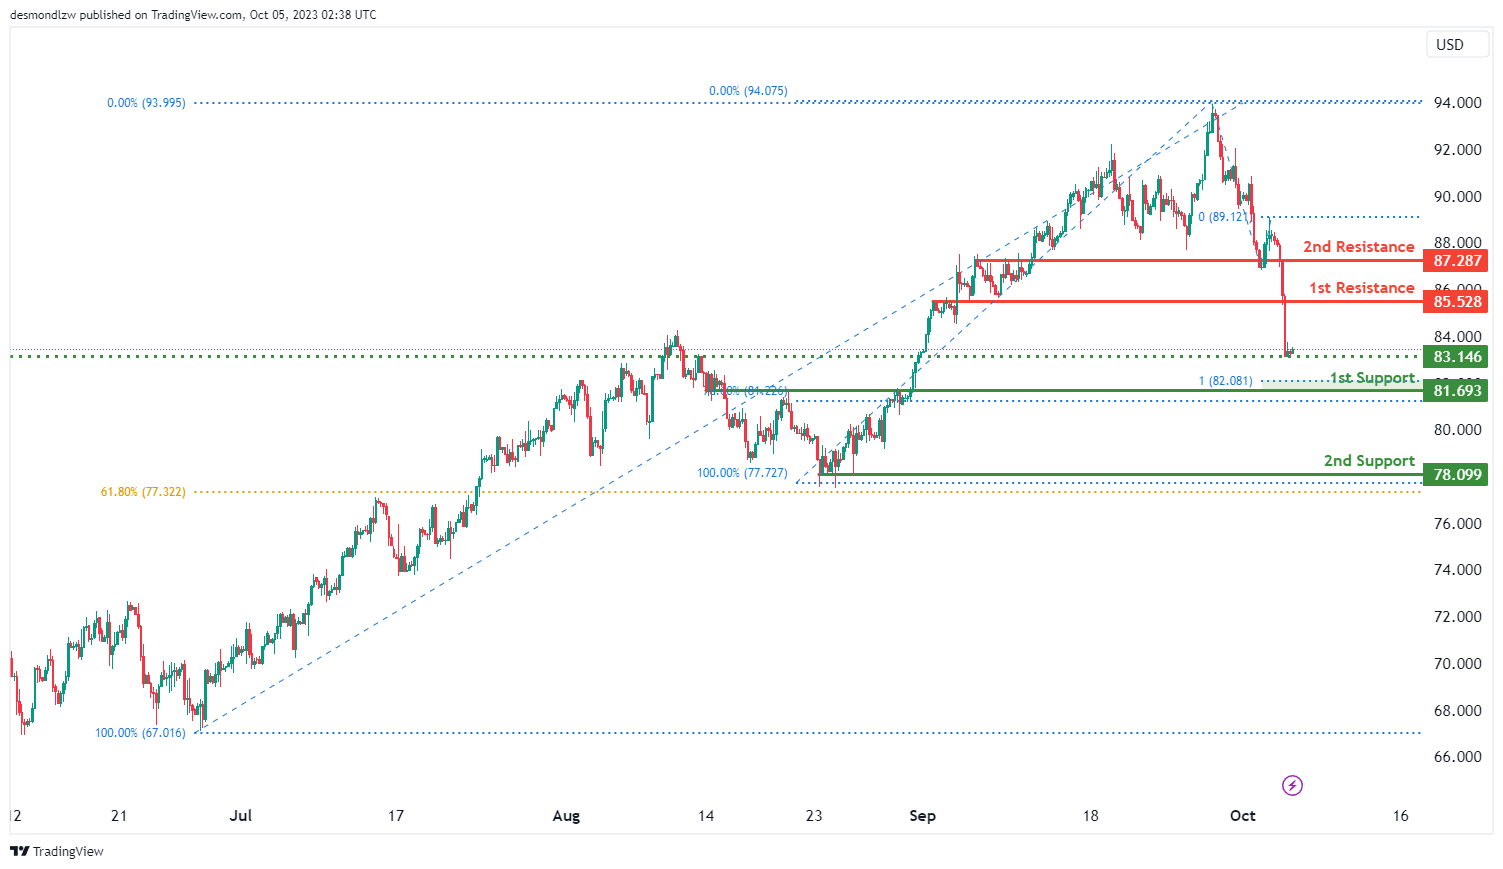
WTI/USD:
The WTI chart currently shows an overall bearish momentum and there is a potential for a bearish continuation towards the 1st support should price break below the intermediate support level.
The intermediate support level at 83.15 is identified as a pullback support while the 1st support level at 81.69 is noted as an overlap support that aligns close to a confluence of Fibonacci levels i.e. the 78.60% retracement and the 100.00% projection levels. Additionally, the 2nd support level at 78.09 is marked as a pullback support that aligns close to the 61.80% Fibonacci retracement level.
To the upside, the 1st resistance level at 85.53 is identified as an overlap resistance while the 2nd resistance level at 87.29 is also noted as an overlap resistance.
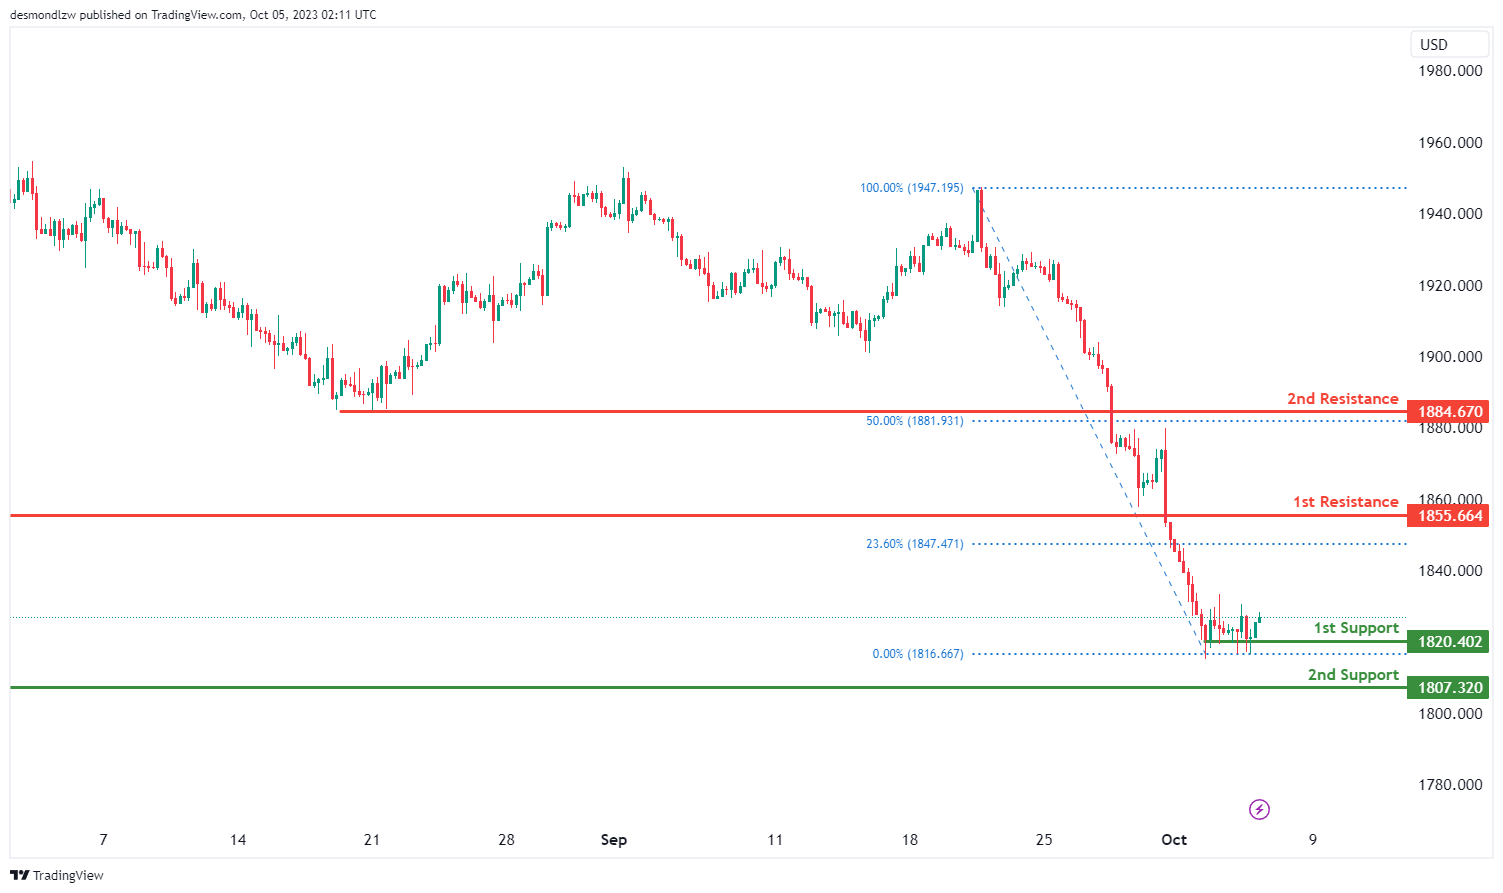
XAU/USD (GOLD):
The XAUUSD (Gold/US Dollar) chart is currently showing a bullish momentum, and there’s a potential scenario where price could continue its bullish movement towards the 1st resistance level.
The 1st support at 1820.40 is considered significant as it’s identified as an overlap support, making it an important level for potential price support. Additionally, the 2nd support at 1807.00 is categorized as a swing low support, further reinforcing its significance as a potential area where the price may find support.
On the resistance side, the 1st resistance level at 1855.66 is marked as a pullback resistance, which could limit further upward movements. Beyond this, the 2nd resistance at 1884.64 is identified as an overlap resistance and is accompanied by a 50% Fibonacci Retracement level, which indicates potential resistance to the price’s upward movement.


