
DXY:
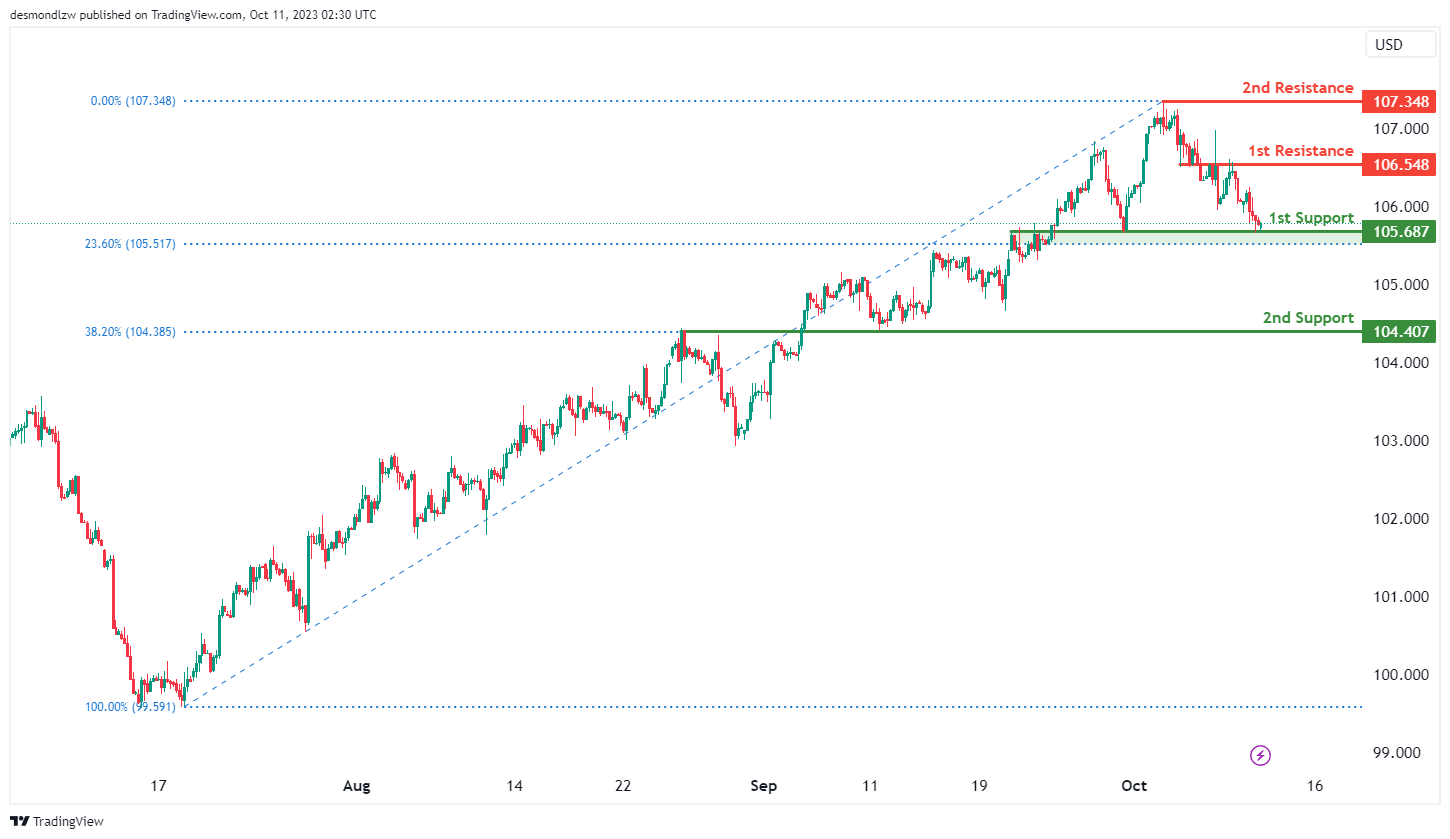
The DXY (US Dollar Index) chart currently exhibits a weak bullish momentum with a potential for price to make a bullish bounce off the 1st support level and move higher.
The 1st support level at 105.69 is identified as an overlap support that aligns close to the 23.60% Fibonacci retracement level. Additionally, the 2nd support level at 104.41 is also noted as an overlap support that aligns with the 38.20% Fibonacci retracement level, further reinforcing its significance as a potential area where price could find support.
To the upside, the 1st resistance level at 106.55 is identified as an overlap resistance. Further up, the 2nd resistance level at 107.35 is noted as a swing-high resistance, indicating its potential role as a barrier to upward movements.
EUR/USD:
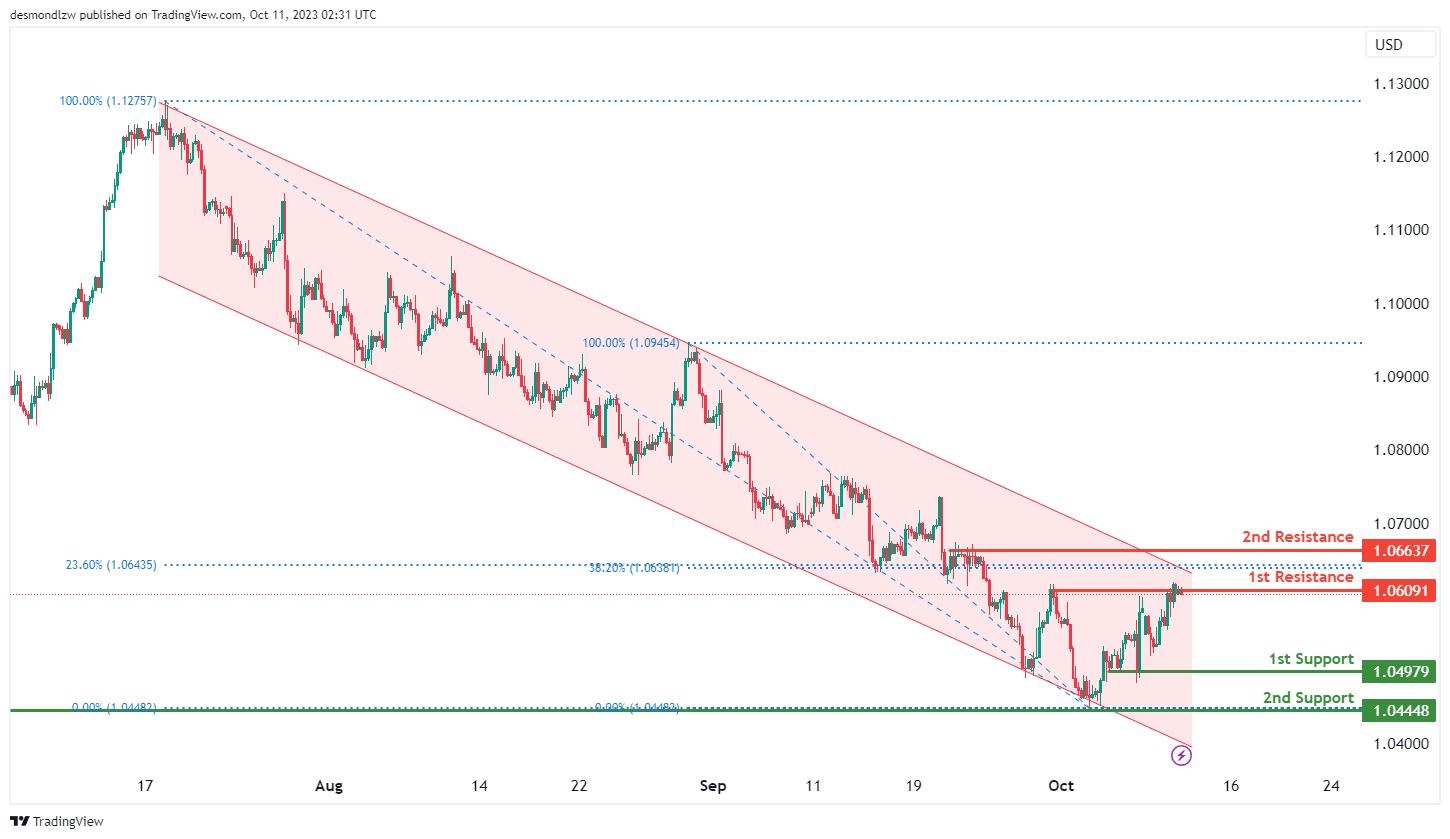
The EUR/USD chart currently exhibits a weak bearish momentum with price trading within the bearish descending channel. There is a potential for price to make a bearish reaction off the 1st resistance level and fall towards the 1st support level.
The 1st resistance level at 1.0609 is identified as a pullback resistance. Additionally, the 2nd resistance level at 1.0664 is also noted as a pullback resistance that aligns close to a confluence of Fibonacci levels i.e. the 23.60% retracement and the 38.20% retracement levels, suggesting that it may act as a barrier to upward movements.
To the downside, the 1st support level at 1.0498 is identified as a pullback support while the 2nd support at 1.0445 is also noted as a pullback support, making it an important level for potential price support.
EUR/JPY:
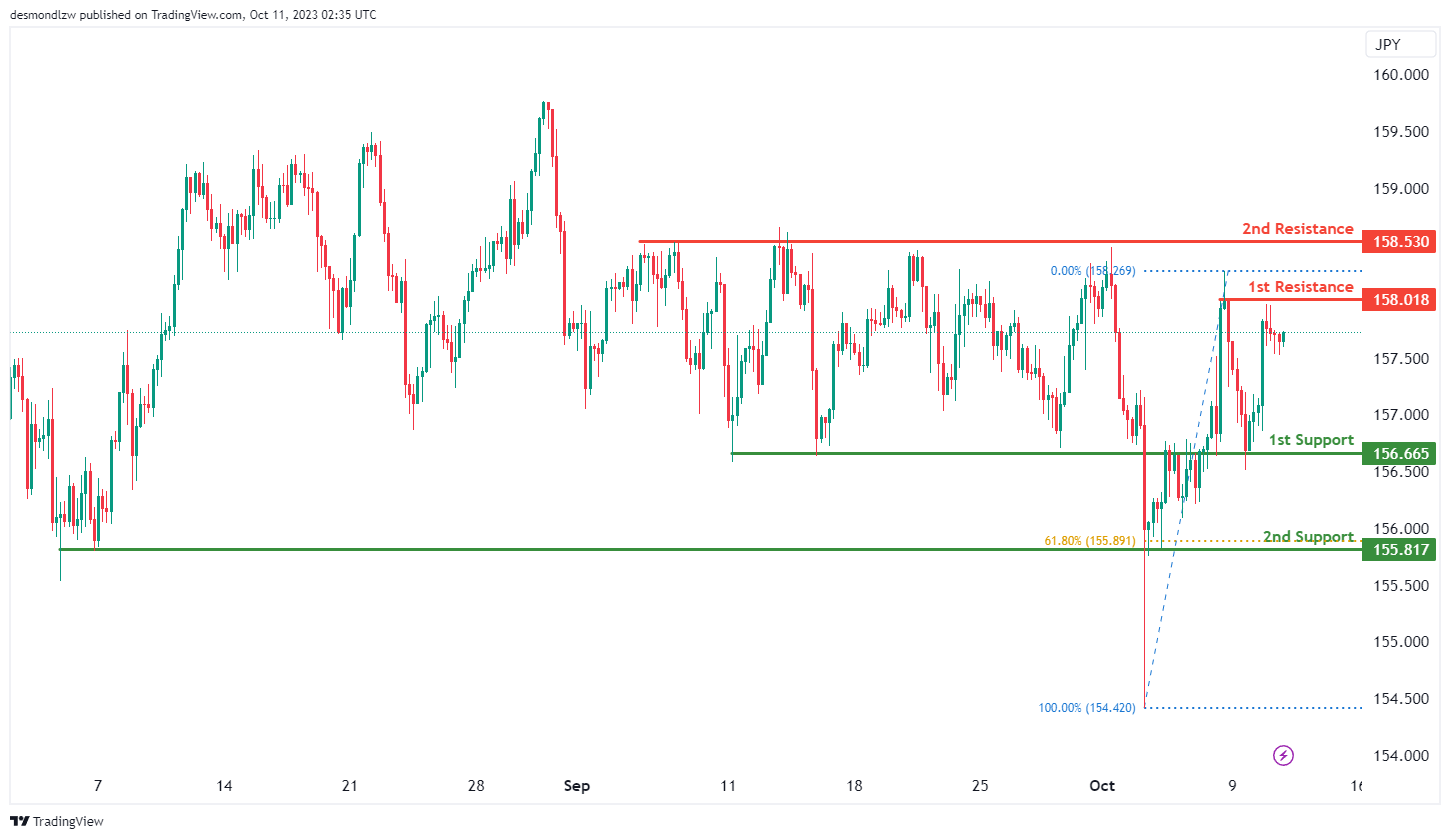
The EUR/JPY chart currently exhibits an overall bullish momentum with a potential for price to make a bullish continuation towards the 1st resistance level.
The 1st resistance level at 158.02 is identified as a swing-high resistance. Higher up, the 2nd resistance level at 158.53 is noted as a multi-swing-high resistance, suggesting that it may act as a barrier to upward movements.
To the downside, the 1st support level at 156.67 is identified as an overlap of support. Additionally, the 2nd support level at 155.82 is marked as a pullback support that aligns with a 61.80% Fibonacci retracement level, making it an important level for potential price support.
EUR/GBP:
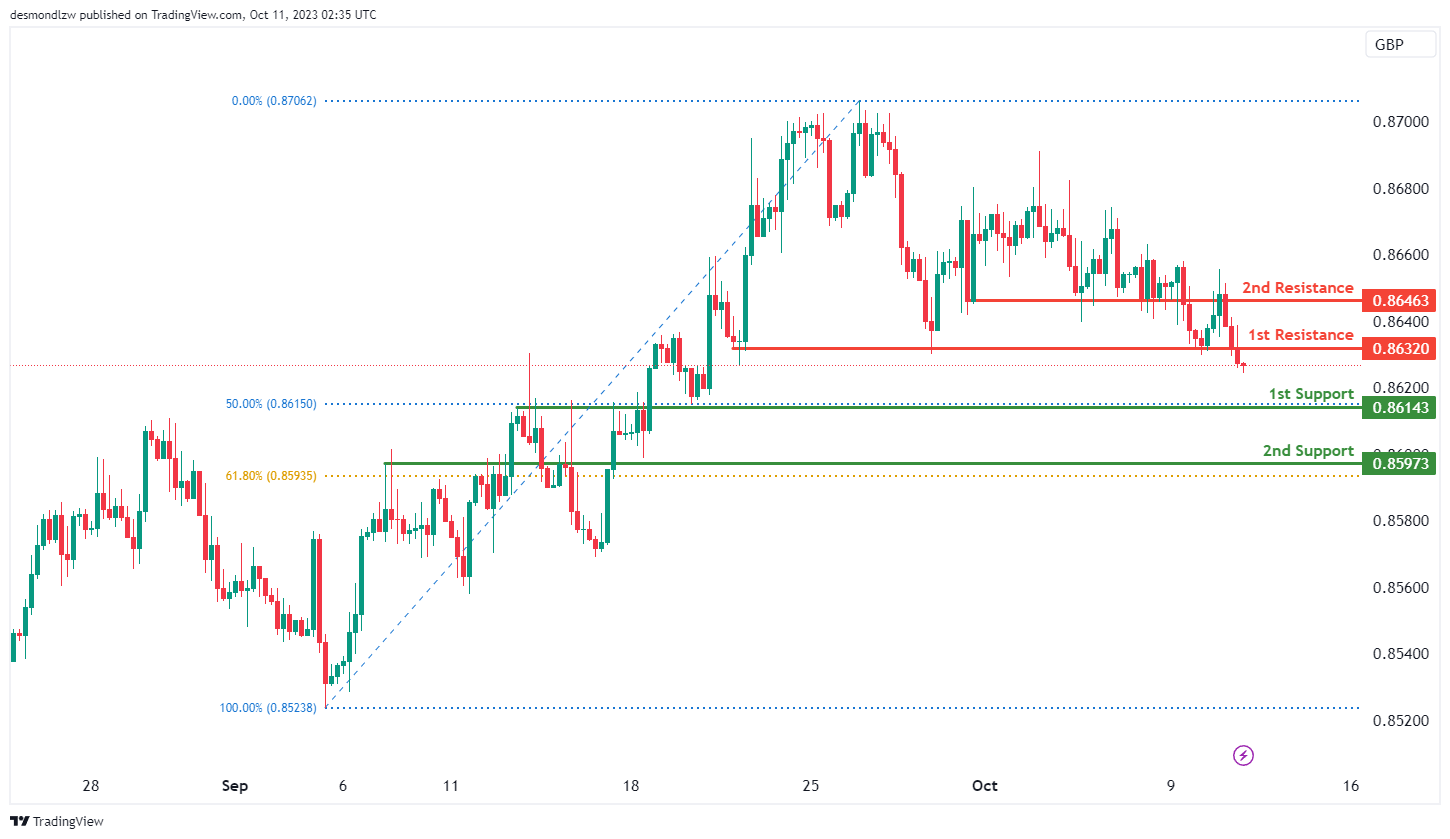
The EUR/GBP chart currently exhibits an overall bearish momentum with a potential for price to make a bearish continuation towards the 1st support level.
The 1st support level at 0.8614 is identified as an overlap support that aligns with the 50.00% Fibonacci retracement level. Additionally, the 2nd support level at 0.8597 is also marked an overlap of support that aligns with the 61.80% Fibonacci retracement level, making it an important level for potential price support.
To the upside, the 1st resistance level at 0.8632 is identified as a pullback resistance. The 2nd resistance level at 0.8646 is also noted as a pullback resistance, suggesting that it may act as a barrier to upward movement.
GBP/USD:
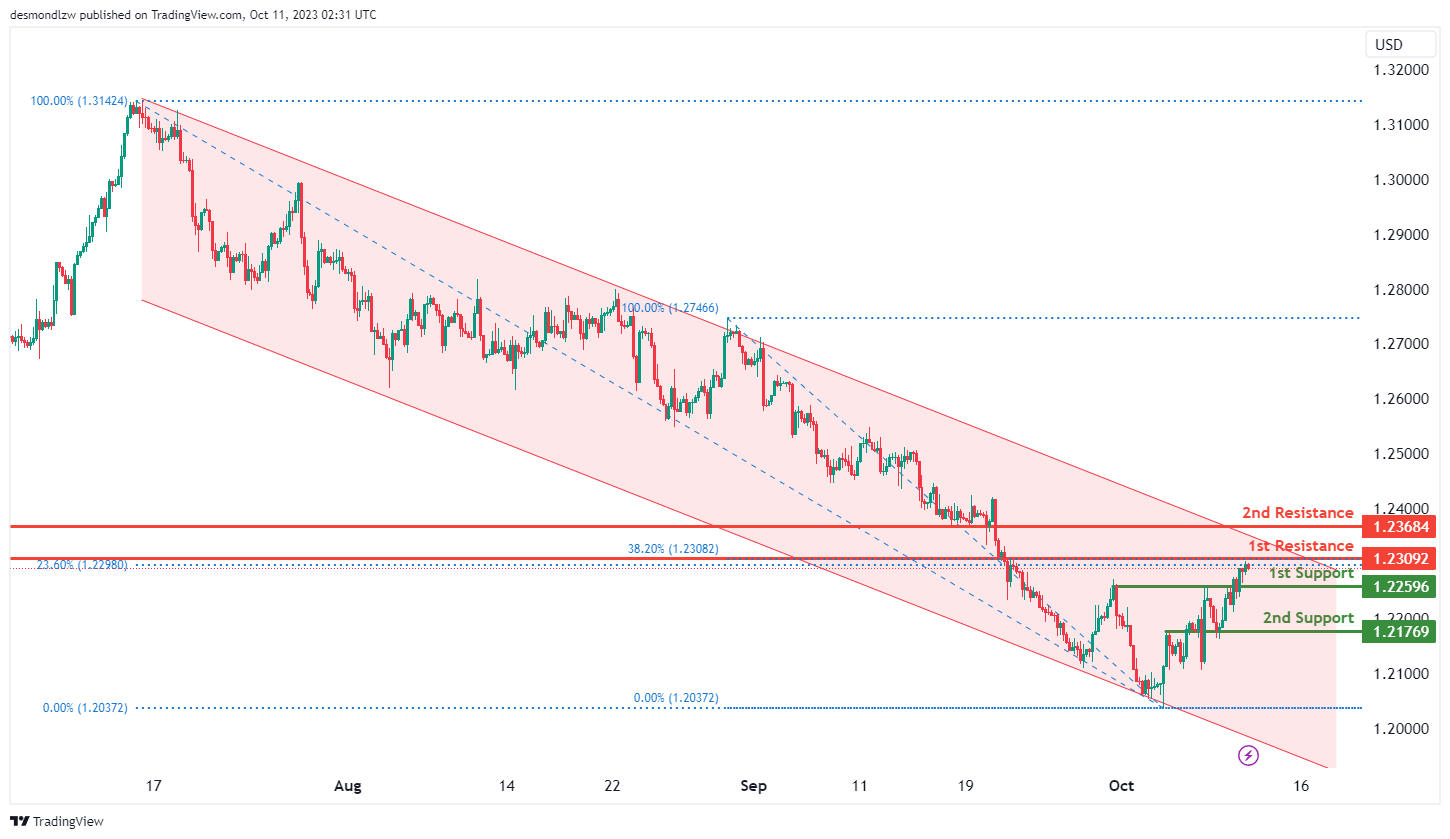
The GBP/USD chart currently exhibits an overall bearish momentum with price trading within the bearish descending channel. There is a potential for price to make a bearish reaction off the 1st resistance level and fall towards the 1st support level.
The 1st resistance level at 1.2309 is identified as a pullback resistance that aligns with a confluence of Fibonacci levels i.e. the 23.60% retracement and the 38.20% retracement levels. Beyond this, the 2nd resistance level at 1.2368 is also noted as a pullback resistance, suggesting it may act as a barrier to upward movements.
To the downside, the 1st support level at 1.2259 is identified as a pullback support. Additionally, the 2nd support level at 1.2177 is noted as an overlap support, further reinforcing its significance as a potential area where price could find support.
GBP/JPY:
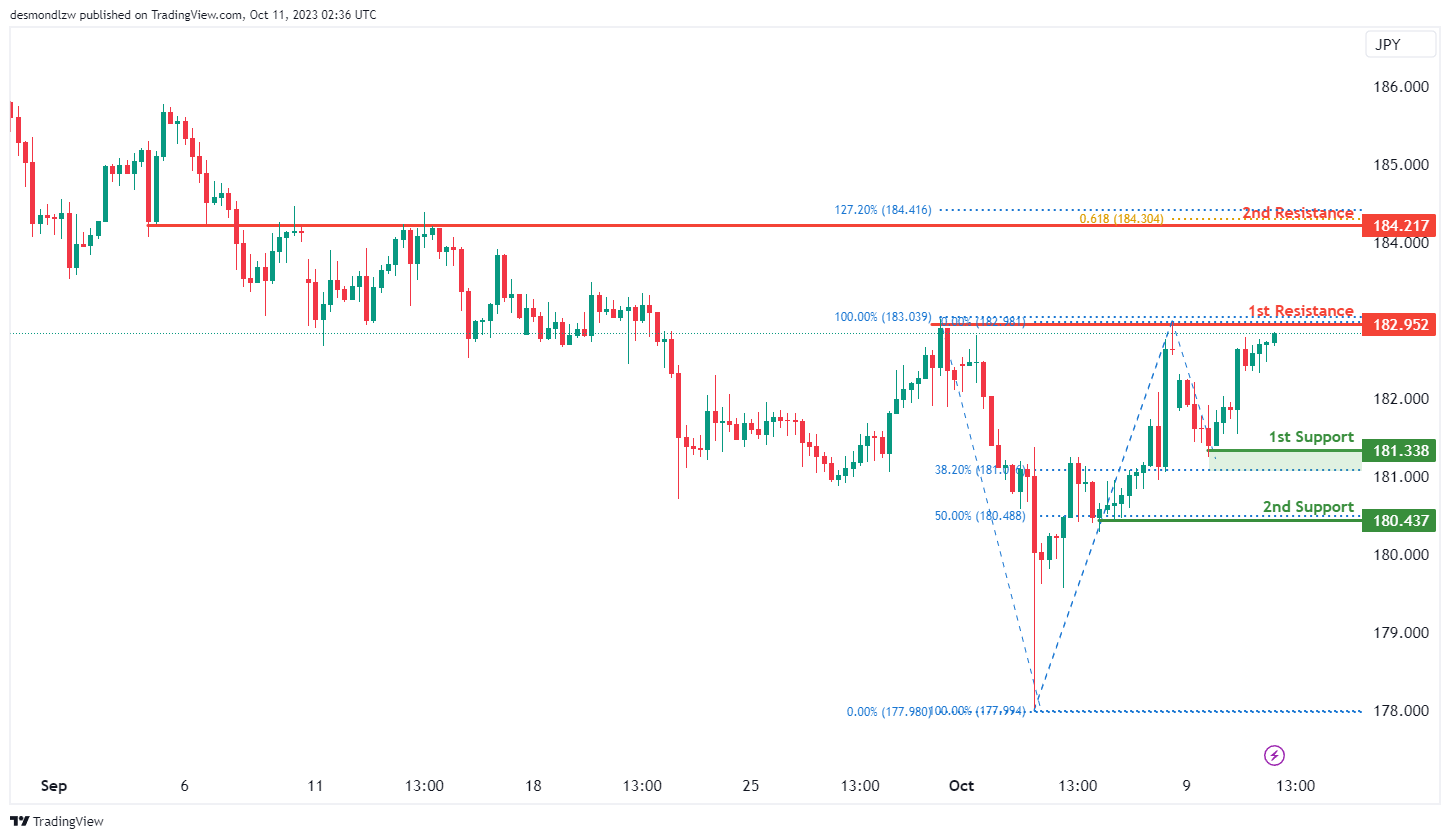
The GBP/JPY chart currently exhibits an overall bullish momentum with a potential for price to make a bullish continuation towards the 1st resistance level.
The 1st resistance level at 182.95 is identified as a multi-swing-high resistance. Beyond this, the 2nd resistance level at 184.22 is noted as an overlap resistance that aligns with a confluence of Fibonacci levels i.e. the 127.20% extension and the 61.80% projection levels.
To the downside, the 1st support level at 181.34 is identified as a pullback support that aligns close to the 38.20% Fibonacci retracement level. Additionally, the 2nd support level at 180.44 is also marked as a pullback support that aligns with the 50.00% Fibonacci retracement level.
USD/CHF:
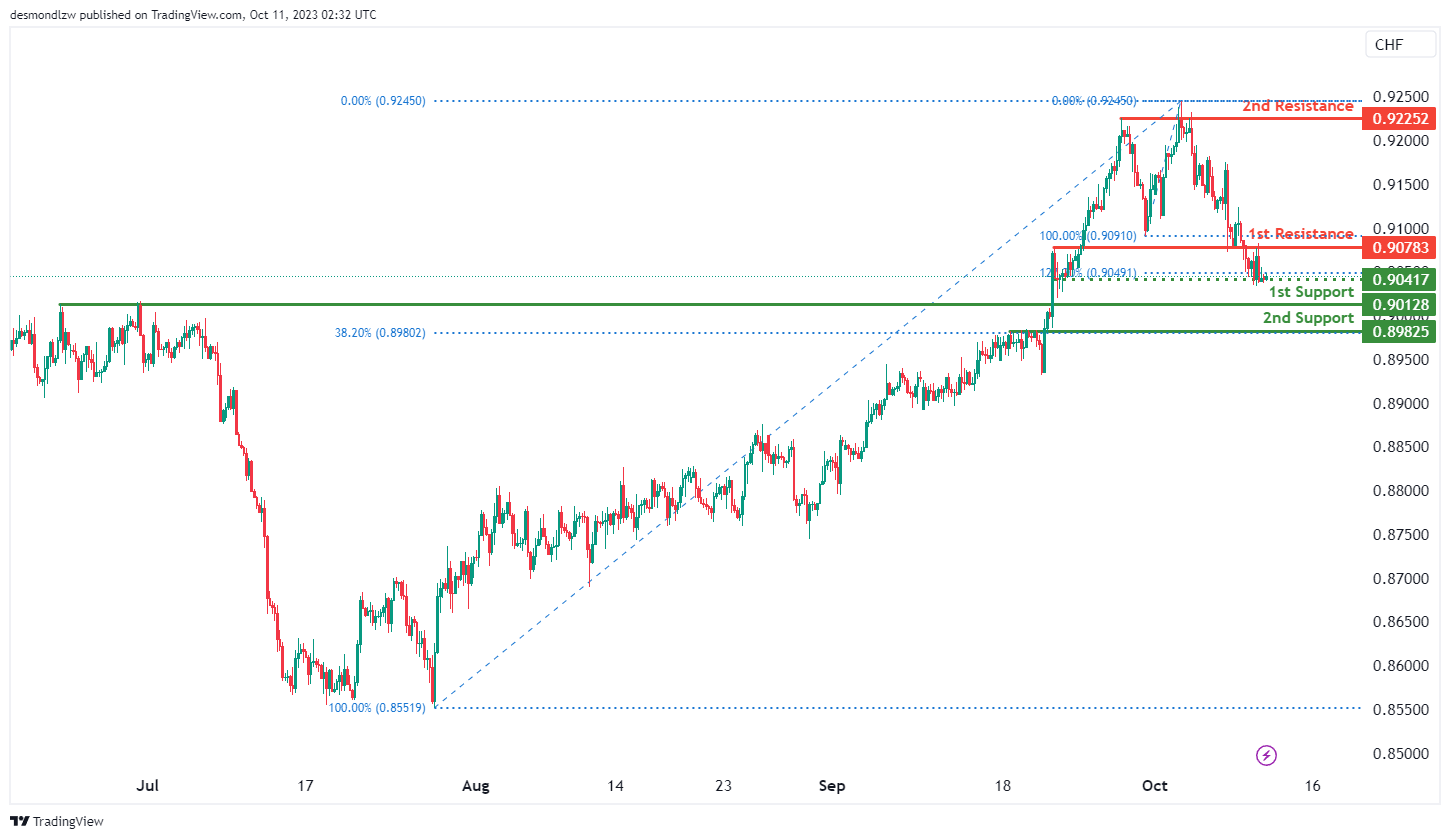
The USD/CHF chart currently exhibits an overall bearish momentum. Should price break below the intermediate support level, there is a potential for price to make a bearish continuation towards the 1st support level.
The intermediate support level at 0.9042 is identified as a pullback support that aligns close to the 127.20% Fibonacci extension level while the 1st support level at 0.9013 is also noted as a pullback support. Additionally, the 2nd support level at 0.8983 is identified as a pullback support that aligns with the 38.20% Fibonacci retracement level, further reinforcing its significance as an area where the price may find support.
To the upside, the 1st resistance level at 0.9078 is identified as an overlap resistance. Higher up, the 2nd resistance level at 0.9225 is noted as a multi-swing-high resistance, acting as a potential barrier to further price increases.
USD/JPY:
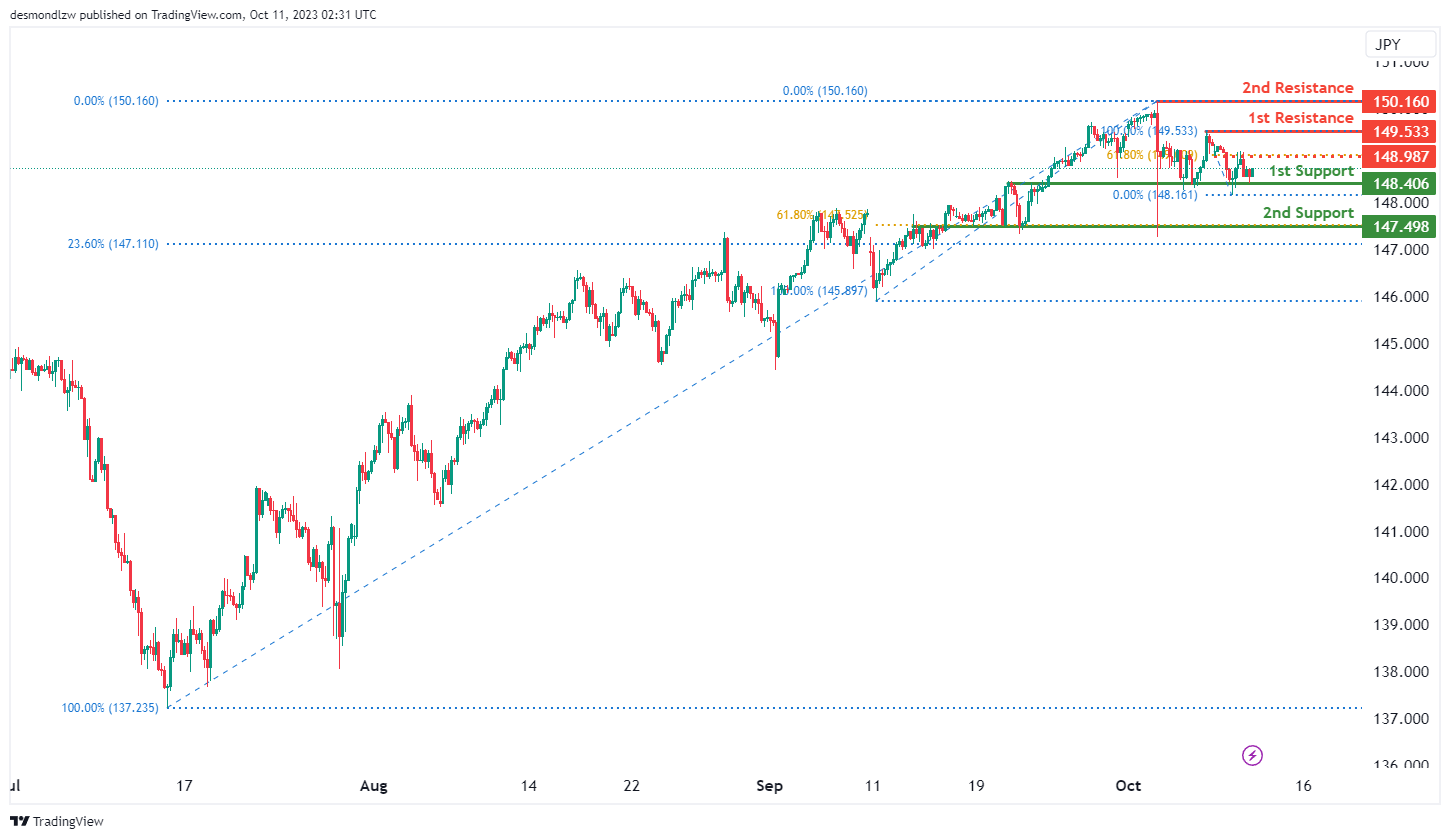
The USD/JPY chart currently exhibits a weak bullish momentum with a potential for price to make a bullish bounce off the 1st support level and rise towards the 1st resistance level should price break above the intermediate resistance.
The intermediate resistance level at 148.99 is identified as an overlap resistance that aligns with the 61.80% Fibonacci retracement level while the 1st resistance level at 149.53 is noted as a pullback resistance. Higher up, the 2nd resistance level at 150.16 is identified as a swing-high resistance, acting as a potential barrier to further price increases.
The 1st support level at 148.41 is identified as an overlap support. Further below, the 2nd support at 147.49 is also noted as an overlap support that aligns with a confluence of Fibonacci levels i.e. the 23.60% retracement and the 61.80% retracement levels, further reinforcing its significance as an area where the price may find support.
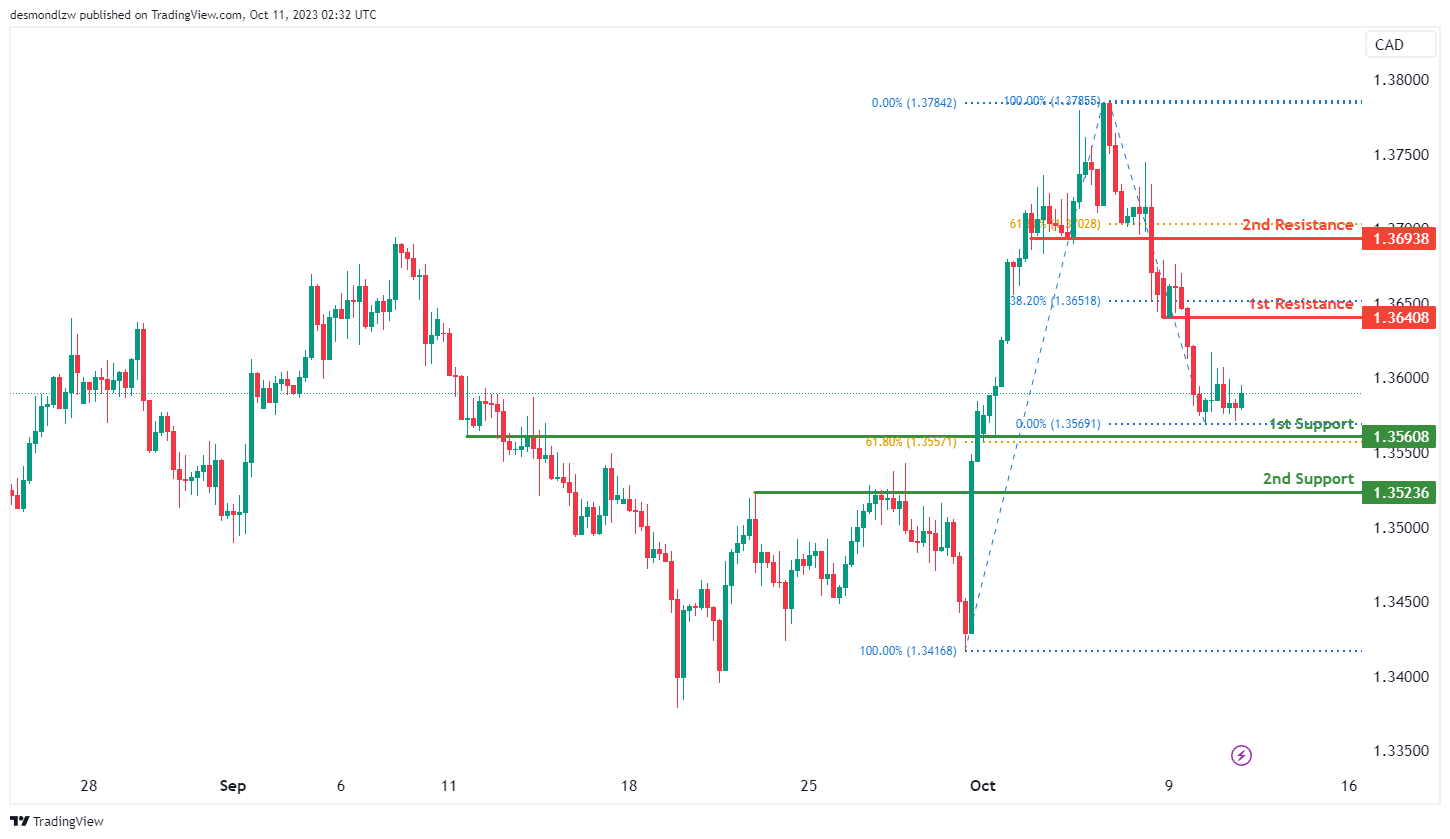
USD/CAD:
The USD/CAD chart is currently showing an overall bullish momentum with a potential for price to make a bullish bounce off the 1st support level and rise towards the 1st resistance level.
The 1st support level at 1.3561 is identified as an overlap support that aligns with the 61.80% Fibonacci retracement level. Additionally, the 2nd support level at 1.3524 is noted as a pullback support, further reinforcing its significance as an area where the price may find support.
To the upside, the 1st resistance level at 1.3641 is identified as a pullback resistance that aligns close to the 38.20% Fibonacci retracement level. Higher up, the 2nd resistance level at 1.3694 is also noted as a pullback resistance that aligns close to the 61.80% Fibonacci retracement level, further emphasizing its significance as a barrier for future price increases.
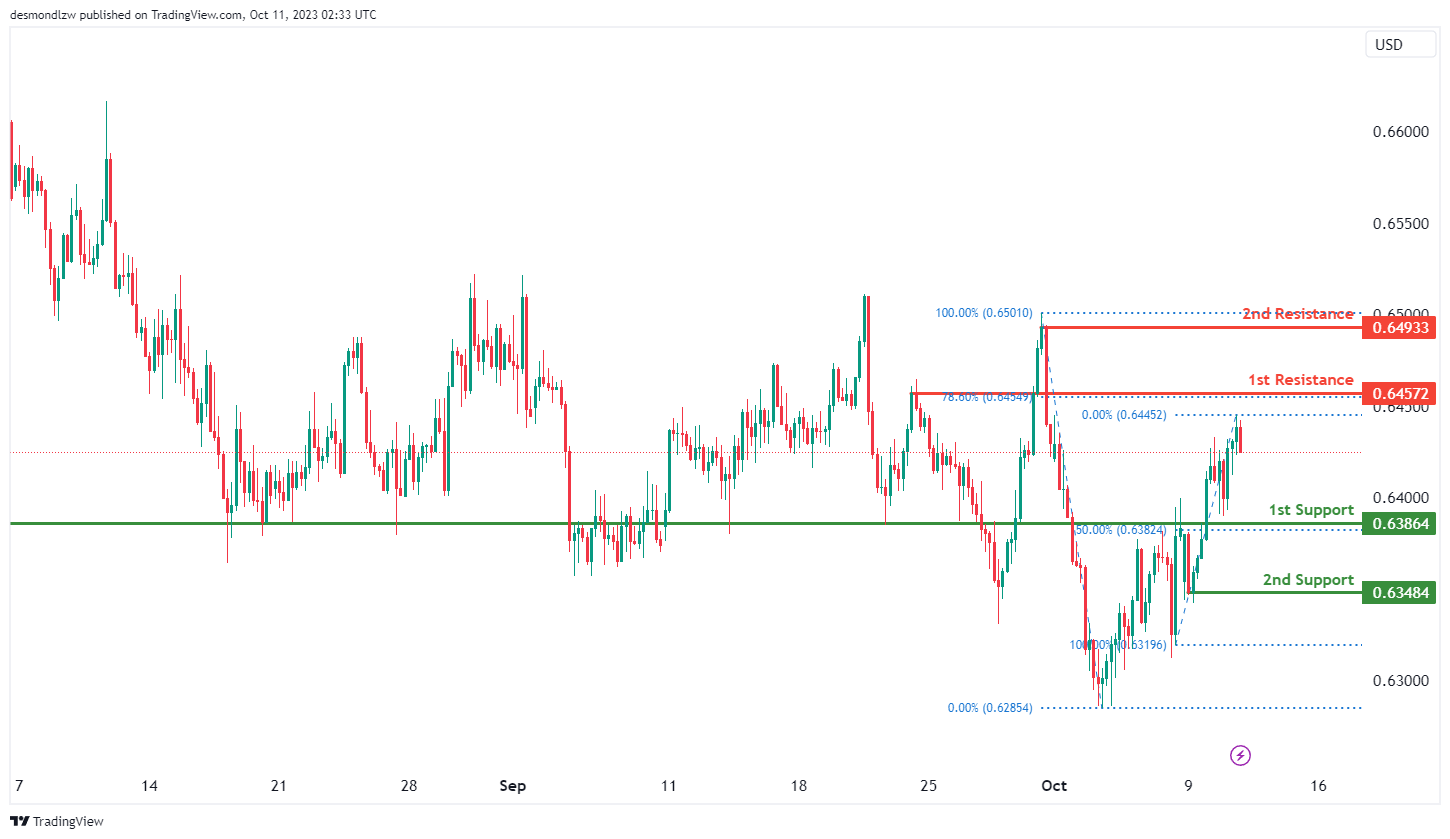
AUD/USD:
The AUD/USD chart currently exhibits a neutral momentum with a potential scenario for price to fluctuate between the 1st resistance and the 1st support levels.
The 1st support level at 0.6386 is identified as an overlap support that aligns with the 50.00% Fibonacci retracement level. Further below, the 2nd support level at 0.6348 is marked as a pullback, reinforcing its importance as a potential support level.
To the upside, the 1st resistance level at 0.6457 is identified as a swing-high resistance that aligns with the 78.60% Fibonacci retracement level. Additionally, the 2nd resistance level at 0.6493 is also noted as a swing-high resistance, further emphasizing its significance as a barrier for future price increases.
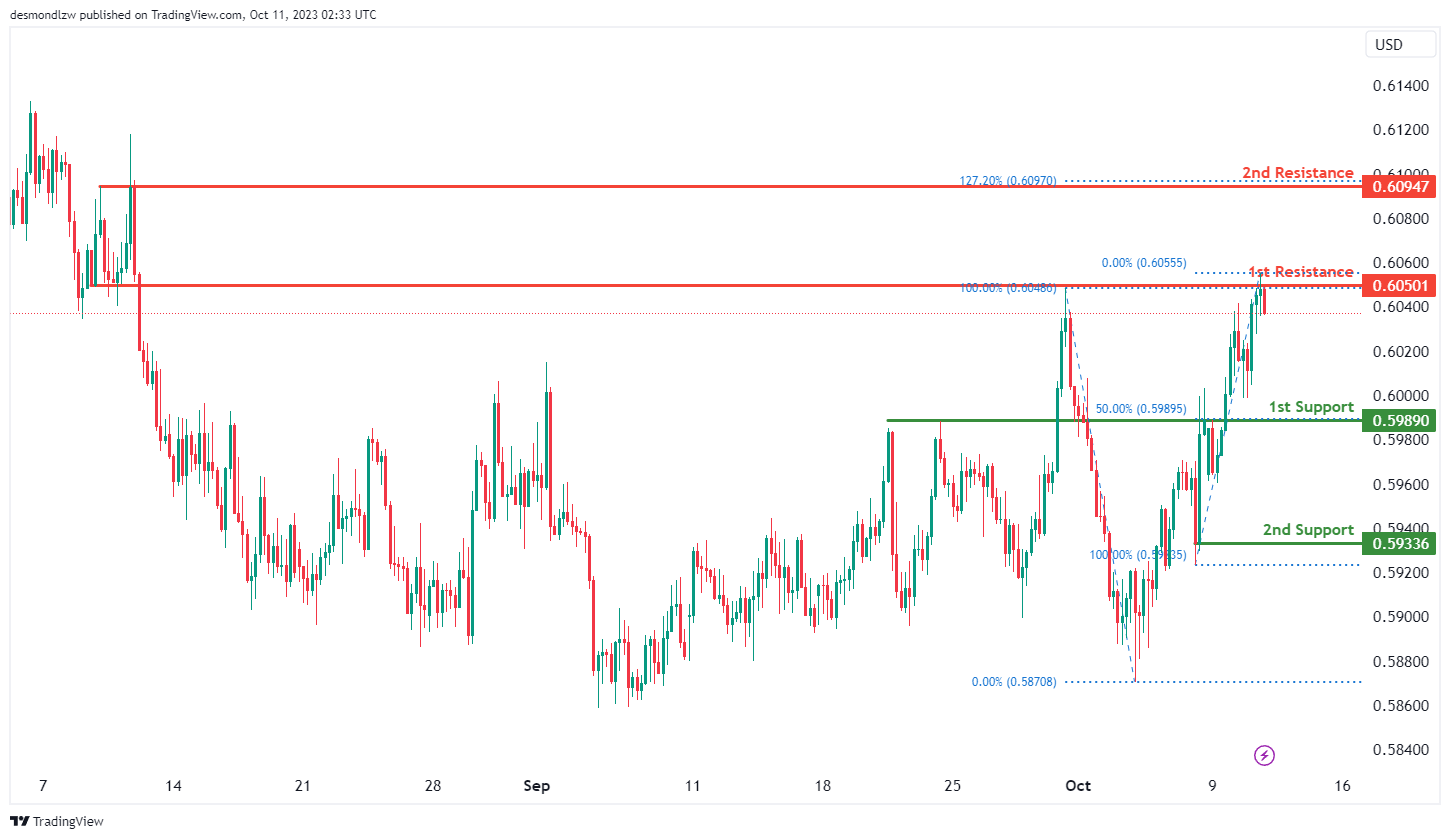
NZD/USD
The NZD/USD chart currently exhibits an overall bearish momentum with a potential scenario for price to make a bearish reaction off the 1st resistance level and fall towards the 1st support level.
The 1st resistance level at 0.6050 is identified as an overlap resistance. Additionally, the 2nd resistance level at 0.6095 is marked as a pullback resistance that aligns with the 127.20% Fibonacci extension level, further emphasizing its significance as a barrier for future price increases.
To the downside, the 1st support level at 0.5989 is identified as an overlap support that aligns with the 50.00% Fibonacci retracement level. Further below, the 2nd support level at 0.5934 is noted as a pullback support, further reinforcing its significance as an area where price may find support.
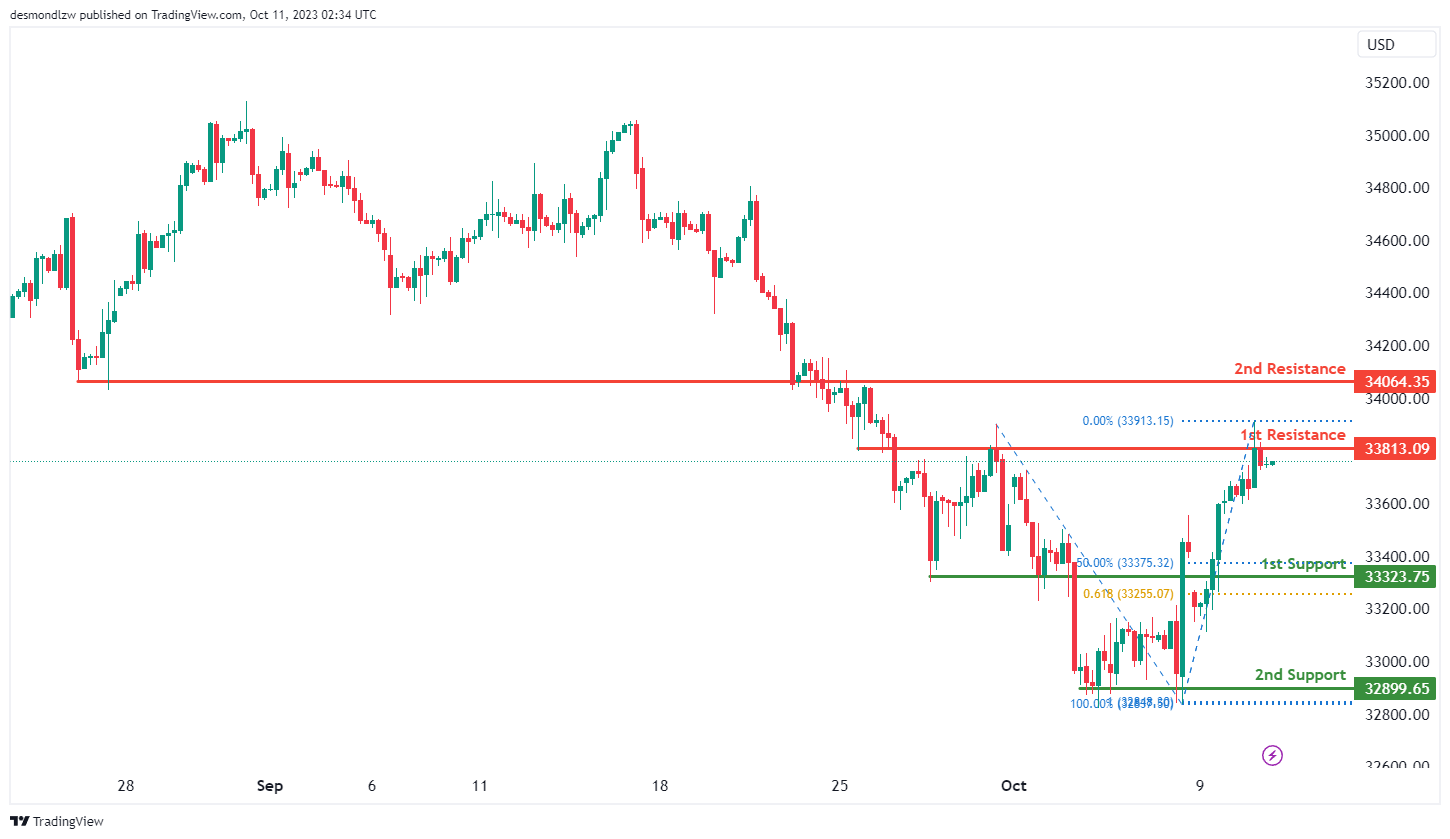
DJ30:
The Dow Jones (DJ30) chart is currently showing an overall bullish momentum with a potential for price to make a bullish continuation towards the 1st resistance level.
The 1st resistance level at 33,813.09 is identified as an overlap resistance. Beyond this, the 2nd resistance level at 34,060.35 is also noted as an overlap resistance.
To the downside, the 1st support level at 33,323.75 is identified as a pullback support that aligns with a confluence of Fibonacci levels i.e. the 50.00% retracement and the 61.80% projection levels. Additionally, the 2nd support level at 32,899.65 is also marked as a pullback support.
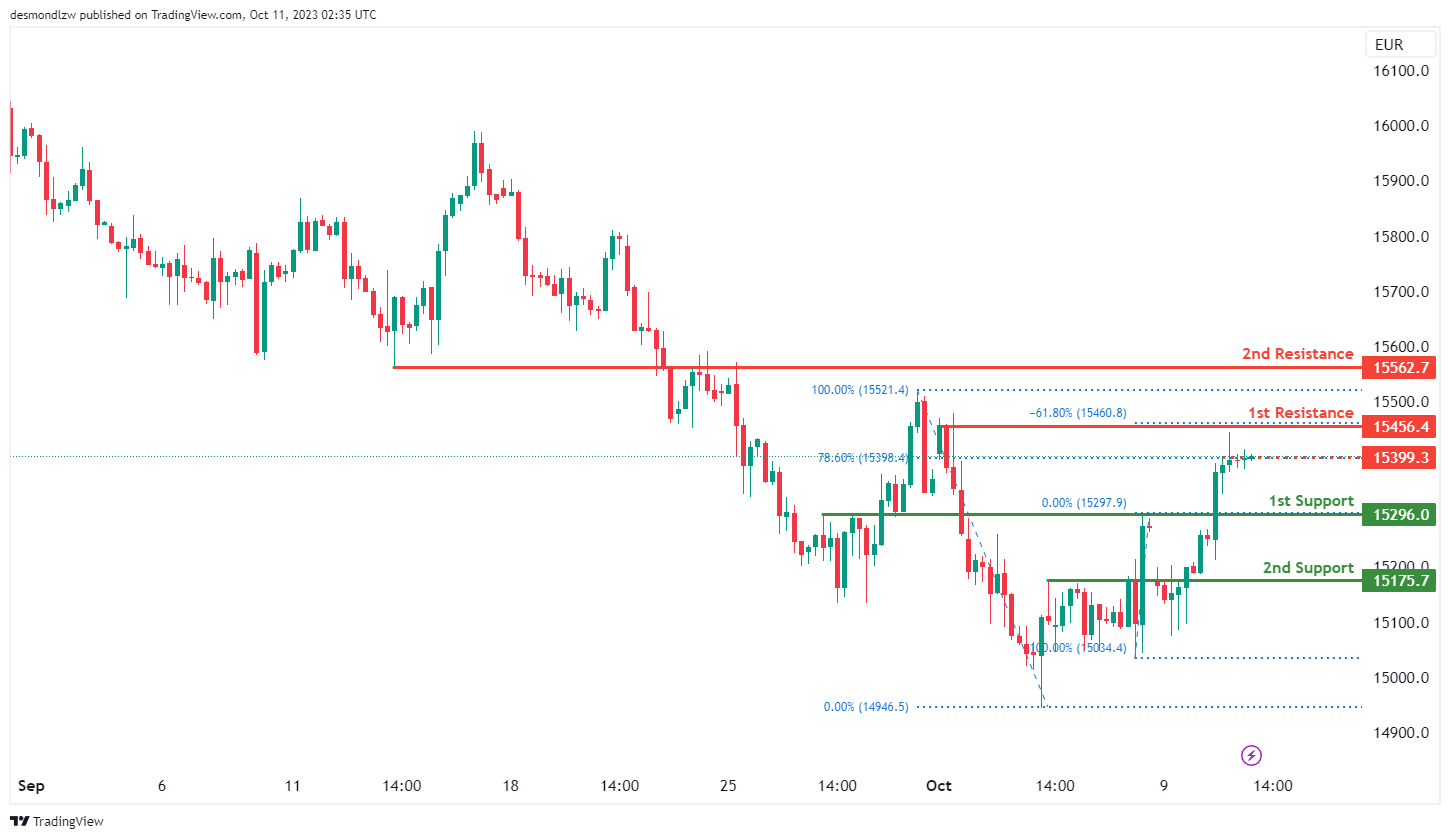
GER40:
The German 40 (GER40) chart is currently showing an overall bullish momentum with a potential for price to make a bullish continuation towards the 1st resistance level should the price break above the intermediate resistance.
The intermediate resistance level at 15,399.30 is identified as a pullback resistance that aligns with the 78.60% Fibonacci retracement level while the 1st resistance level at 15,456.40 is also noted as a pullback resistance. Beyond this, the 2nd resistance level at 15,562.70 is identified as an overlap resistance.
To the downside, the 1st support level at 15,296.00 is identified as an overlap support. Additionally, the 2nd support level at 15,175.70 is also marked as an overlap support..
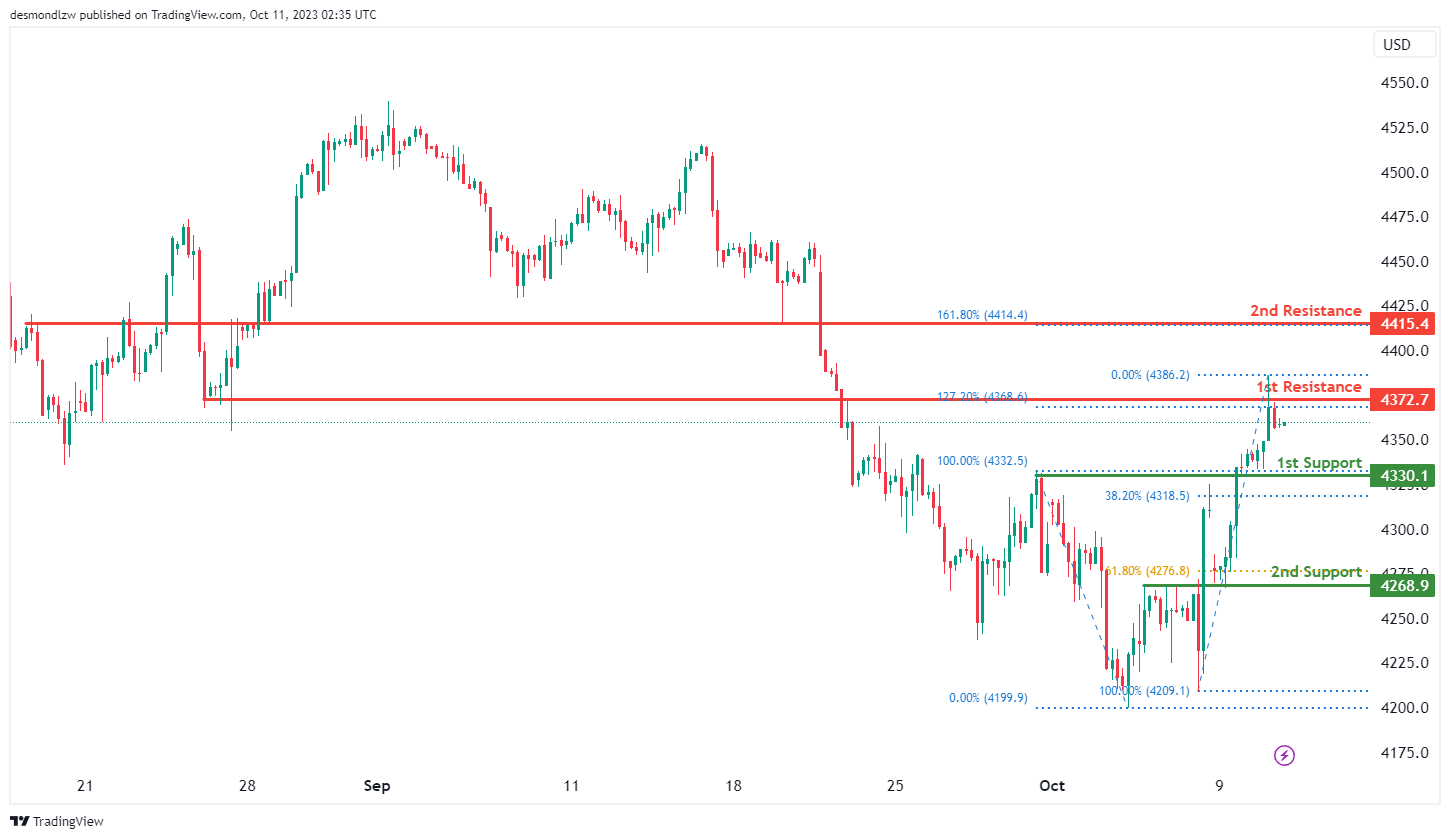
US500
The S&P 500 (US500) chart is currently showing an overall bullish momentum with a potential for price to make a bullish continuation towards the 1st resistance level.
The 1st resistance level at 4,372.70 is identified as an overlap resistance that aligns with the 127.20% Fibonacci extension level. Higher up, the 2nd resistance level at 4,415.40 is also noted as an overlap resistance that aligns with the 161.80% Fibonacci extension level.
To the downside, the 1st support level at 4,330.10 is identified as an overlap support that aligns close to the 38.20% Fibonacci retracement level. Additionally, the 2nd support level at 4,268.90 is also marked as an overlap support that aligns close to the 61.80% Fibonacci retracement level.
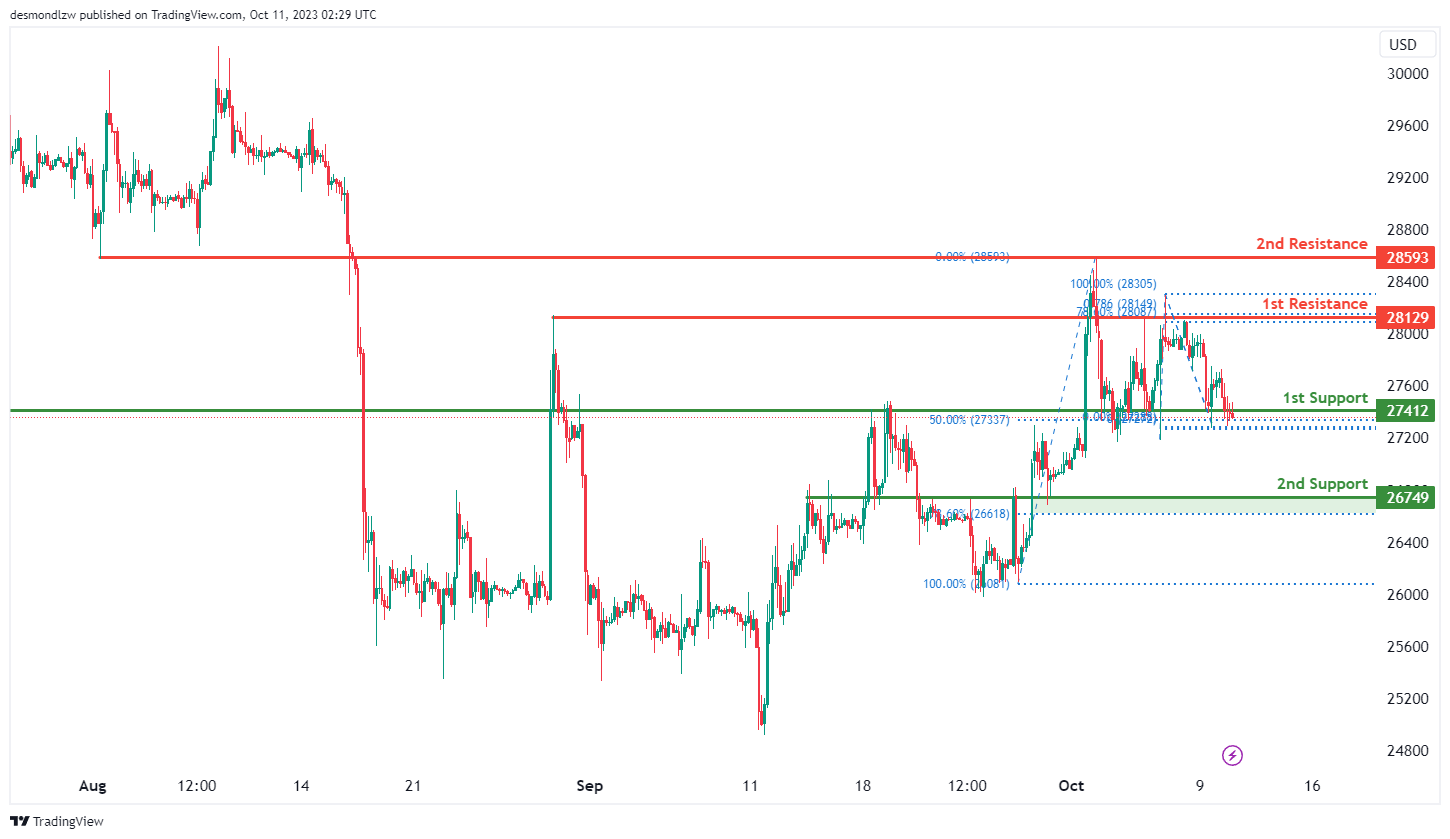
BTC/USD:
The Bitcoin (BTC/USD) chart currently exhibits an overall bearish momentum with a potential scenario for price to make a bearish breakout below the 1st support level and drop towards the 2nd support level.
The 1st support level at 27,412.00 is identified as an overlap support that aligns with the 50.00% Fibonacci retracement level. Further below, the 2nd support level at 26,749.00 is also noted as an overlap support that aligns close to the 78.60% Fibonacci retracement level.
To the upside, the 1st resistance level at 28,129.00 is identified as a pullback resistance that aligns with the 78.60% Fibonacci retracement level. Higher up, the 2nd resistance level at 28,593.00 is marked as a pullback resistance.
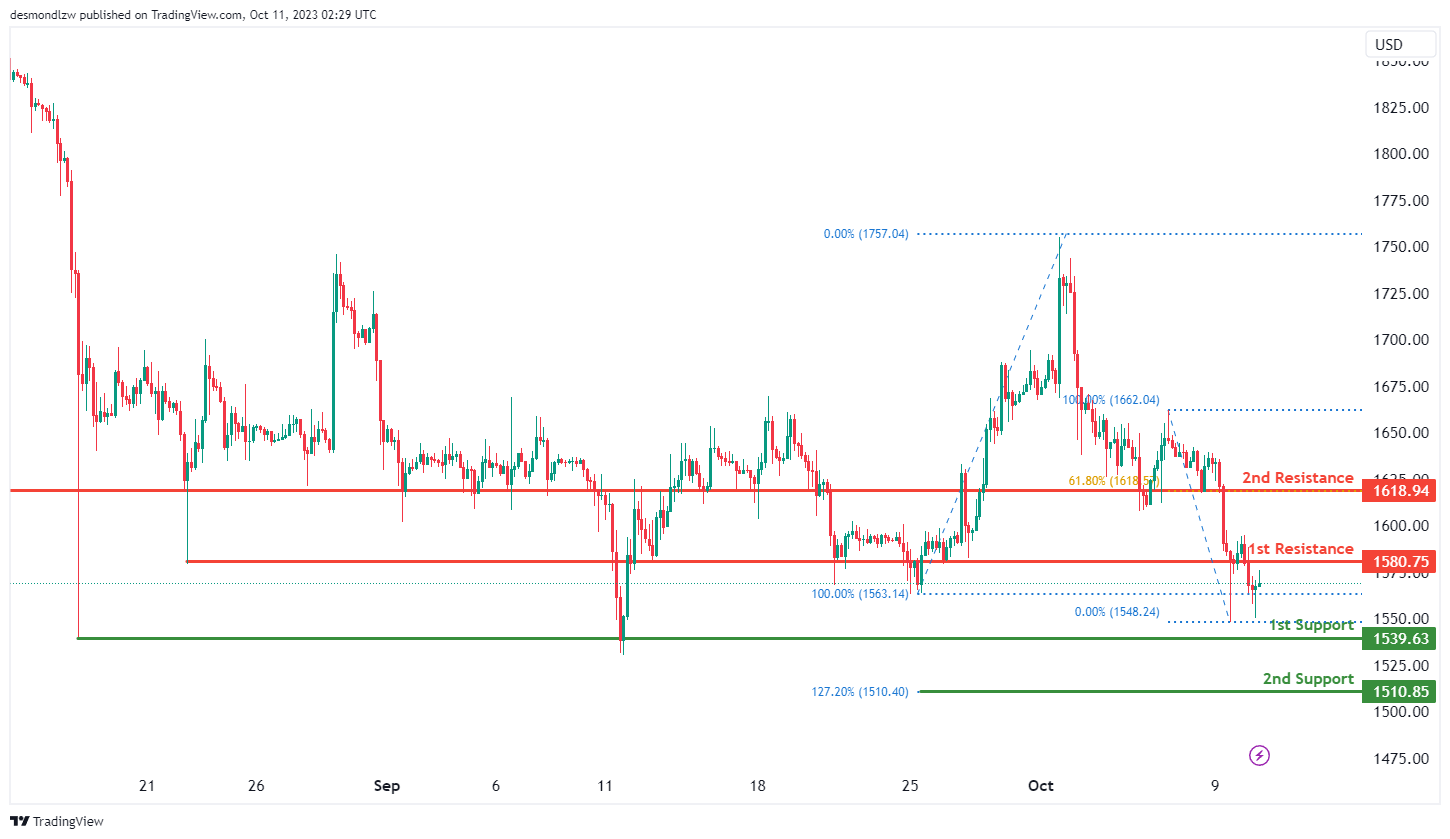
ETH/USD:
The Ethereum (ETH/USD) chart currently exhibits an overall bearish momentum with a potential scenario for price to make a bearish continuation towards the 1st support level.
The 1st support level at 1,539.63 is identified as a pullback support. Further below, the 2nd support level at 1,510.85 is noted as a support level that aligns with the 127.20% Fibonacci extension level.
To the upside, the 1st resistance level at 1,580.75 is identified as a pullback resistance. Higher up, the 2nd resistance level at 1,618.94 is marked as an overlap resistance that coincides with the 61.80% Fibonacci retracement level.
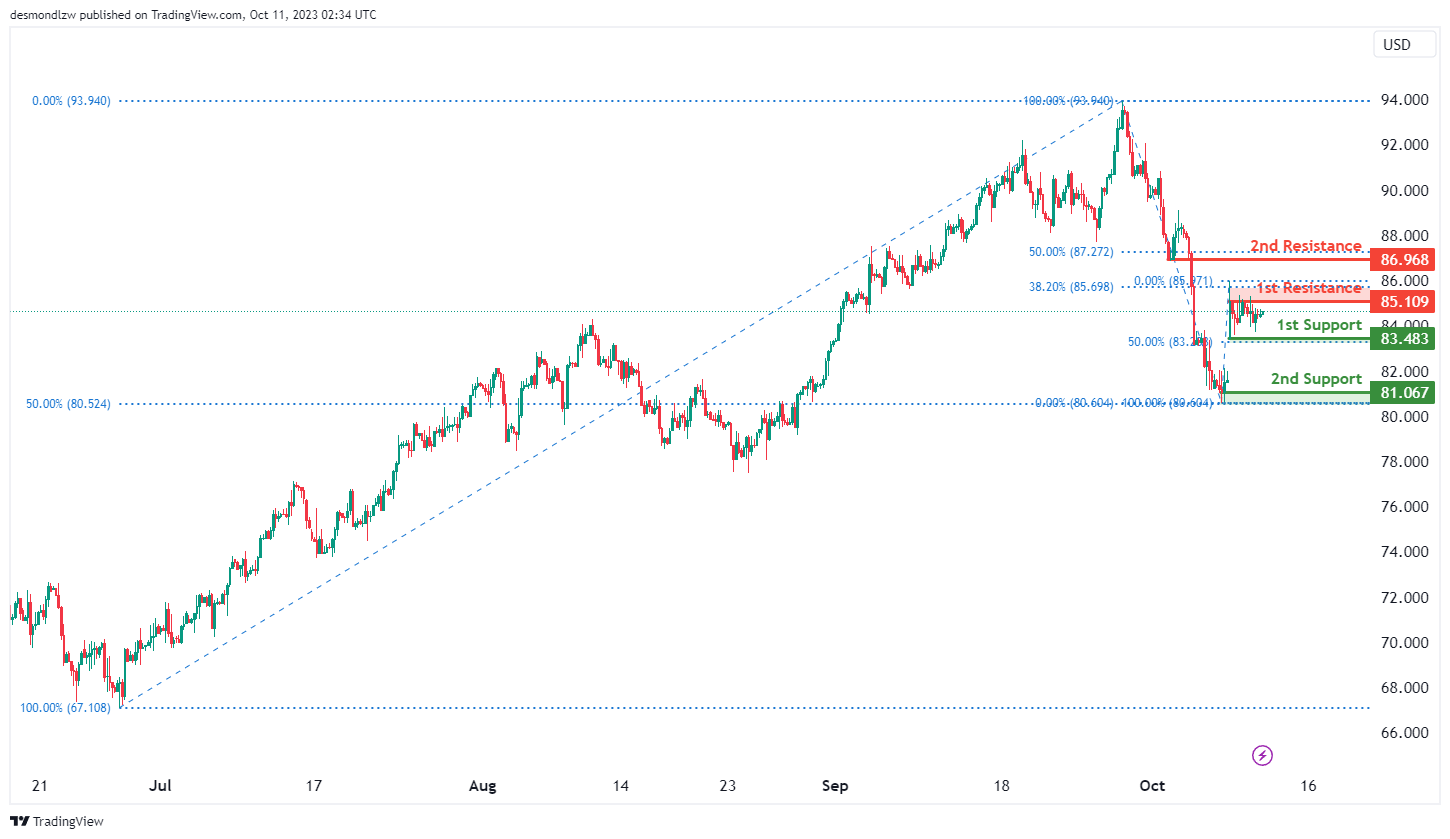
WTI/USD:
The WTI chart currently exhibits a neutral momentum with a potential scenario for price to fluctuate between the 1st resistance and the 1st support levels.
The 1st resistance level at 85.11 is identified as a pullback resistance that aligns close to the 38.20% Fibonacci retracement level. Higher up, the 2nd resistance level at 86.97 is also noted as a pullback resistance that aligns close to the 50.00% Fibonacci retracement level, potentially acting as a barrier to further upward movement.
To the downside, the 1st support level at 83.48 is identified as a pullback support that aligns with the 50.00% Fibonacci retracement level. Additionally, the 2nd support level at 81.07 is noted as a swing-low support that aligns with the 50.00% Fibonacci retracement level, further reinforcing its significance as an area where price may find support.
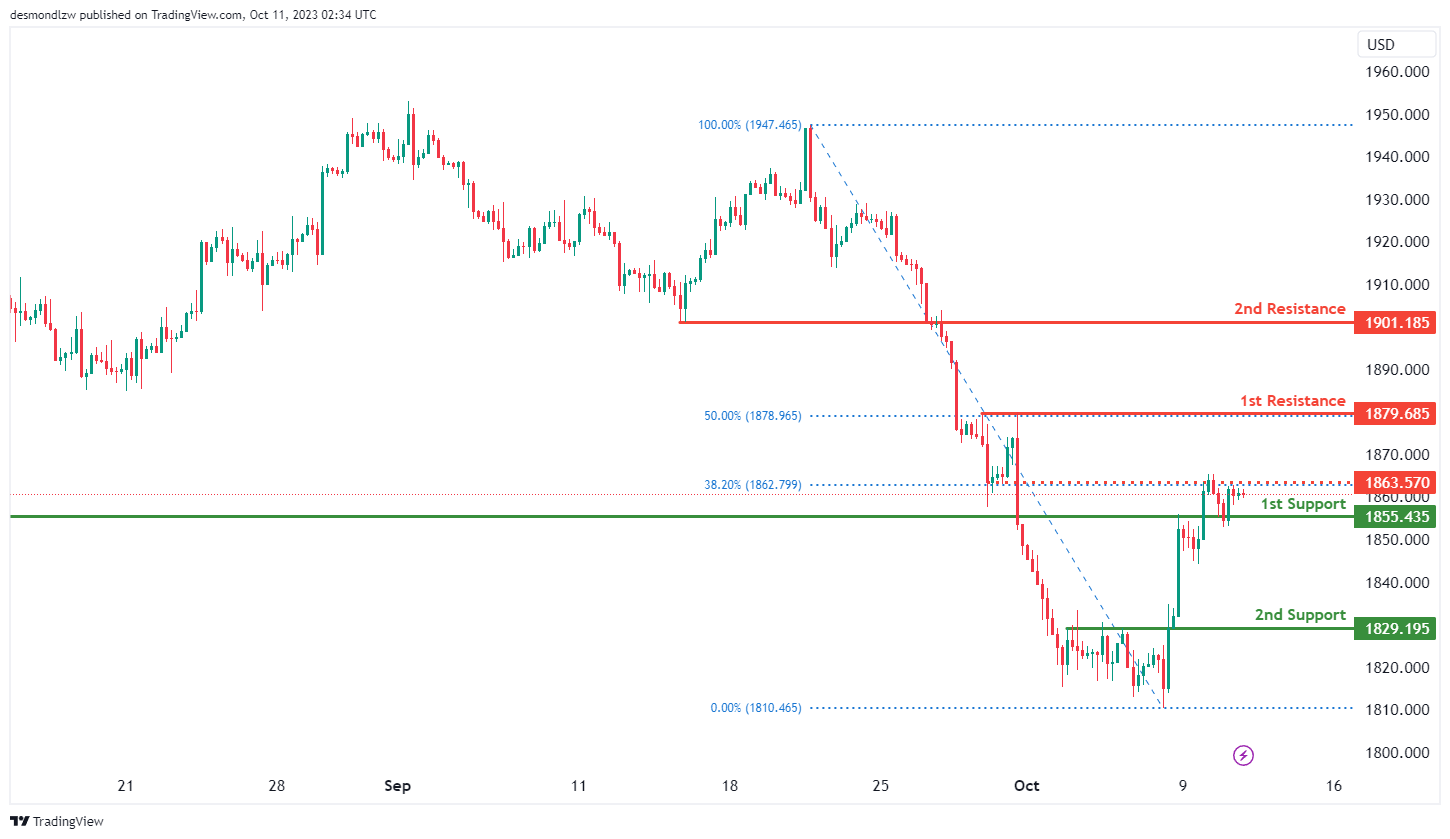
XAU/USD (GOLD):
The XAU/USD chart currently exhibits a weak bullish momentum, with a potential scenario of a bullish continuation towards the 1st resistance level should price break above the intermediate resistance level.
The intermediate resistance level at 1,863.57 is identified as a pullback resistance that aligns with the 38.20% Fibonacci retracement level while the 1st resistance level at 1,879.69 is also noted as a pullback resistance that aligns with the 50.00% Fibonacci retracement level. Higher up, the 2nd resistance level at 1,901.19 is identified as a pullback resistance, potentially acting as a barrier to further upward movement.
To the downside, the 1st support level at 1,855.44 is identified as a pullback support. Additionally, the 2nd support level at 1,829.19 is also marked as a pullback support, further reinforcing its significance as an area where price may find support.


