
DXY:
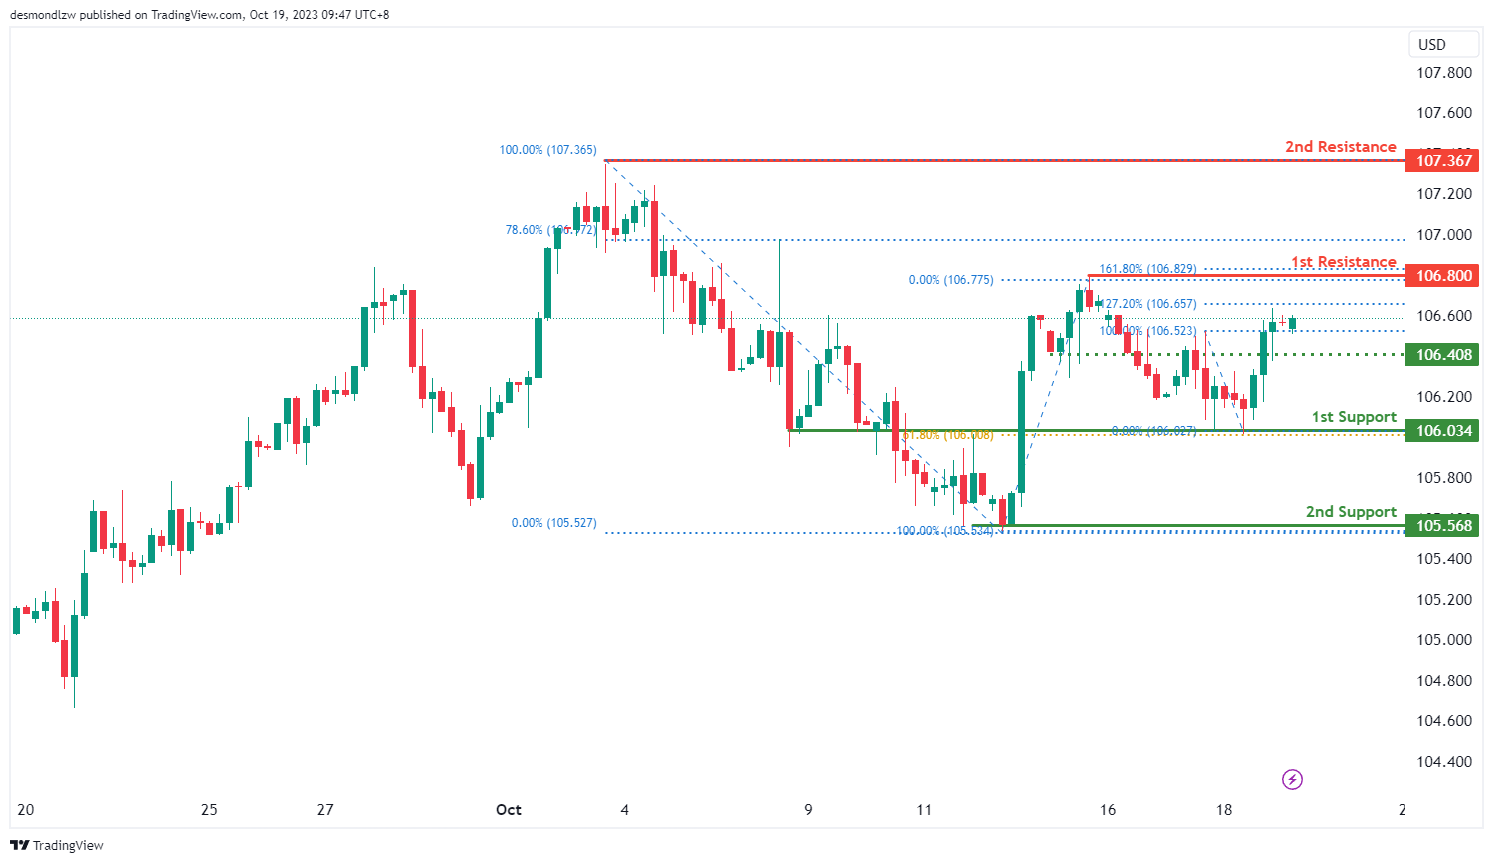
The DXY (US Dollar Index) chart currently displays a bullish overall momentum, suggesting the potential scenario of a bullish continuation towards the 1st resistance level.
The 1st support at 106.03 is considered significant as it aligns with an overlap support and coincides with the 61.80% Fibonacci Retracement level, providing a strong potential foundation of support. Additionally, the 2nd support at 105.56 is identified as a multi-swing low support, further reinforcing potential price support.
On the resistance side, the 1st resistance at 106.80 is characterized as a swing high resistance level, and beyond this, the 2nd resistance at 107.36 is identified as a swing high resistance.
Intermediate support at 106.40 also adds to the complexity of the technical levels, suggesting potential price interactions.
EUR/USD:
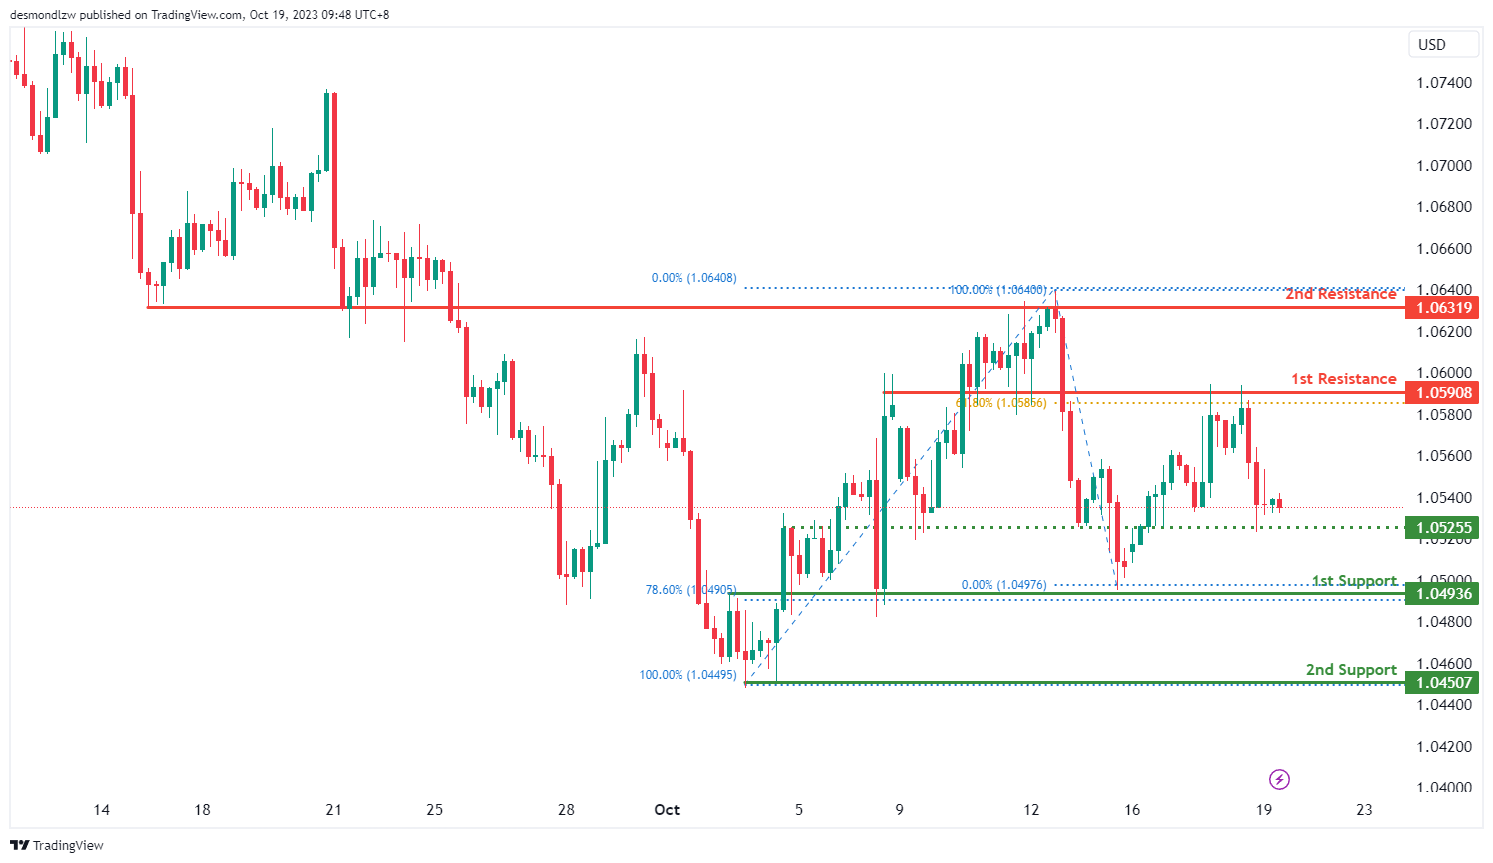
The EUR/USD chart currently demonstrates a bearish overall momentum, indicating the potential scenario of a bearish reaction off the 1st resistance level with a subsequent drop towards the 1st support.
The 1st support at 1.0493 is deemed significant as it aligns with an overlap support and coincides with the 78.60% Fibonacci Retracement level, providing a robust potential foundation of support. Additionally, the 2nd support at 1.0450 is identified as a swing low support, further reinforcing potential price support.
On the resistance side, the 1st resistance at 1.0590 is characterized as an overlap resistance and aligns with the 61.80% Fibonacci Retracement level. Beyond this, the 2nd resistance at 1.0631 is also identified as an overlap resistance.
Intermediate support at 1.0525 adds an additional layer to the technical levels, indicating potential price interactions.
EUR/JPY:
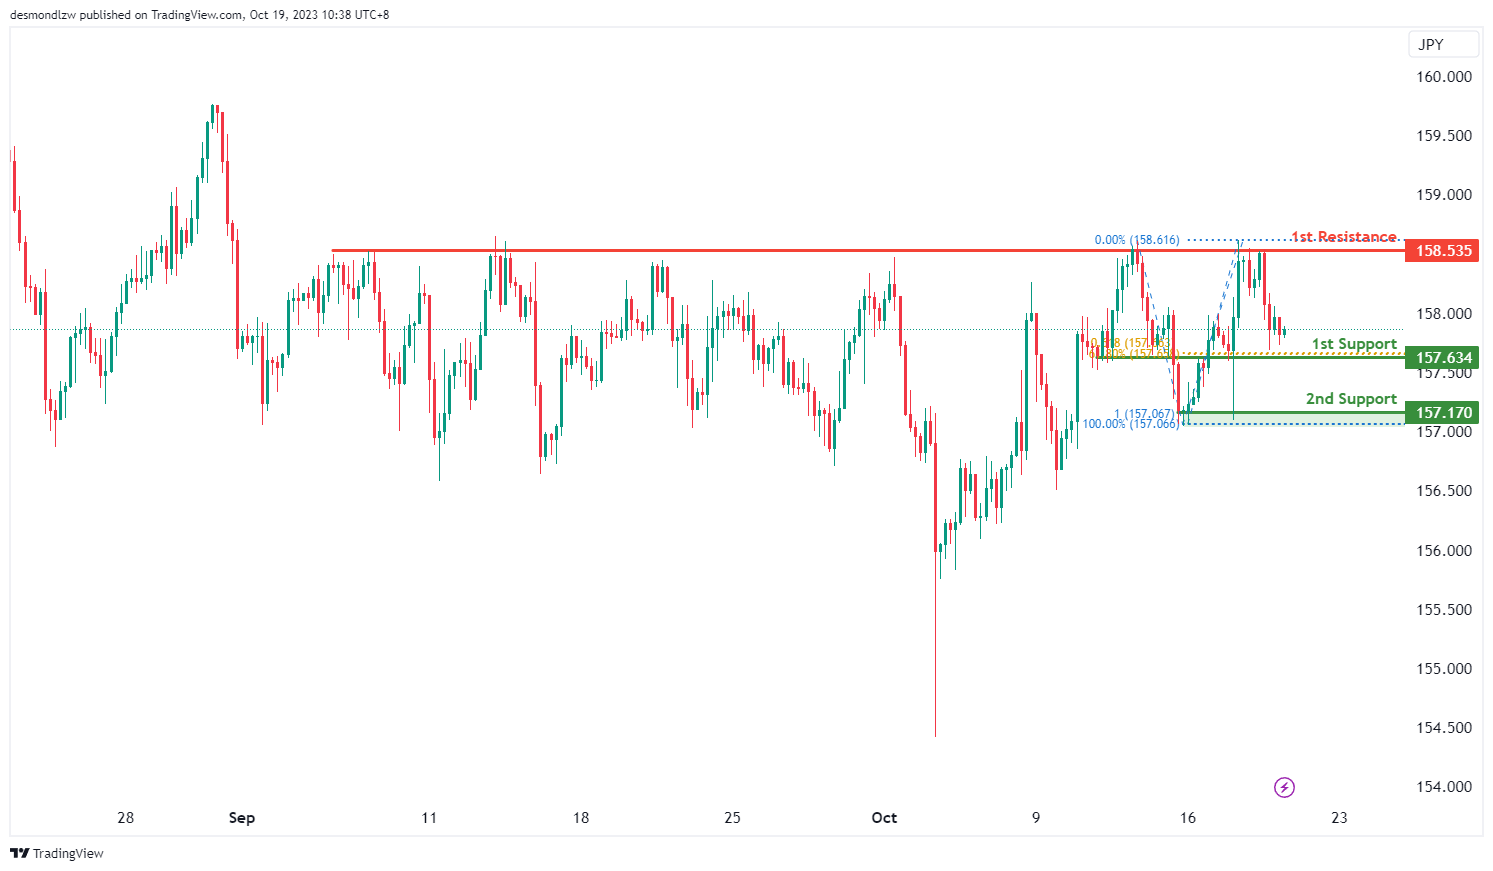
The instrument we are examining is EUR/JPY, and the overall momentum of the chart indicates a bearish trend.
There is a possibility that the price may continue in a bearish direction, potentially reaching the first support level.
The first support level is at 157.63, and it’s considered strong because it represents an overlap of support and aligns with a 61.80% Fibonacci Retracement and a 61.80% Fibonacci Projection, indicating a Fibonacci confluence.
The second support level is at 157.17, and it’s also significant as it marks a swing low support and corresponds to a 100% Fibonacci Projection.
On the resistance side, the first resistance level is at 158.53, and it’s noteworthy because it represents a multi-swing high resistance.
EUR/GBP:
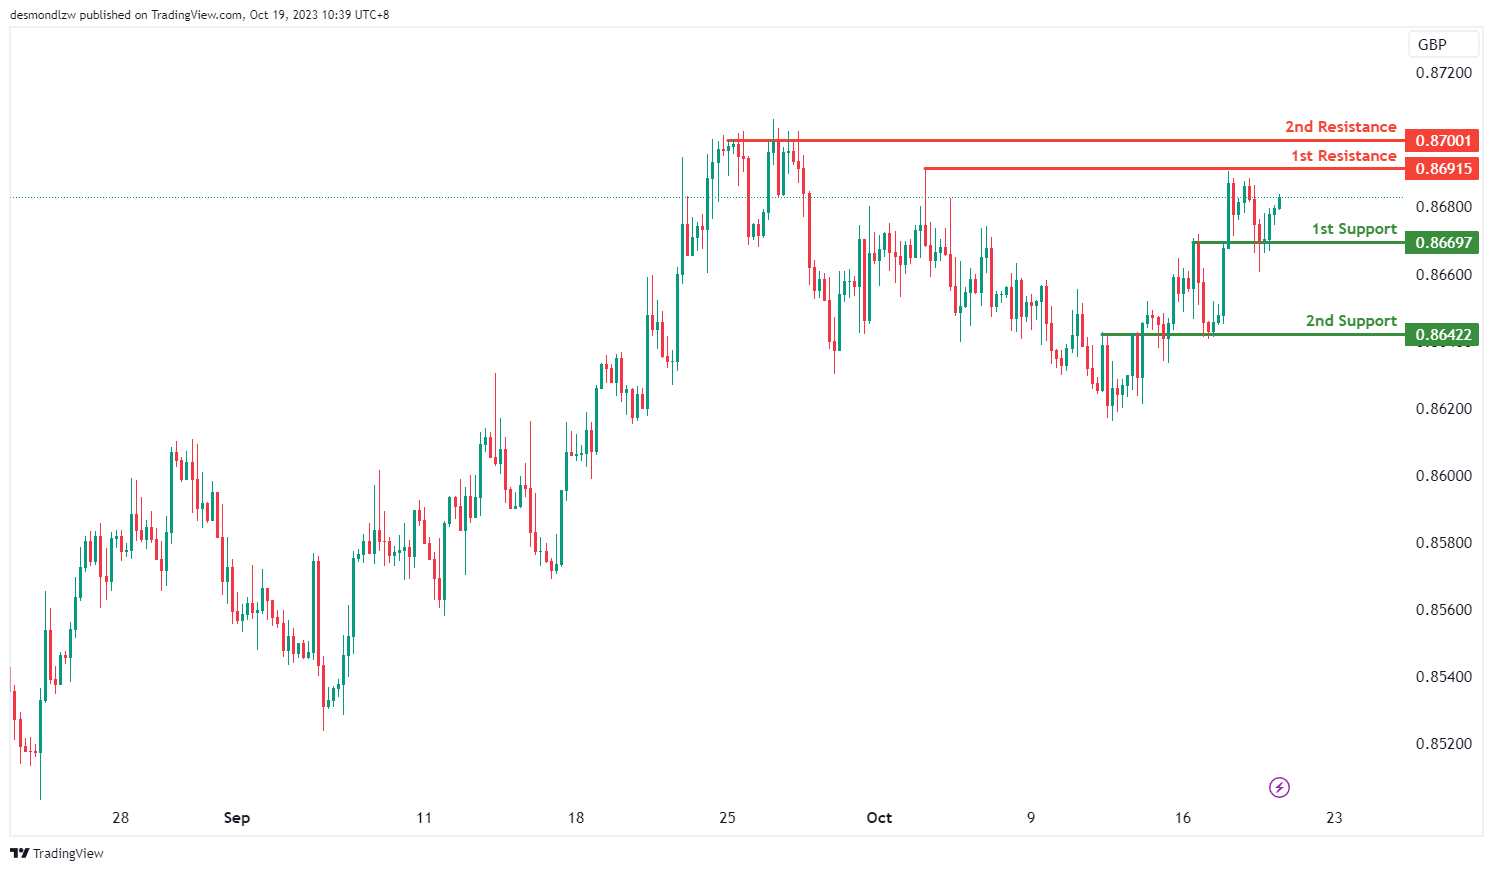
The instrument under analysis is EUR/GBP, and the overall momentum of the chart indicates a bullish trend.
There is a possibility that the price may continue in a bullish direction, potentially reaching the first resistance level.
The first support level is at 0.8669, and it’s considered strong because it represents an overlap of support.
The second support level is at 0.8642, and it’s also significant as it marks another overlap of support.
On the resistance side, the first resistance level is at 0.8691, and it’s noteworthy because it represents a multi-swing high resistance.
The second resistance level is at 0.8700, and it’s significant as well, as it also functions as a multi-swing high resistance.
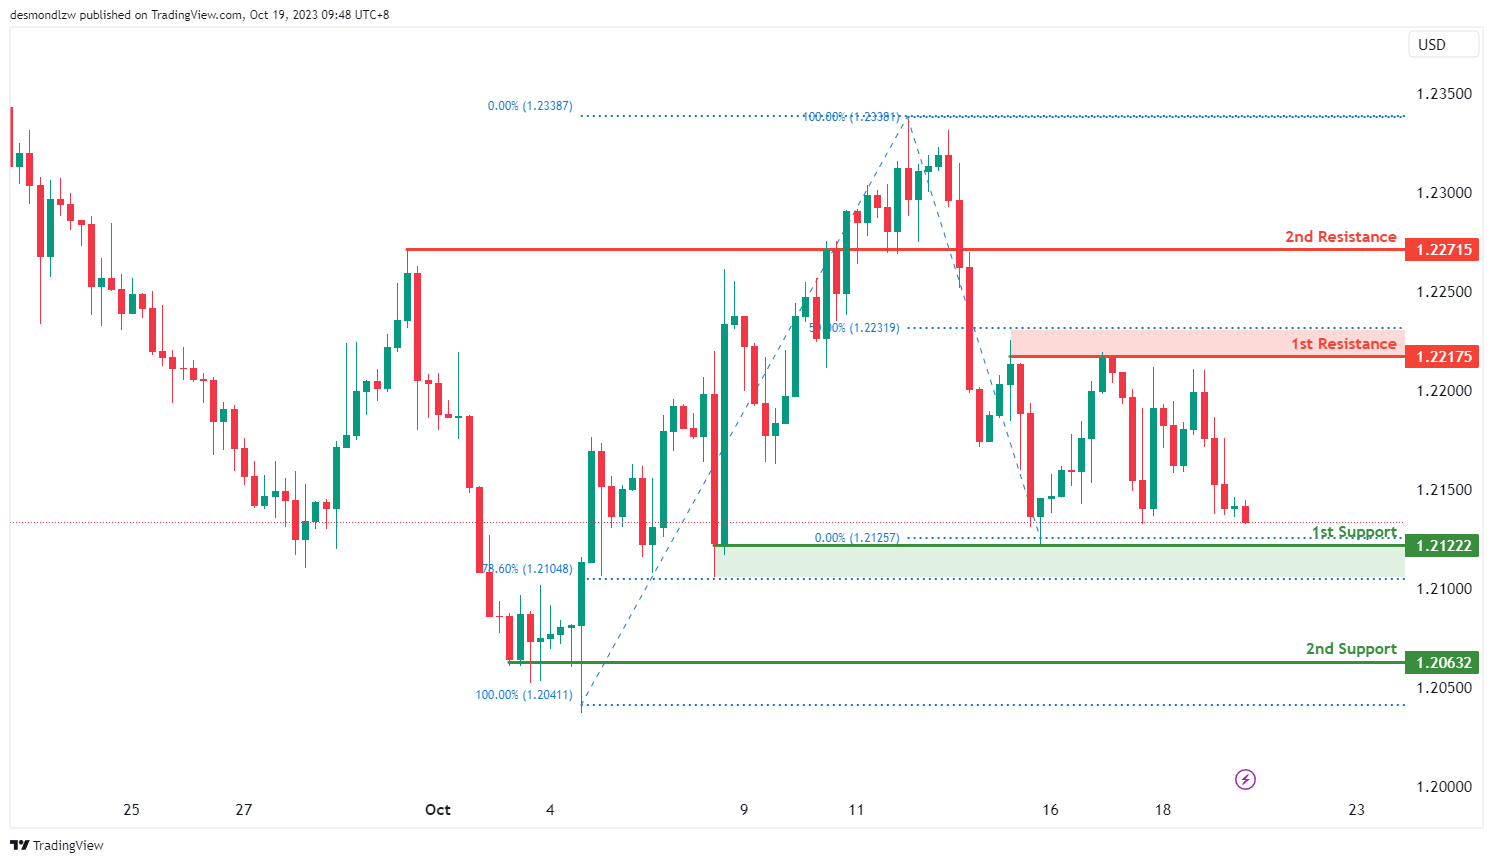
GBP/USD:
The GBP/USD chart is currently in a neutral state, suggesting the potential for price to fluctuate between the 1st resistance and 1st support levels.
The 1st support at 1.2122 is considered significant as it aligns with a multi-swing low support level and coincides with the 78.60% Fibonacci Retracement level, providing a strong potential support zone. Additionally, the 2nd support at 1.2063 is identified as a multi-swing low support, adding another layer of potential price support.
On the resistance side, the 1st resistance at 1.2217 is characterized as a multi-swing high resistance level, and beyond this, the 2nd resistance at 1.2271 is identified as an overlap resistance.
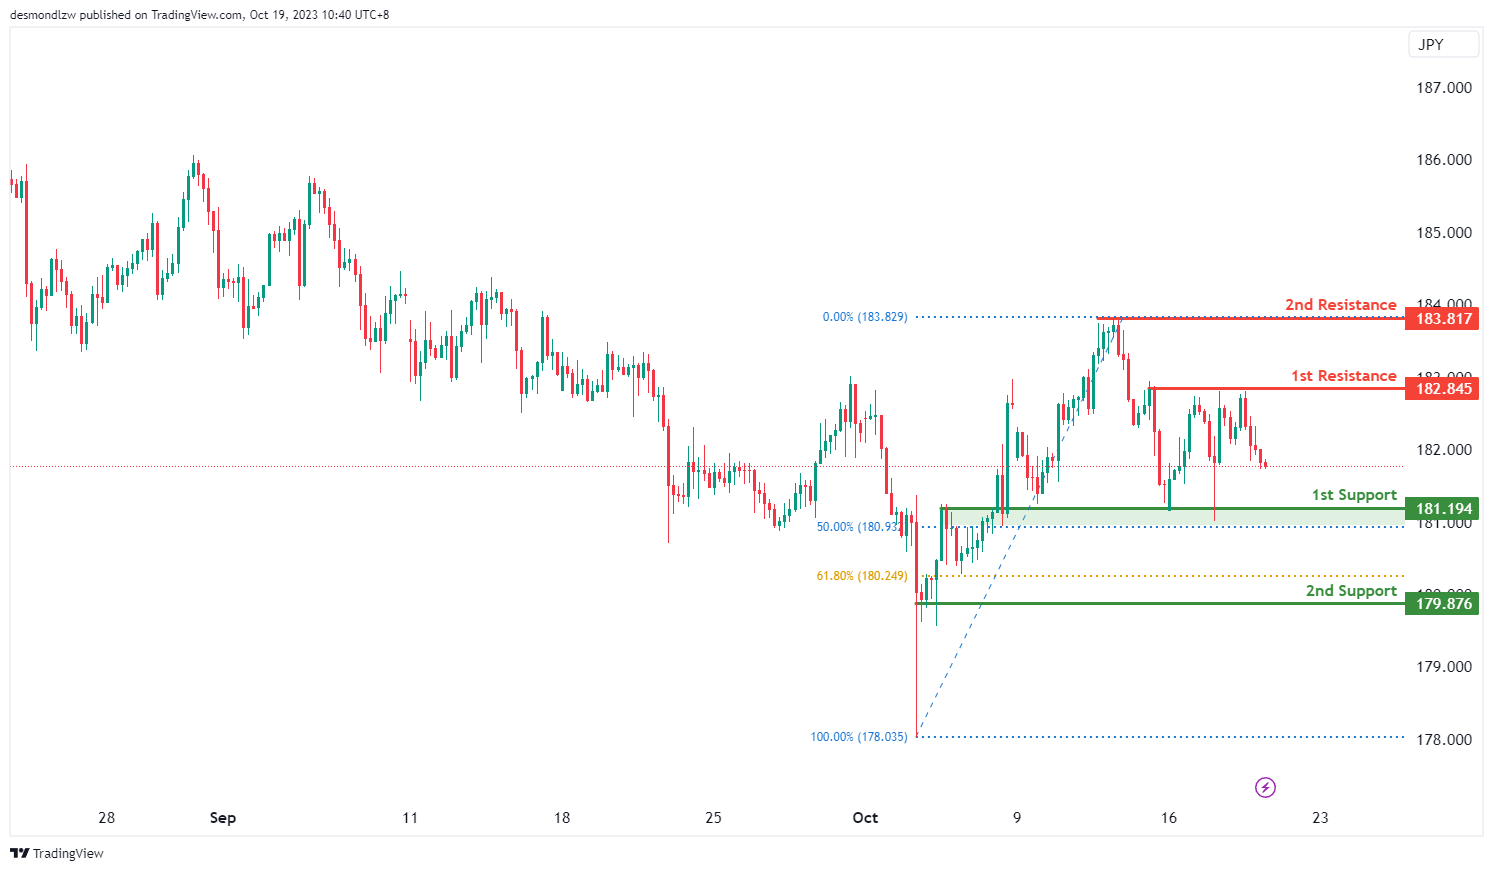
GBP/JPY:
The instrument being analyzed is GBP/JPY, and the overall momentum of the chart indicates a bearish trend.
There is a possibility that the price may continue in a bearish direction, potentially reaching the first support level.
The first support level is at 181.19, and it’s considered strong because it represents an overlap of support and aligns with a 50% Fibonacci Retracement.
The second support level is at 179.87, and it’s also significant as it marks a swing low support and corresponds to a 61.80% Fibonacci Retracement.
On the resistance side, the first resistance level is at 182.84, and it’s noteworthy because it represents a multi-swing high resistance.
The second resistance level is at 183.81, and it’s significant as well, as it represents a swing high resistance.
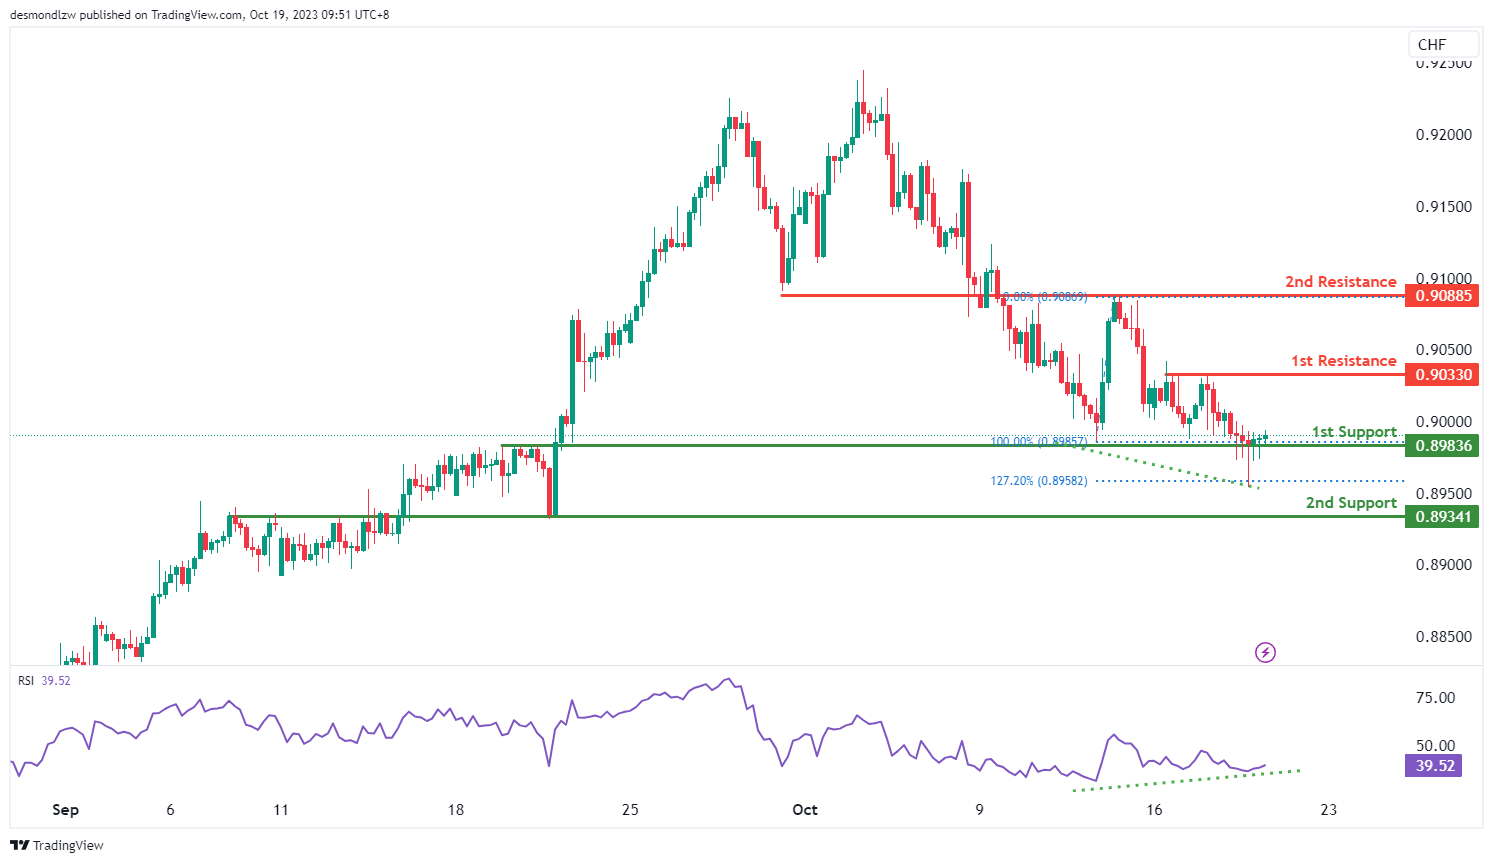
USD/CHF:
The USD/CHF chart currently indicates a bullish momentum, with the potential scenario of a bullish bounce off the 1st support level towards the 1st resistance.
The 1st support at 0.8983 is considered significant as it aligns with an overlap support level. Additionally, the 2nd support at 0.8934 is identified as an overlap support, reinforcing the strength of potential support.
On the resistance side, the 1st resistance at 0.9033 is characterized as a multi-swing high resistance level, and beyond this, the 2nd resistance at 0.9088 is identified as an overlap resistance.
In addition, the Relative Strength Index (RSI) is displaying bullish divergence versus price, indicating the likelihood of a rapid increase in price. This divergence adds further weight to the potential for a bullish move.
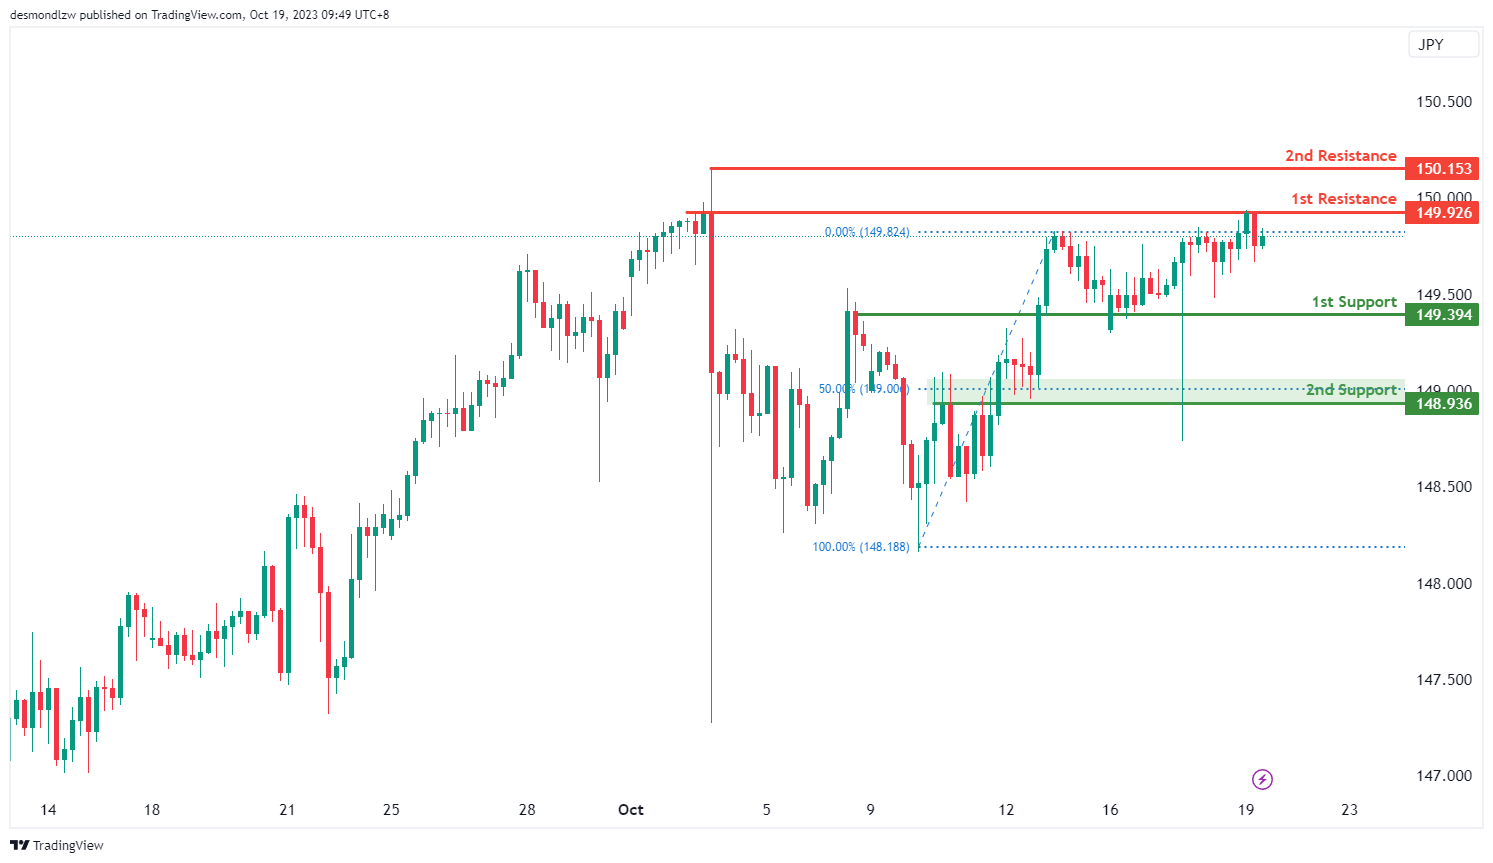
USD/JPY:
The USD/JPY chart currently shows a bearish momentum, with the potential scenario of a bearish continuation towards the 1st support level.
The 1st support at 149.39 is considered significant as it aligns with an overlap support level. Additionally, the 2nd support at 148.93 is identified as an overlap support and coincides with the 50% Fibonacci Retracement level, providing a strong foundation of potential support.
On the resistance side, the 1st resistance at 149.92 is characterized as a multi-swing high resistance level, and beyond this, the 2nd resistance at 150.15 is identified as a swing high resistance.
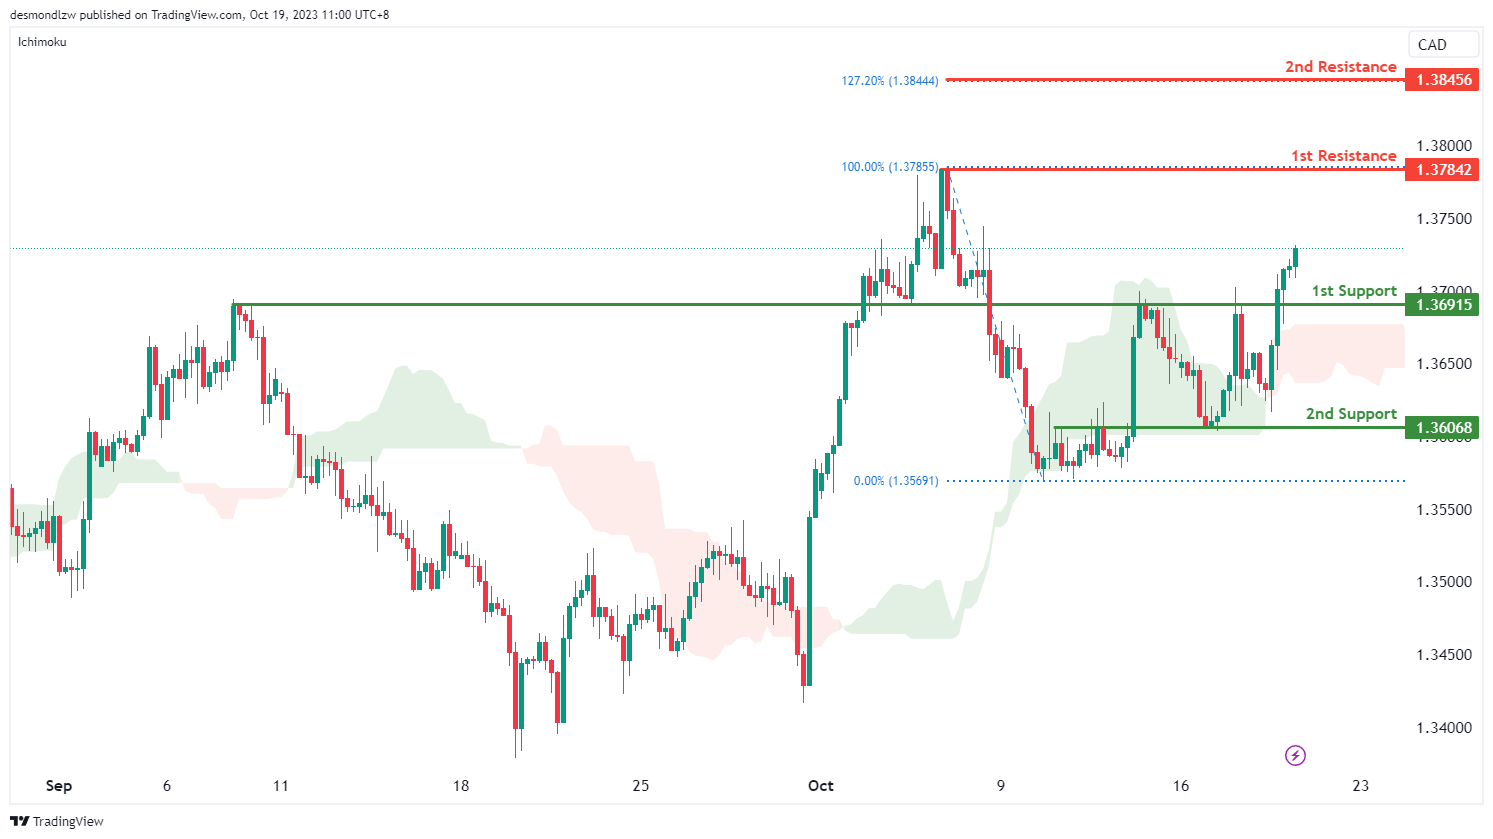
USD/CAD:
The USD/CAD chart currently exhibits a bullish momentum, suggesting a potential scenario for price to make a bullish continuation towards the 1st resistance level.
The 1st resistance level at 1.3784 is identified as a swing-high resistance. Higher up, the 2nd resistance level at 1.3846 is noted as a resistance level that aligns with the 127.20% Fibonacci extension level, potentially acting as a barrier to further bullish advances.
To the downside, the 1st support level at 1.3692 is identified as an overlap support. Additionally, the 2nd support level at 1.3607 is also noted as an overlap support, adding to its significance as a potential support zone.
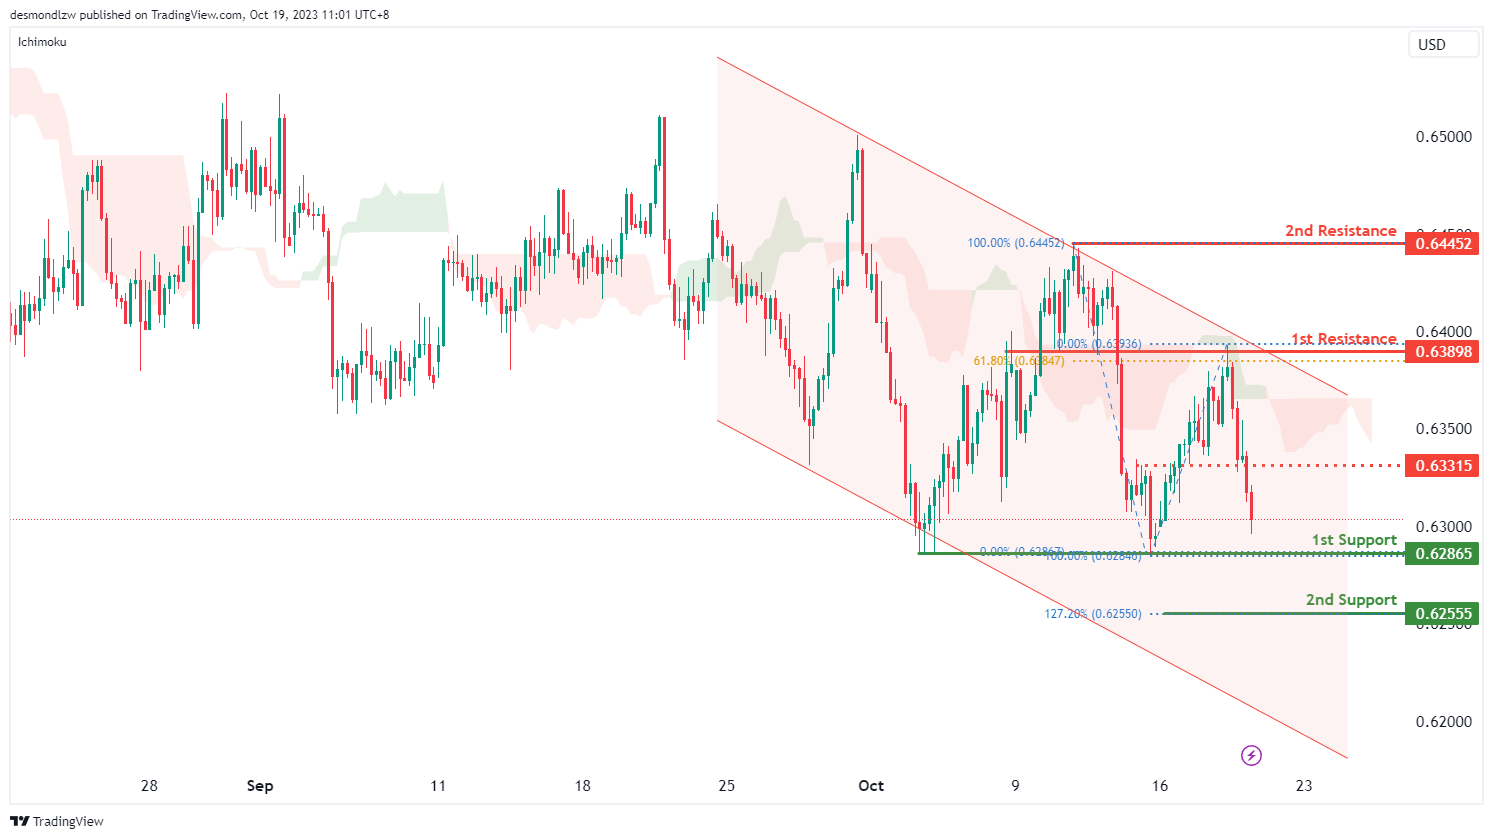
AUD/USD:
The AUD/USD chart currently exhibits a bearish momentum, with price trading within a bearish channel and under the bearish Ichimoku cloud. These factors indicate a potential scenario for price to make a bearish continuation towards the 1st support level.
The 1st support level at 0.6287 is identified as a multi-swing-low support. Additionally, the 2nd support level at 0.6256 is marked as a support level that aligns with the 127.20% Fibonacci extension level, further reinforcing its importance as a potential support area.
To the upside, the intermediate resistance level at 0.6332 is identified as an overlap resistance while the 1st resistance level at 0.6389 is also noted as an overlap resistance that aligns the 61.80% Fibonacci retracement level. Beyond this, the 2nd resistance level at 0.6445 is marked as a swing-high resistance, making it a potentially strong resistance level.
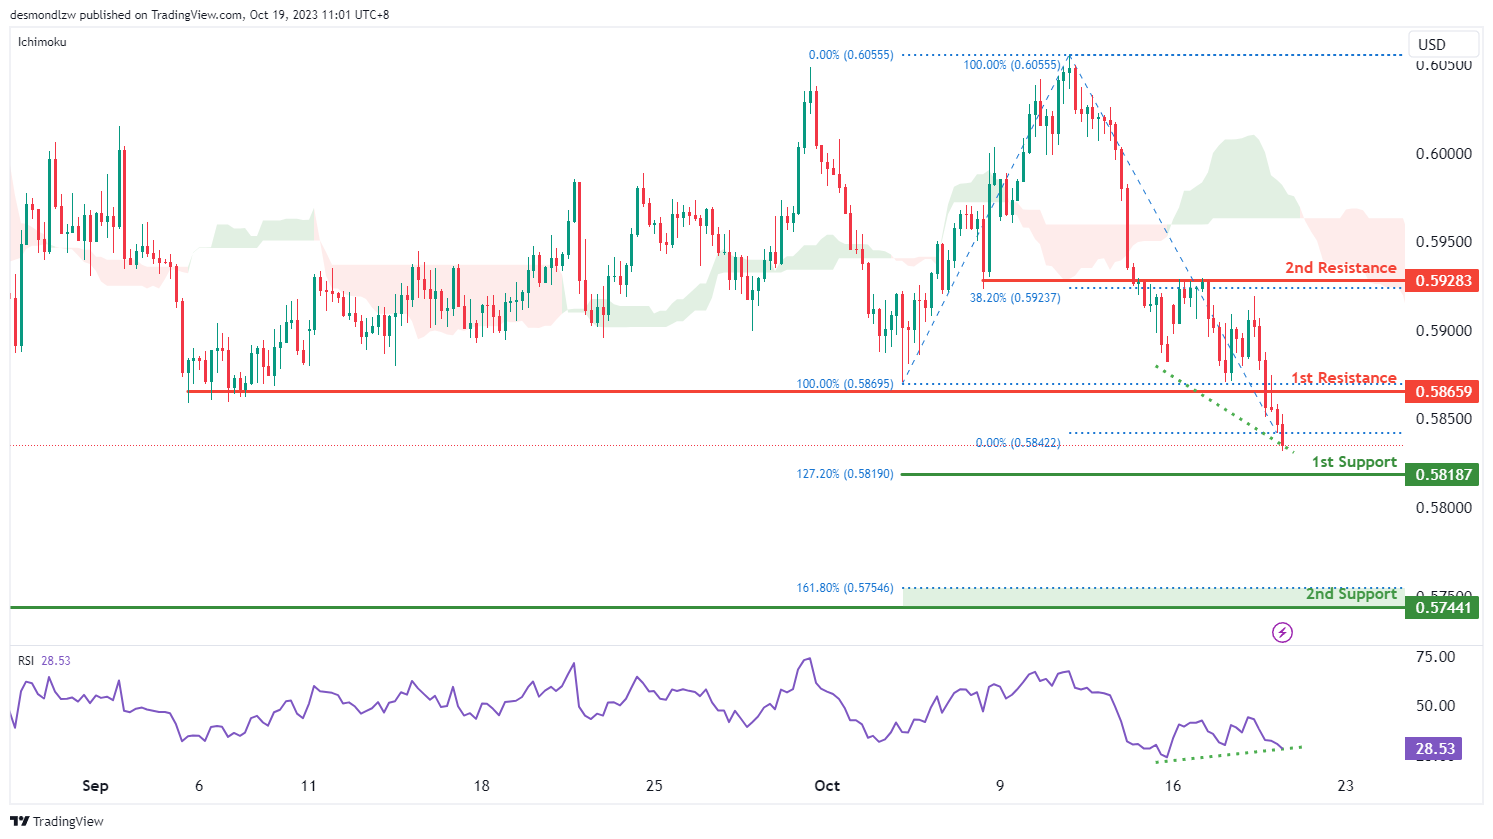
NZD/USD
The NZD/USD chart currently exhibits a bearish momentum, suggesting a potential scenario for price to make a bearish continuation towards the 1st support level. However, the Relative Strength Index (RSI) is displaying a bullish divergence versus price. This divergence suggests that there is a potential scenario for price to reverse course in the near-term.
The 1st support level at 0.5819 is identified as a support level that aligns with the 127.20% Fibonacci extension level. Further below, the 2nd support level at 0.5744 is noted as a pullback support level that aligns with the 161.80% Fibonacci extension level, indicating a potential support zone.
To the upside, the 1st resistance level at 0.5866 is identified as a pullback resistance. Beyond this, the 2nd resistance level at 0.5928 is marked as an overlap resistance that aligns with the 38.20% Fibonacci retracement level, making it a potentially strong resistance level.
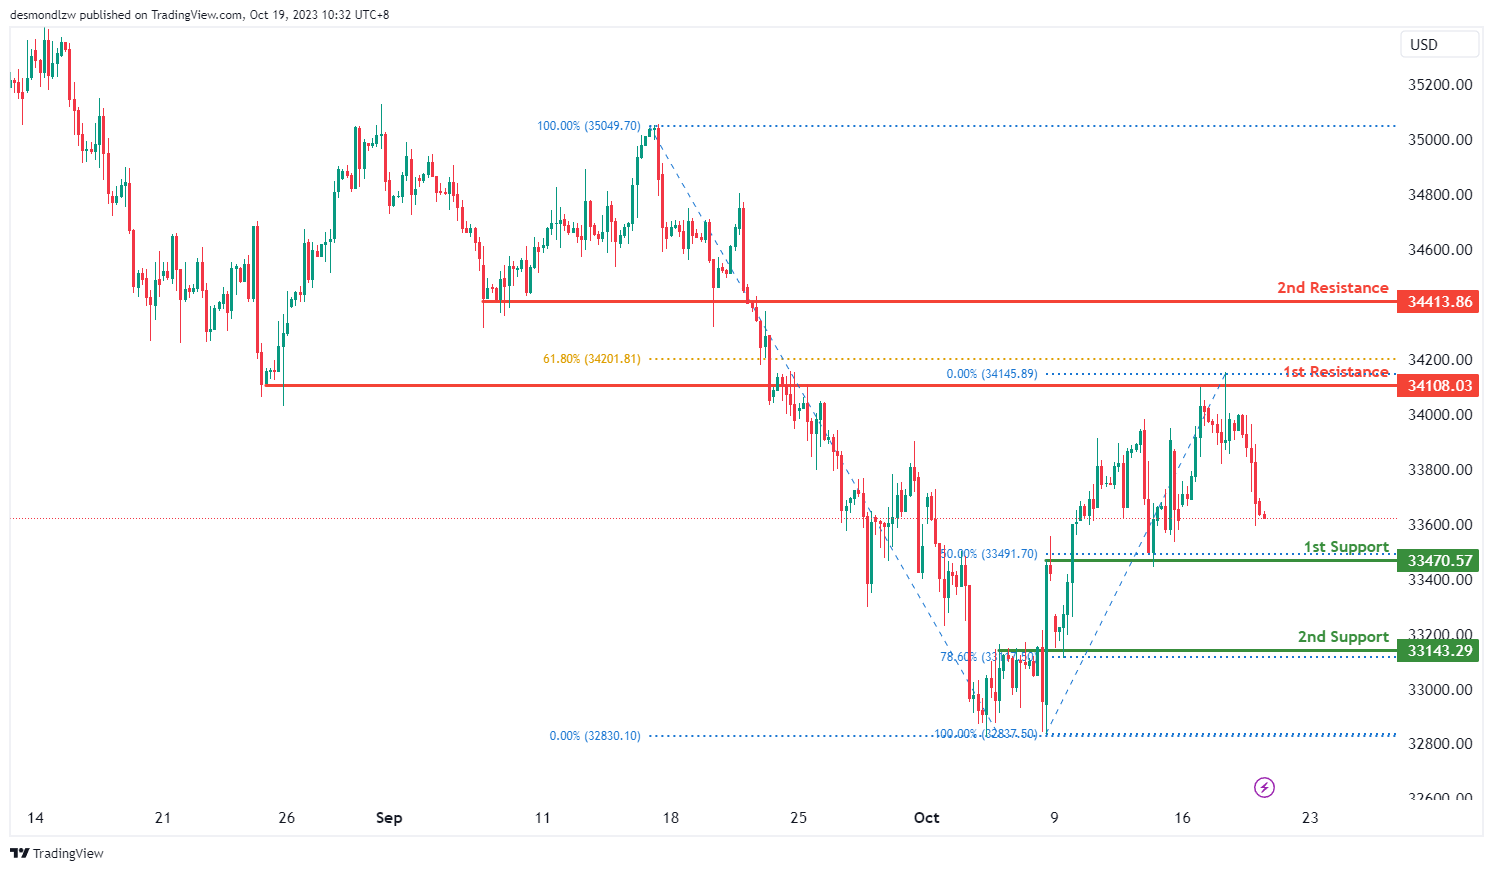
DJ30:
The instrument being analyzed is DJ30, and the current overall momentum of its chart is bearish.
There is a potential scenario where the price could make a bearish continuation towards the 1st support level, which is at 33,470.57.
The 1st support at 33,470.57 is considered significant because it represents an overlap support and aligns with a 50% Fibonacci Retracement. This suggests that it’s a strong level of potential price support.
Additionally, there is a 2nd support level at 33,143.29, which is valuable as it functions as an overlap support and corresponds to a 78.60% Fibonacci Retracement. This provides an additional layer of potential support.
On the resistance side, the 1st resistance level at 34,108.03 is considered important because it represents an overlap resistance, which could potentially act as a barrier to further price increases.
Moreover, there is a 2nd resistance level at 34,413.86, which is significant as it represents a pullback resistance. These resistance levels suggest potential areas where the price might encounter selling pressure, contributing to the overall bearish outlook for DJ30.
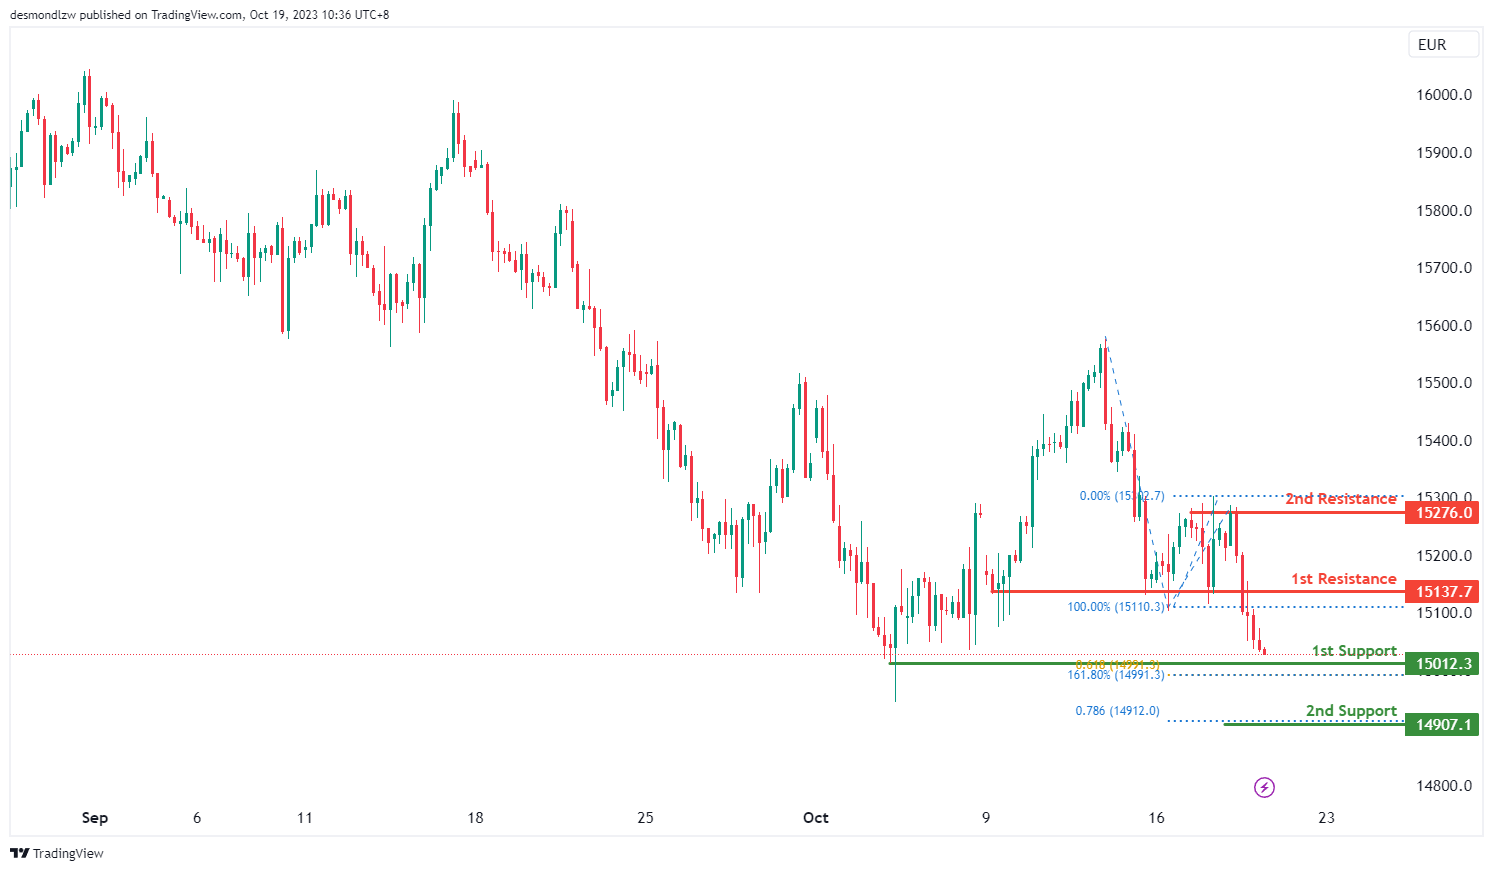
GER40:
The instrument under analysis is GER40, and the prevailing momentum on its chart is currently bearish.
In a possible scenario, the price is expected to continue in a bearish direction, moving towards the 1st support level at 15,012.30.
This 1st support level at 15,012.30 holds significance for several reasons. First, it represents a swing low support, indicating that it has previously acted as a level where the price found support. Additionally, it aligns with a 61.80% Fibonacci Projection and a 161.80% Fibonacci Extension, which implies a high degree of Fibonacci confluence. This suggests a strong potential for this level to provide support to the price.
Furthermore, there is a 2nd support level at 14,907.10, which is also notable due to its alignment with a 78.60% Fibonacci Projection. This reinforces its potential as a support level.
On the resistance side, the 1st resistance level at 15,137.70 is significant as it acts as a pullback resistance, suggesting it may present a challenge to upward price movement.
Moreover, there is a 2nd resistance level at 15,276.00, which is considered important because it represents multi-swing high resistance. These resistance levels indicate areas where the price might encounter selling pressure, contributing to the bearish momentum of GER40.
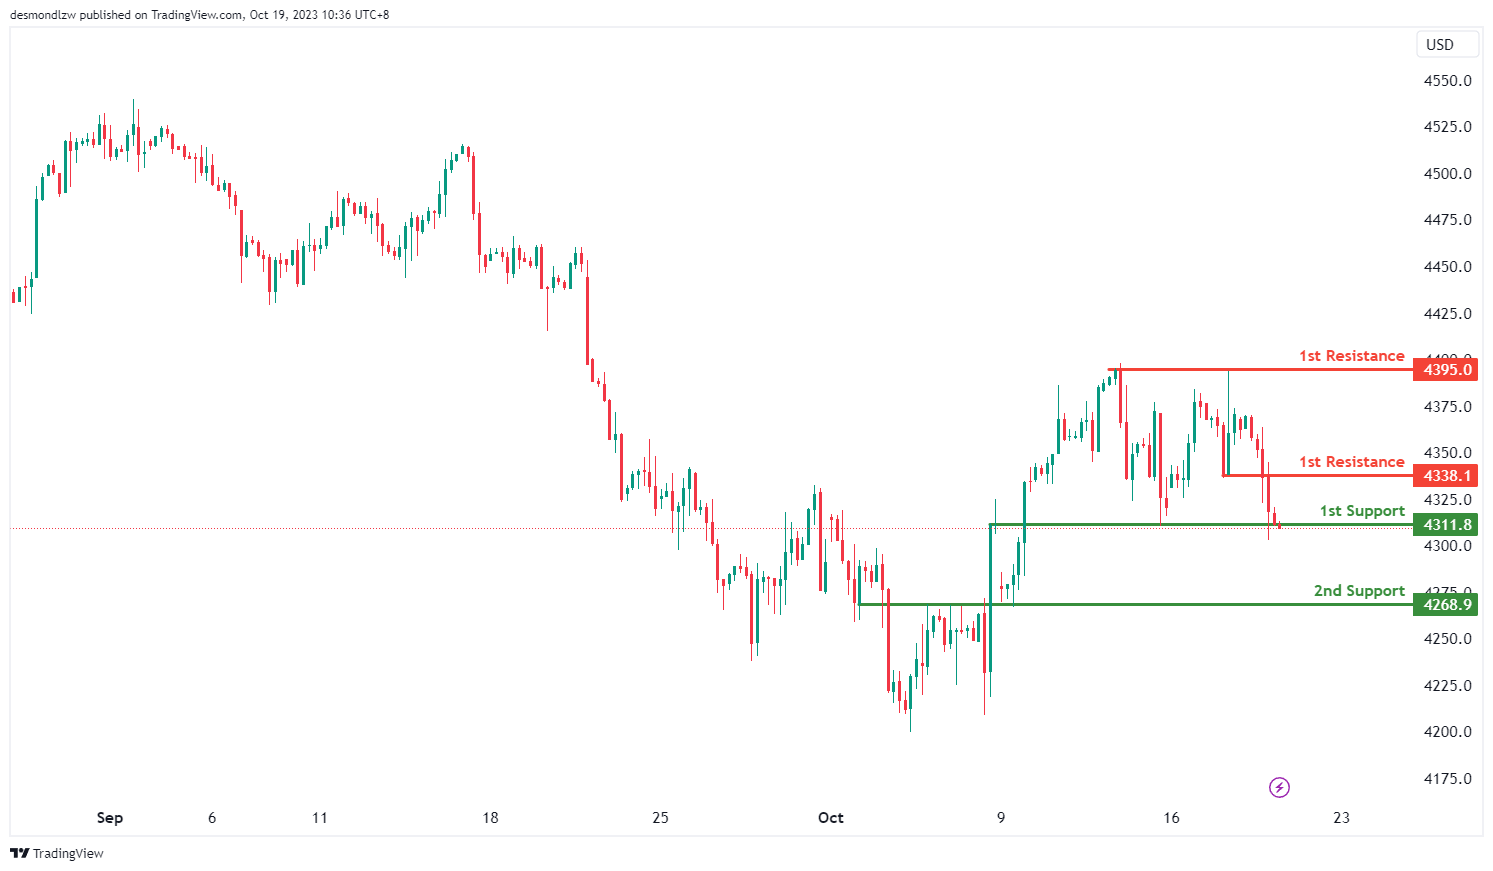
US500
The instrument under analysis is US500, and the overall momentum on its chart is currently bearish.
In a possible scenario, the price is expected to experience a bearish break off the 1st support level at 4311.8 and drop towards the 2nd support at 4268.9.
The 1st support level at 4311.8 is considered significant as it aligns with an overlap support. This indicates that it has previously acted as a level where the price found support, which adds to its importance as a potential price floor.
Additionally, there is a 2nd support level at 4268.9, which is also an overlap support. The presence of two overlap support levels suggests that this area may provide strong support for the price.
On the resistance side, the 1st resistance level at 4338.1 is important as it is a pullback resistance. This implies that it could pose a challenge to upward price movement.
Furthermore, there is a 2nd resistance level at 4395.0, which is described as a multi-swing high resistance. These resistance levels represent areas where selling pressure may emerge, contributing to the overall bearish momentum of US500.
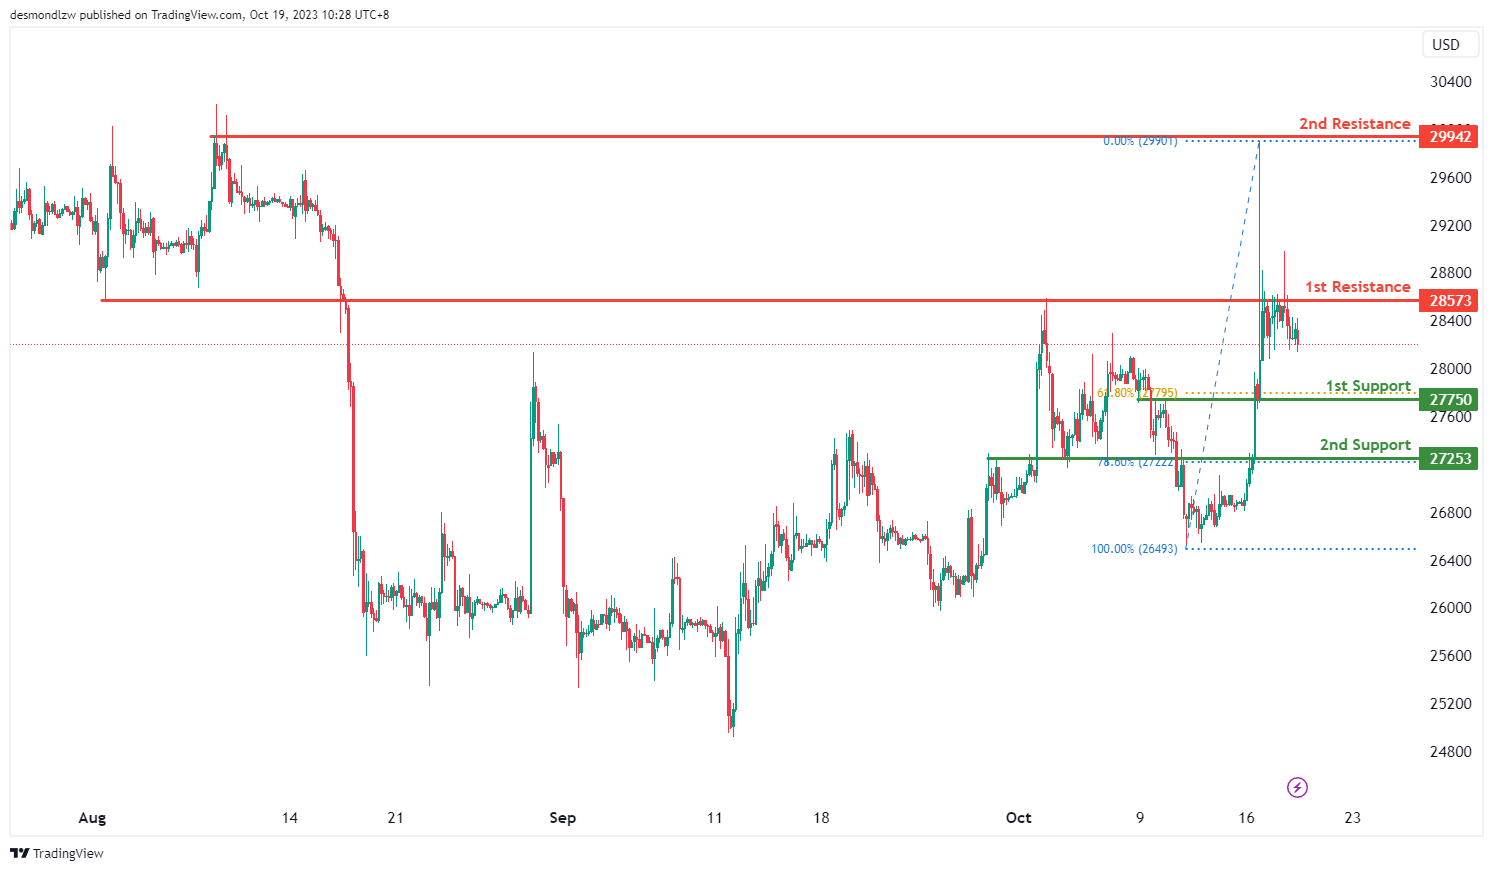
BTC/USD:
The instrument being analyzed is BTC/USD, and the current overall momentum of its chart is bearish.
There is a potential scenario where the price could make a bearish continuation towards the 1st support level, which is at 27,750.
The 1st support at 27,750 is considered significant because it represents an overlap support and aligns with a 61.80% Fibonacci Retracement. This suggests that it’s a strong level of potential price support.
Additionally, there is a 2nd support level at 27,253, which is valuable as it functions as a pullback support and corresponds to a 78.60% Fibonacci Retracement. This provides an additional layer of potential support.
On the resistance side, the 1st resistance level at 28,573 is considered important because it represents an overlap resistance, which could potentially act as a barrier to further price increases.
Moreover, there is a 2nd resistance level at 29,942, which is significant as it represents a multi-swing high resistance. These resistance levels suggest potential areas where the price might encounter selling pressure, contributing to the overall bearish outlook for BTC/USD.
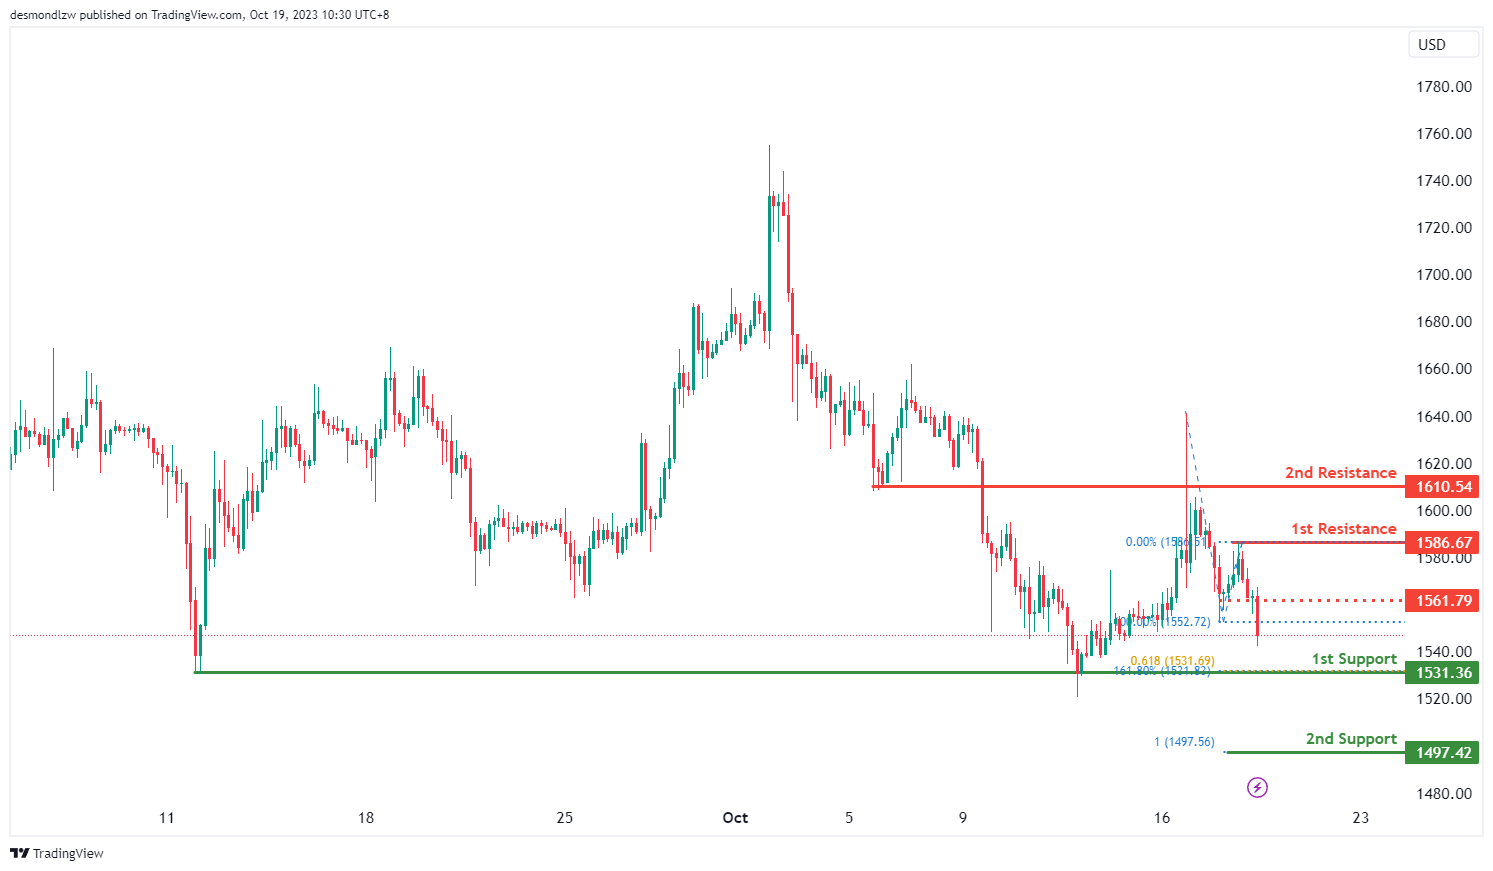
ETH/USD:
The instrument being analyzed is ETH/USD, and the current overall momentum of its chart is bearish.
There is a potential scenario where the price could make a bearish continuation towards the 1st support level, which is at 1,531.36.
The 1st support at 1,531.36 is considered significant because it represents a multi-swing low support, indicating a level where price may find support during a bearish move.
Additionally, there is a 2nd support level at 1,497.42, which is important as it aligns with a 100% Fibonacci Projection, suggesting it’s a strong potential support level.
On the resistance side, the 1st resistance level at 1,586.67 is considered important because it represents a swing high resistance. This level may act as a barrier to further price increases.
Furthermore, there is a 2nd resistance level at 1,610.54, which is significant as it represents an overlap resistance.
Additionally, there’s an intermediate resistance level at 1,561.79, which is valuable as it functions as a pullback resistance. These levels provide potential areas where price might encounter resistance, contributing to the overall bearish outlook for ETH/USD.
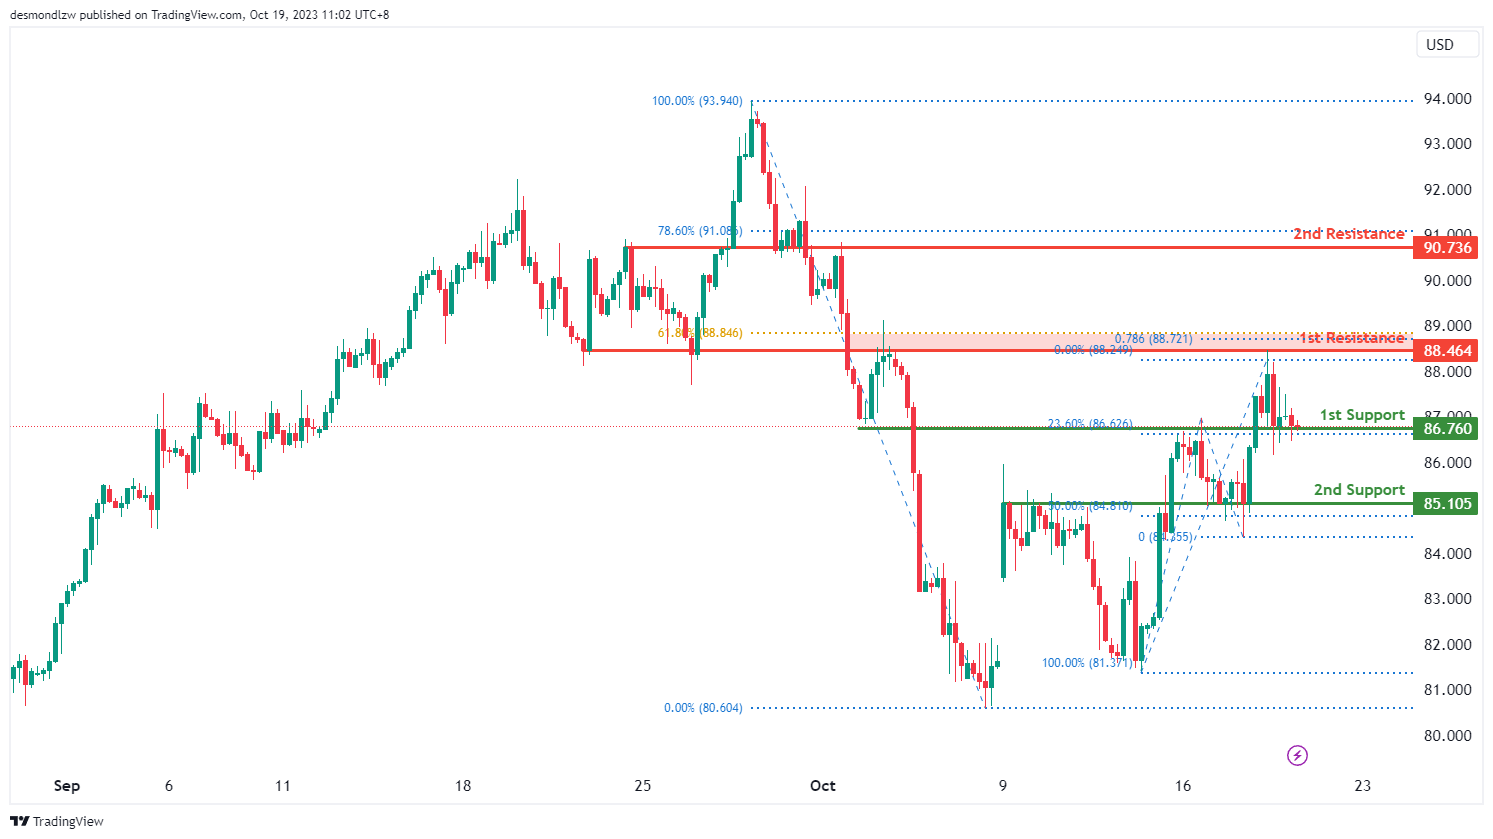
WTI/USD:
The WTI chart currently shows a weak bullish momentum, indicating a potential scenario for price to make a bullish bounce off the 1st support level and make a bullish continuation towards the 1st resistance level.
The 1st support level at 86.76 is identified as an overlap support level that aligns with the 23.60% Fibonacci retracement level. Additionally, the 2nd support level at 85.11 is also noted as an overlap support that aligns with the 50.00% Fibonacci retracement level, indicating a potential support zone.
To the upside, the 1st resistance level at 88.46 is identified as an overlap resistance that aligns with a confluence of Fibonacci levels i.e. the 61.80% retracement and the 78.60% projection levels. Beyond this, the 2nd resistance level at 90.74 is also marked as an overlap resistance level that aligns close to the 78.60% Fibonacci retracement level.
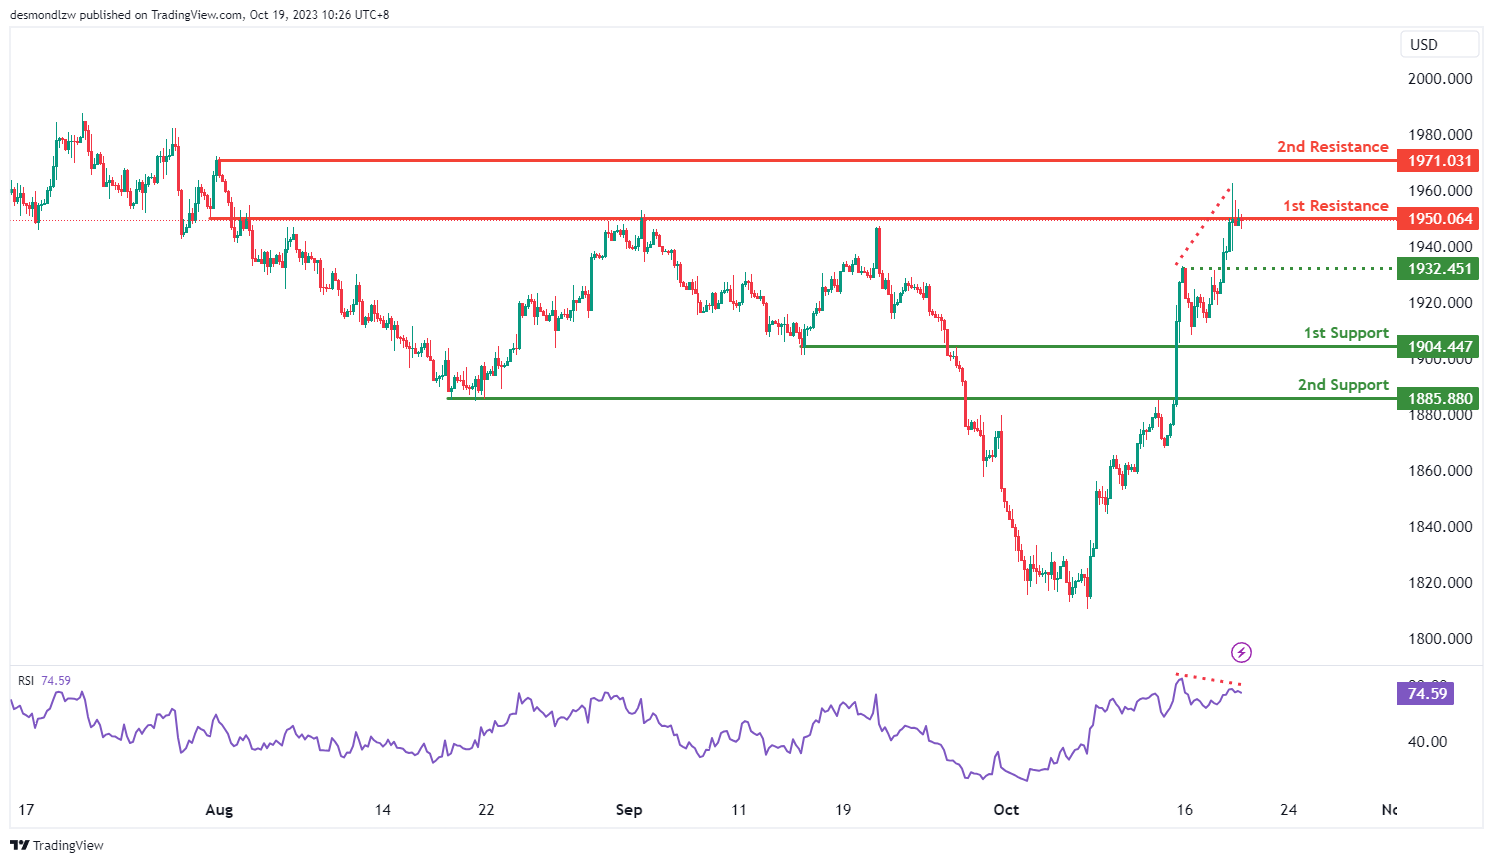
XAU/USD (GOLD):
The XAU/USD chart currently exhibits a bearish momentum, with the potential scenario of a bearish reaction off the 1st resistance level and a drop towards the 1st support.
The 1st support at 1904.44 is considered significant as it aligns with a pullback support level. Additionally, the 2nd support at 1885.88 is identified as a pullback support.
On the resistance side, the 1st resistance at 1950.06 is characterized as an overlap resistance and coincides with the 161.80% Fibonacci Retracement level, providing a strong potential resistance point. Beyond this, the 2nd resistance at 1071.00 is identified as a swing high resistance.
It’s worth noting that the RSI is also displaying bearish divergence versus price, suggesting the possibility of a reversal occurring soon.


