
DXY:
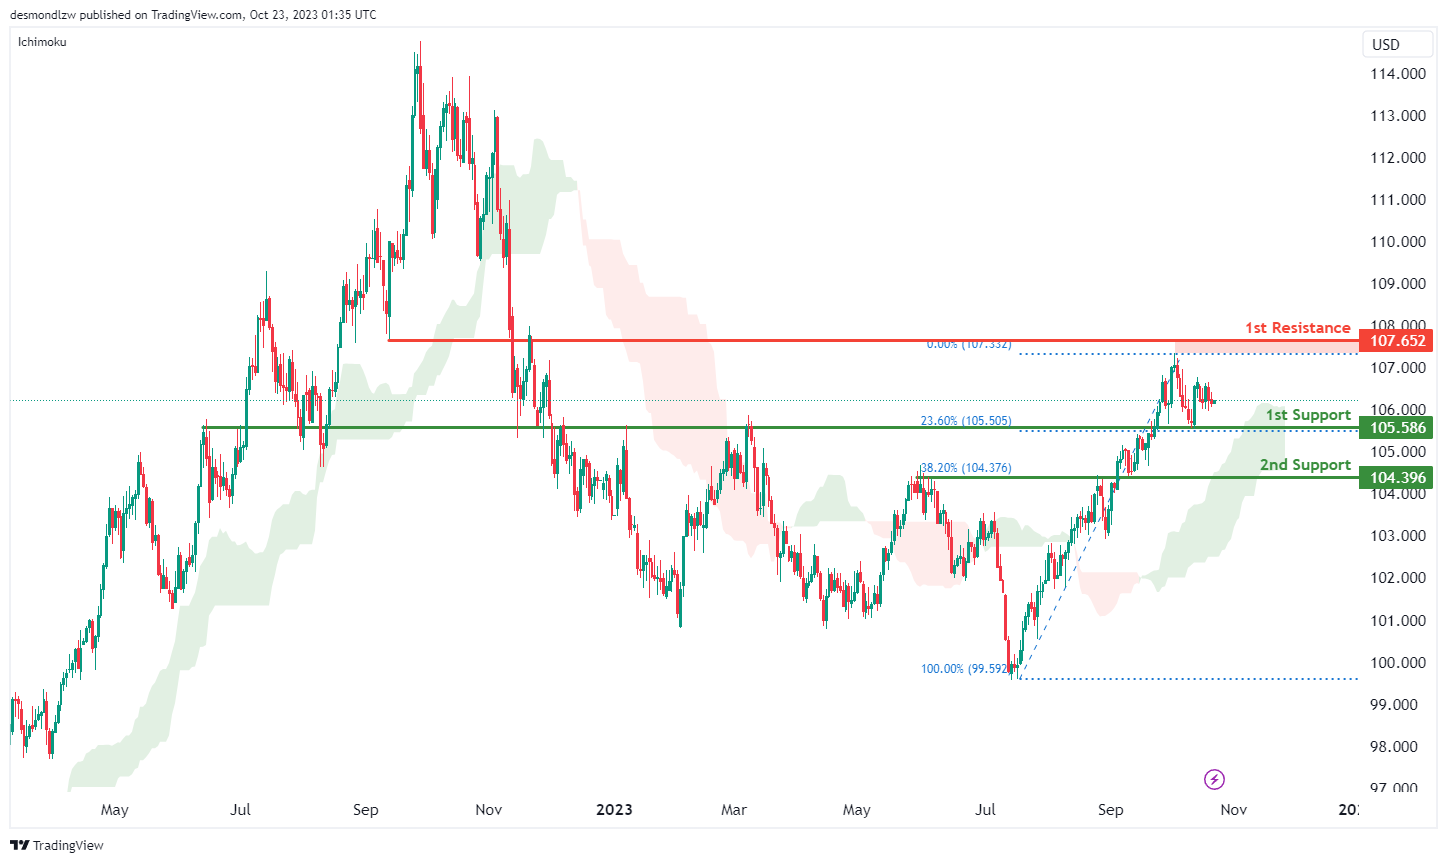
The DXY chart currently maintains a bullish momentum, with the price positioned above the bullish Ichimoku cloud. There is a potential scenario where price could experience a bullish bounce off the 1st support level and head towards the 1st resistance.
The 1st support at 105.58 is considered significant as it aligns with an overlap support level and coincides with the 23.60% Fibonacci Retracement level. Additionally, the 2nd support at 104.39 is identified as an overlap support and corresponds to the 38.20% Fibonacci Retracement level.
On the resistance side, the 1st resistance at 107.65 is characterized as an overlap resistance.
EUR/USD:
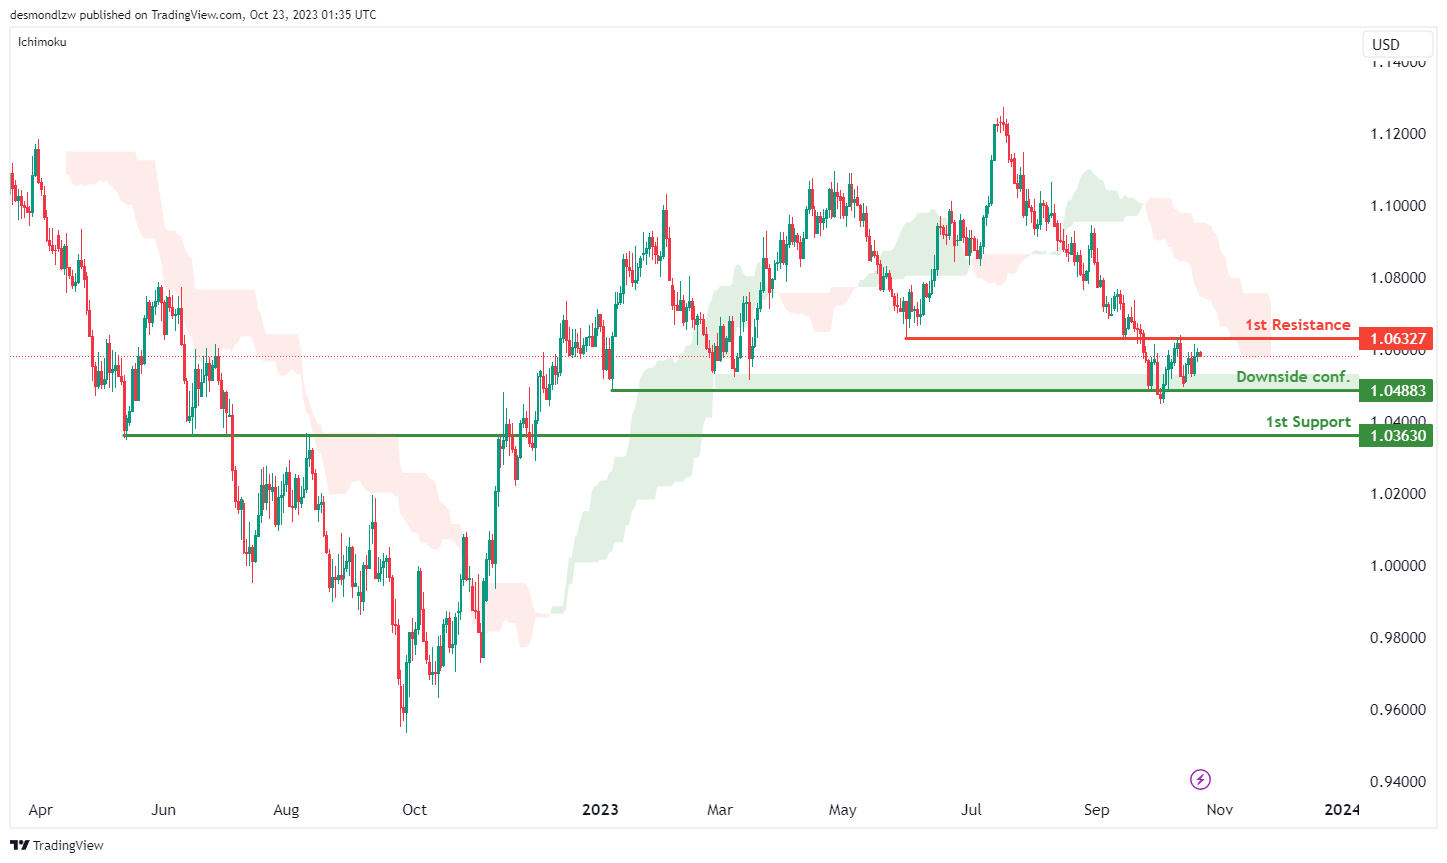
The EUR/USD chart currently exhibits a bearish momentum, with price positioned below the bearish Ichimoku cloud. There’s a potential scenario where price could experience a bearish reaction off the 1st resistance and drop towards the 1st support.
The 1st support at 1.0363 is considered significant as it aligns with an overlap support level and coincides with the 78.60% Fibonacci Retracement level. Traders may also watch for downside confirmation at the 1.0488 level, which is identified as a swing low support.
On the resistance side, the 1st resistance at 1.0632 is characterized as an overlap resistance.
EUR/JPY:
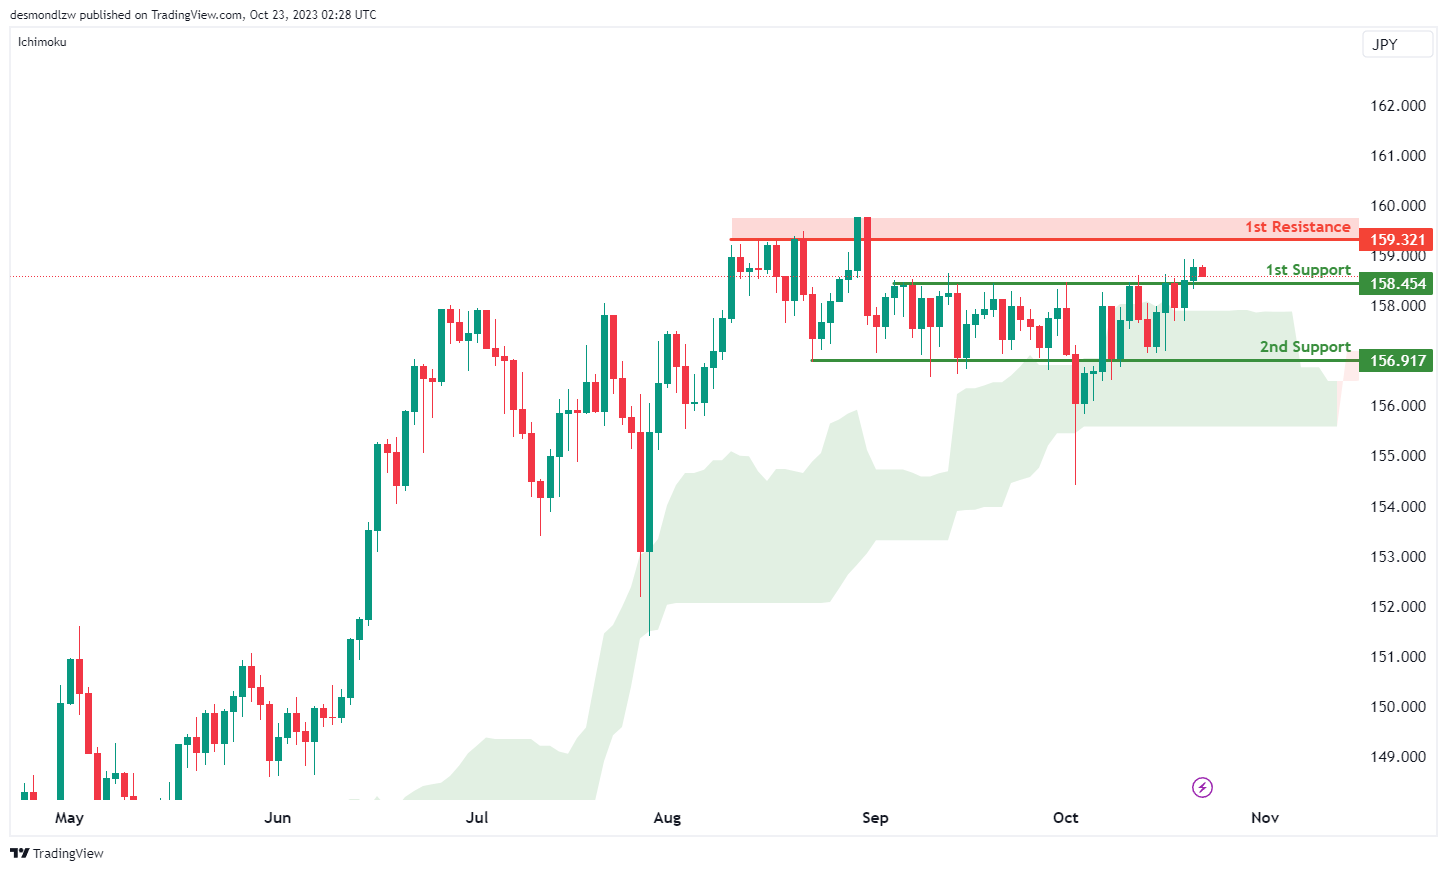
The instrument we are analyzing is EUR/JPY, and the overall momentum of the chart is bullish. One of the factors contributing to this momentum is that the price is above the bullish Ichimoku cloud, a commonly used technical indicator in trading.
There is a possibility that the price may experience a bullish bounce when approaching the first support level and then head towards the first resistance level.
The first support level is at 158.45, and it’s considered strong because it represents an overlap of support.
The second support level is at 156.91, and it’s also significant as it marks another overlap of support.
On the resistance side, the first resistance level is at 159.32, and it’s noteworthy because it represents a pullback resistance.
EUR/GBP:
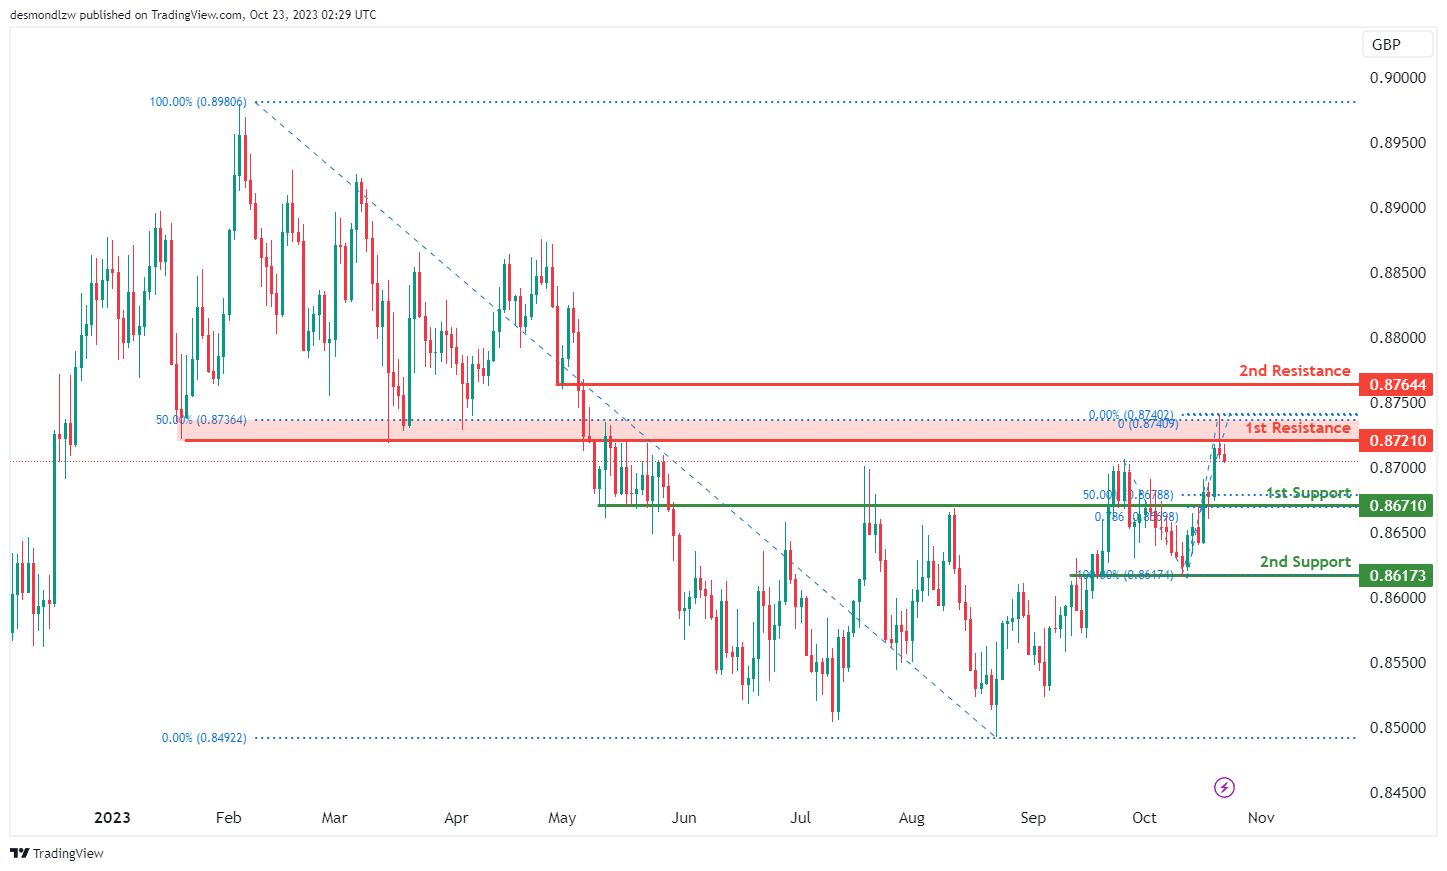
The instrument we are examining is EUR/GBP, and the overall momentum of the chart indicates a bearish trend.
There is a possibility that the price may continue in a bearish direction, potentially reaching the first support level.
The first support level is at 0.8671, and it’s considered strong because it represents a pullback support. Additionally, it aligns with a 50% Fibonacci Retracement and a 78.60% Fibonacci Projection, indicating a Fibonacci confluence.
The second support level is at 0.8617, and it’s also significant as it marks an overlap of support.
On the resistance side, the first resistance level is at 0.8721, and it’s noteworthy because it represents an overlap of resistance and aligns with a 50% Fibonacci Retracement.
The second resistance level is at 0.8764, and it’s significant as well, as it functions as a pullback resistance.
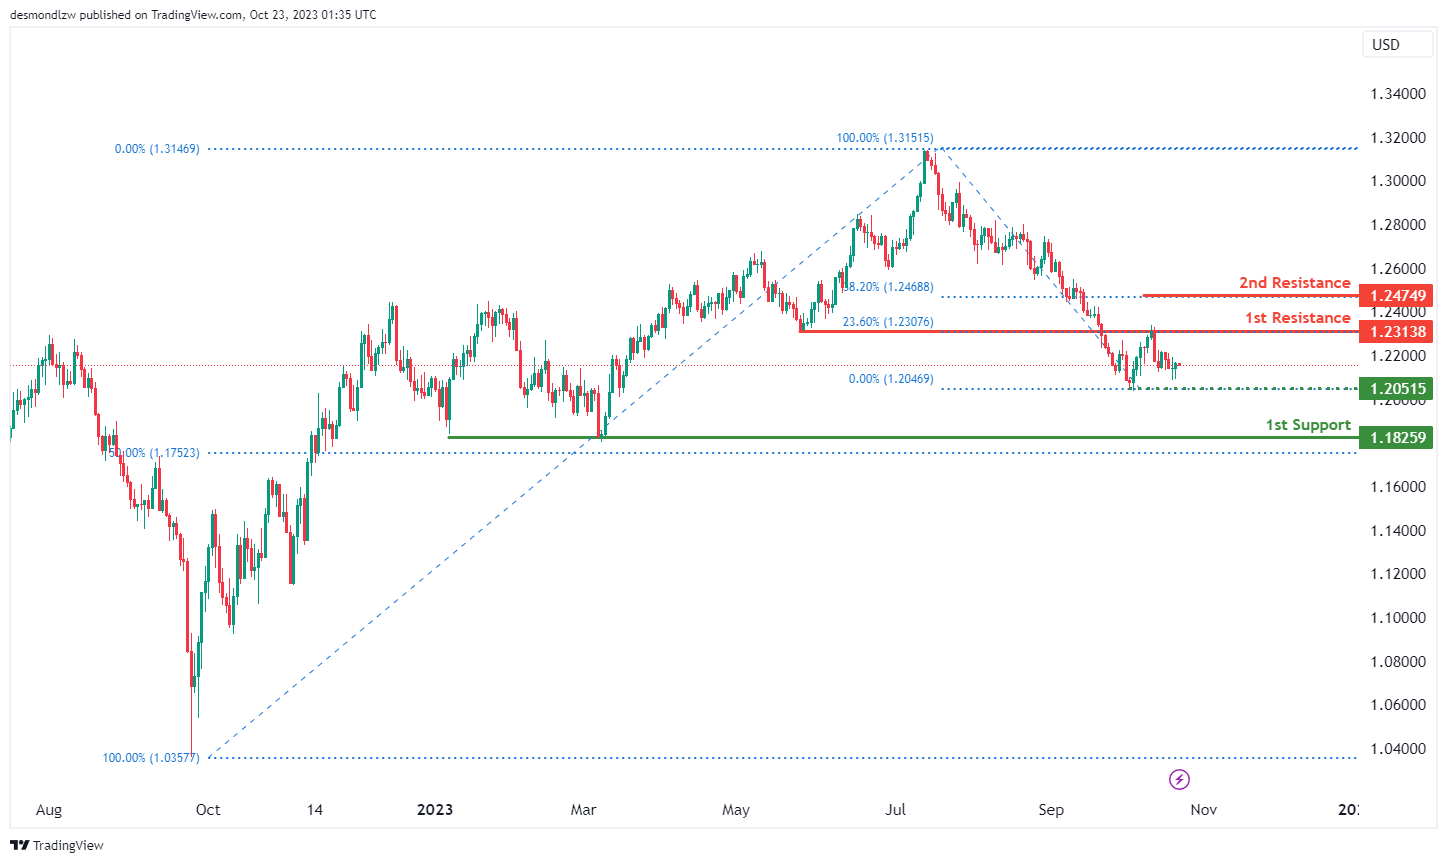
GBP/USD:
The GBP/USD chart currently exhibits a neutral momentum, suggesting a potential for price to fluctuate The GBP/USD chart currently has a bearish overall momentum. There’s a potential scenario where price could continue in a bearish direction towards the 1st support level.
The 1st support at 1.1825 is considered significant as it aligns with multi-swing low support. Additionally, there is an intermediate support at 1.2051, identified as a swing low support level.
On the resistance side, the 1st resistance at 1.2313 is characterized as an overlap resistance and coincides with the 23.60% Fibonacci Retracement level. Beyond this, the 2nd resistance at 1.2474 is identified as a resistance level at the 38.20% Fibonacci Retracement.
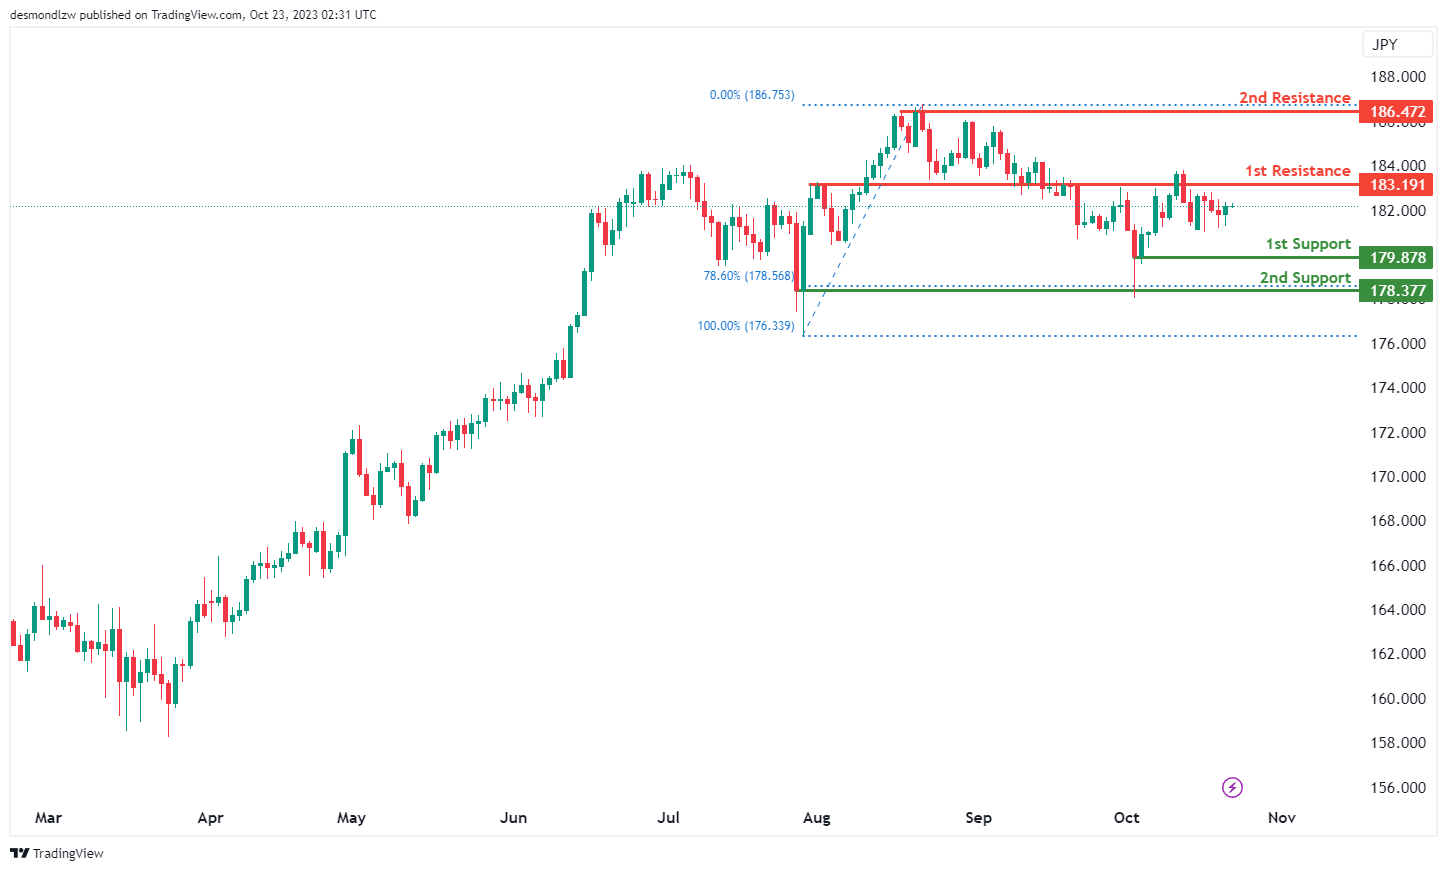
GBP/JPY:
The instrument we are analyzing is GBP/JPY, and the overall momentum of the chart is bullish. One of the factors contributing to this momentum is that the price is within the bullish Ichimoku cloud, a commonly used technical indicator in trading.
There is a possibility that the price may experience a bullish continuation, potentially reaching the first resistance level.
The first support level is at 179.87, and it’s considered strong because it represents a swing low support.
The second support level is at 178.37, and it’s also significant as it marks a multi-swing low support and aligns with a 78.60% Fibonacci Retracement.
On the resistance side, the first resistance level is at 183.19, and it’s noteworthy because it represents an overlap of resistance.
The second resistance level is at 186.47, and it’s significant as well, as it functions as a swing high resistance.
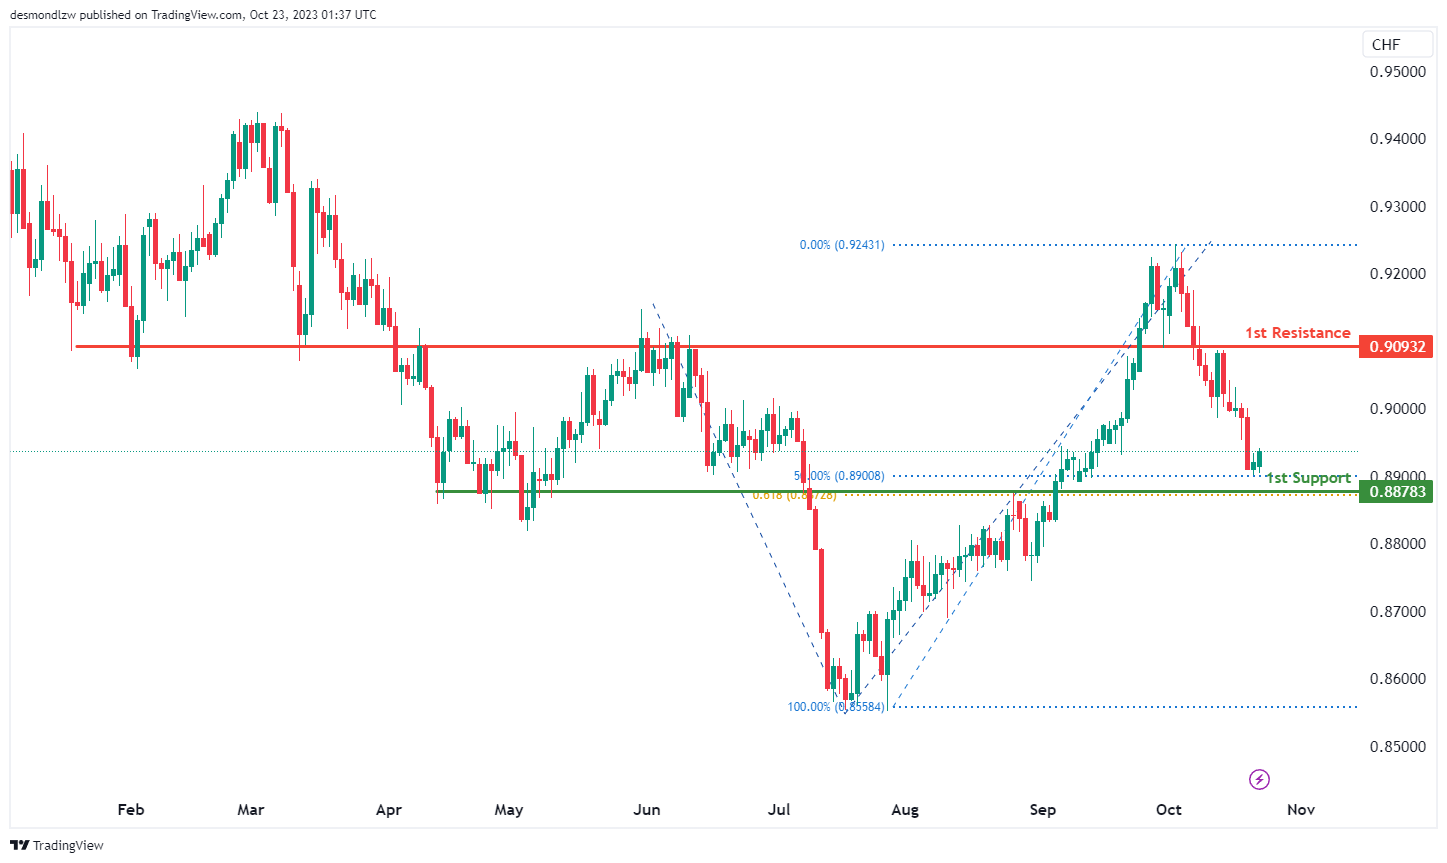
USD/CHF:
The USD/CHF chart currently exhibits a bullish overall momentum, and there is a potential scenario for a bullish bounce off the 1st support level towards the 1st resistance.
The 1st support at 0.8878 is considered significant as it aligns with an overlap support level. Notably, it also coincides with both the 50% Fibonacci Retracement and the 61.80% Fibonacci Projection, indicating a strong Fibonacci confluence at this level.
On the resistance side, the 1st resistance at 0.9093 is characterized as an overlap resistance.
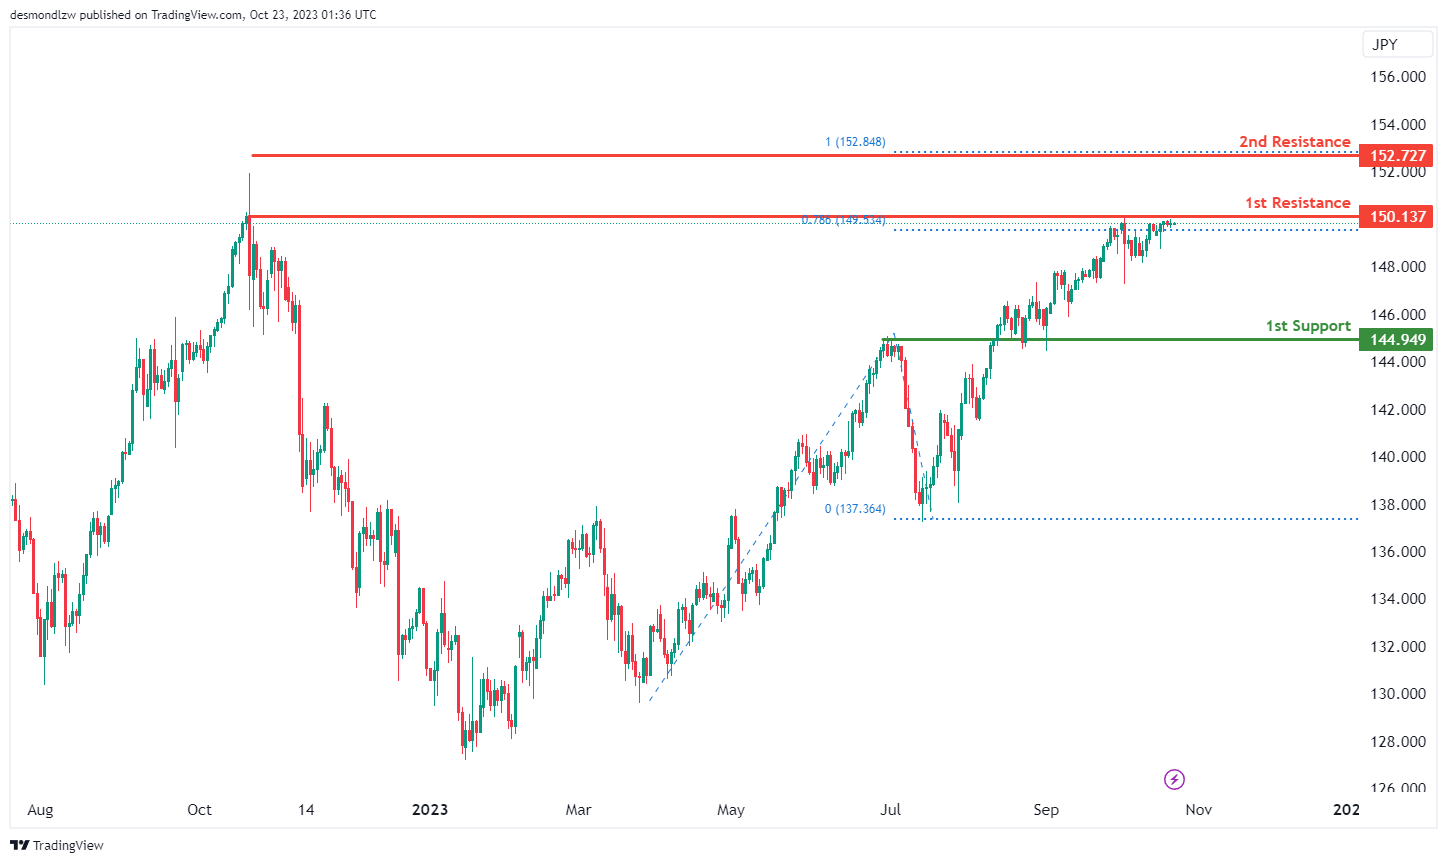
USD/JPY:
The USD/JPY chart currently exhibits a weak bearish overall momentum with low confidence, and there is a potential scenario for a bearish continuation towards the 1st support level.
The 1st support at 144.94 is considered significant as it aligns with an overlap support level.
On the resistance side, the 1st resistance at 150.13 is characterized as a multi-swing high resistance level, and beyond this, the 2nd resistance at 152.72 is identified as a swing high resistance level, coinciding with the 100% Fibonacci Projection.
USD/CAD:
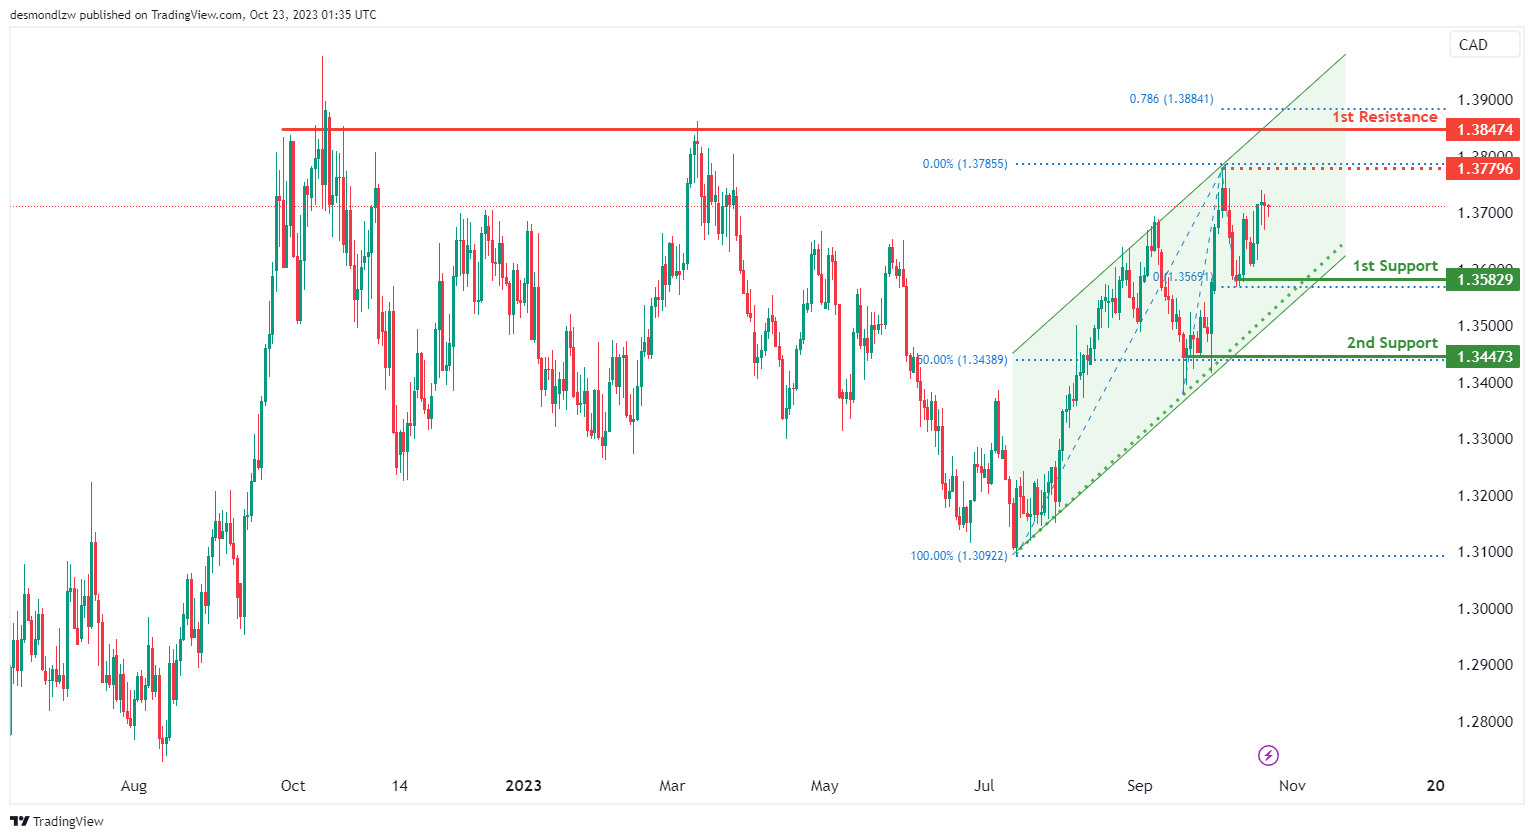
The USD/CAD chart currently exhibits a bullish momentum, suggesting a potential scenario for price to make a bullish continuation towards the 1st resistance level, especially if price breaks above the intermediate resistance level. In addition, price has also been trading within a bullish channel since mid-July to provide another bullish factor.
The intermediate resistance level at 1.3779 is identified as a swing-high resistance. Higher up, the 1st resistance level at 1.3847 is marked as a multi-swing-high resistance that aligns close to the 78.60% Fibonacci projection level, potentially acting as a barrier to further bullish advances.
To the downside, the 1st support level at 1.3583 is identified as a pullback support. Additionally, the 2nd support level at 1.3447 is also noted as a pullback support that aligns with the 50.00% Fibonacci retracement level, adding to its significance as a potential support zone.
AUD/USD:
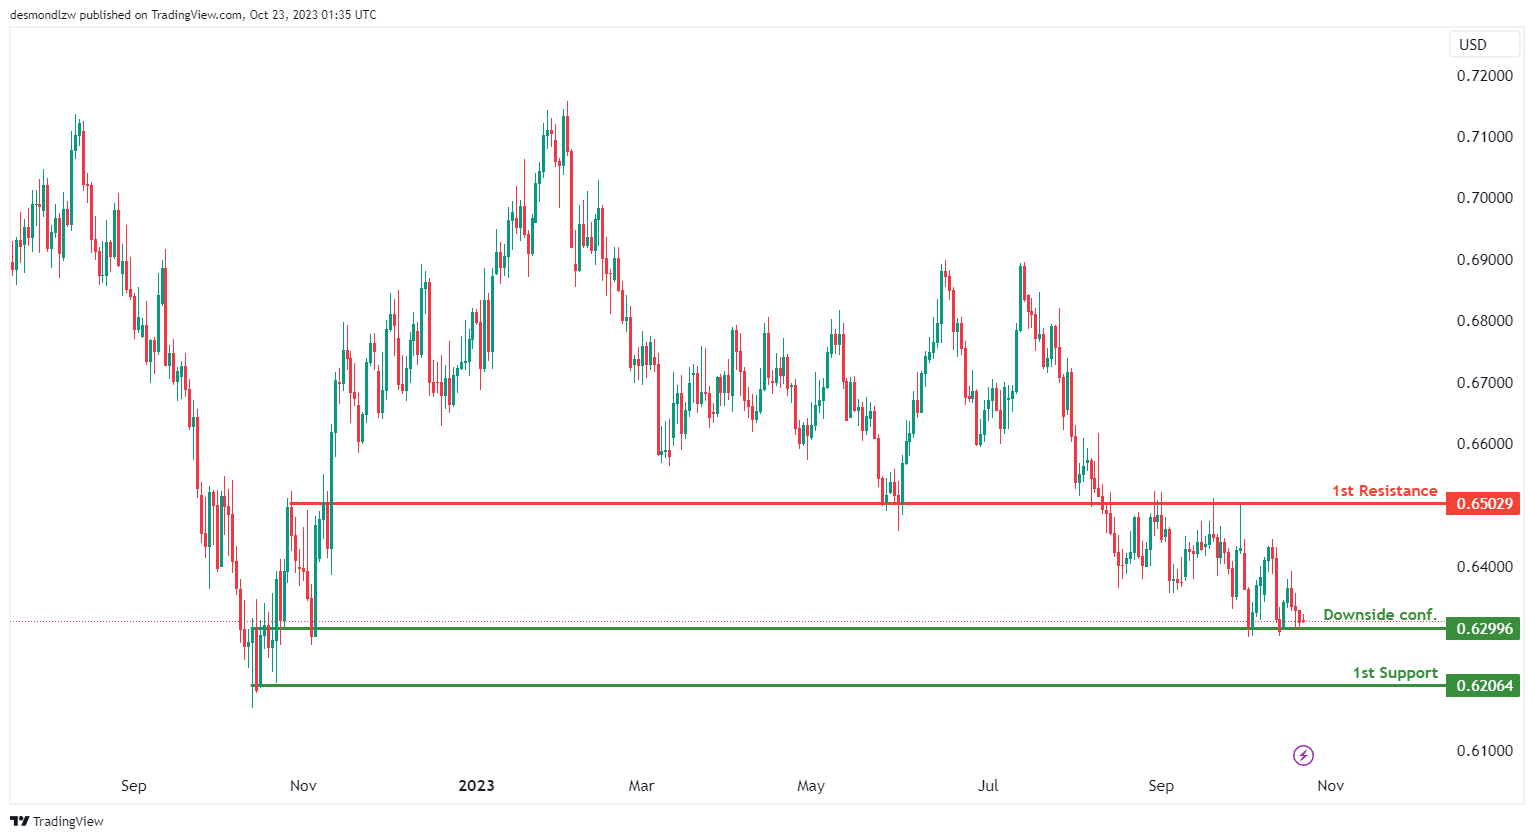
The AUD/USD chart currently exhibits an overall bearish momentum. Price could make a further bearish continuation should it break below the downside confirmation level to trigger a move towards the 1st support level.
The downside confirmation level at 0.6299 is identified as an overlap support. Further below, the 1st support level at 0.6206 is marked as a major swing-low support, further reinforcing its importance as a potential support area.
To the upside, the 1st resistance level at 0.6503 is identified as an overlap resistance, making it a potentially strong resistance level.
NZD/USD
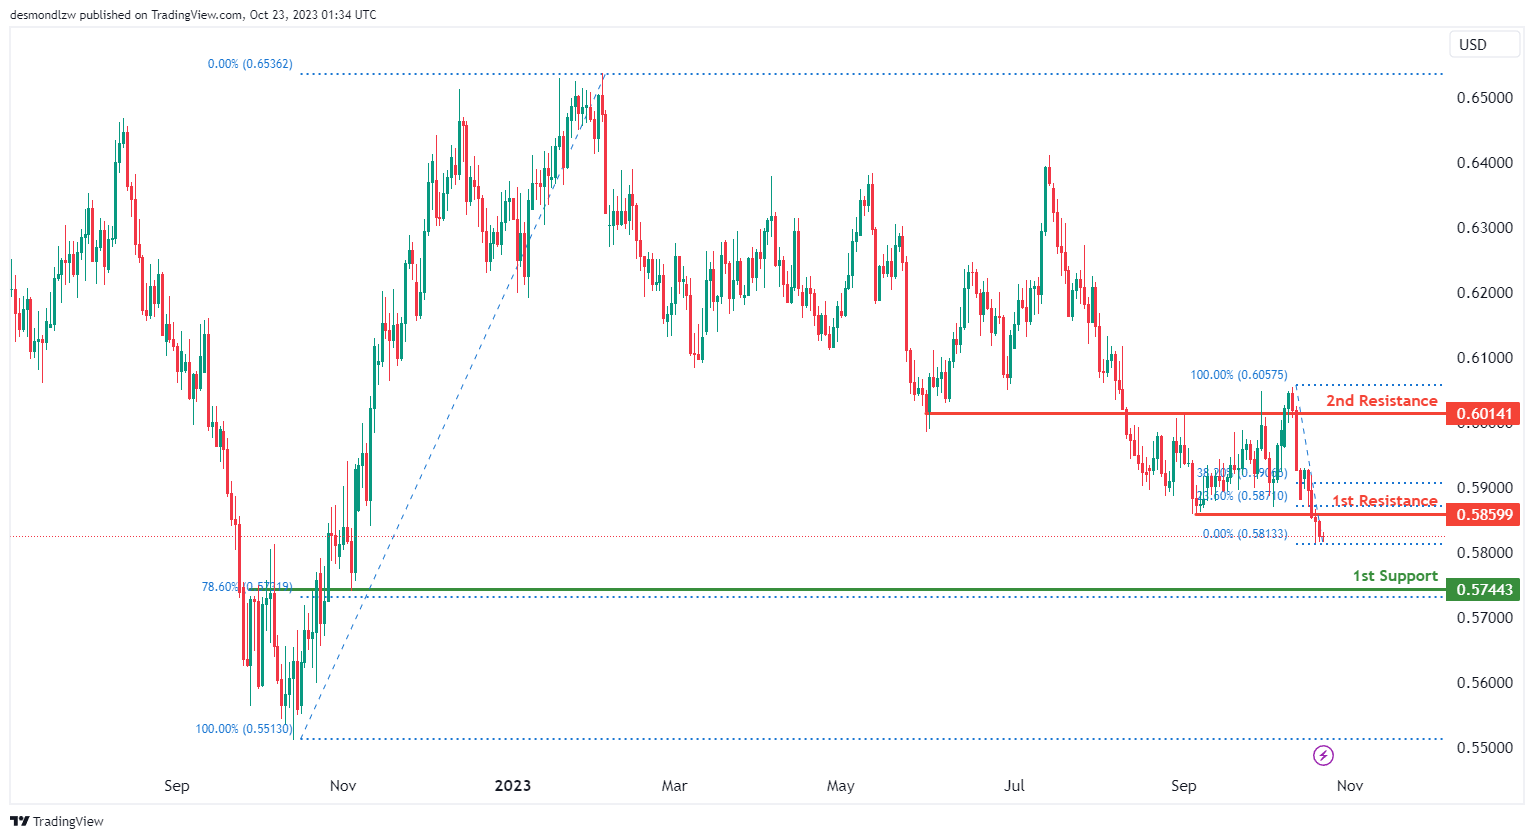
The NZD/USD chart currently exhibits a bearish momentum, suggesting a potential scenario for price to make a bearish continuation towards the 1st support level.
The 1st support level at 0.5744 is identified as an overlap support that aligns with the 78.60% Fibonacci retracement level, indicating a potential support zone.
To the upside, the 1st resistance level at 0.5859 is identified as a pullback resistance that aligns with the 23.60% Fibonacci retracement level. Beyond this, the 2nd resistance level at 0.6014 is marked as an overlap resistance, making it a potentially strong resistance level.
DJ30:
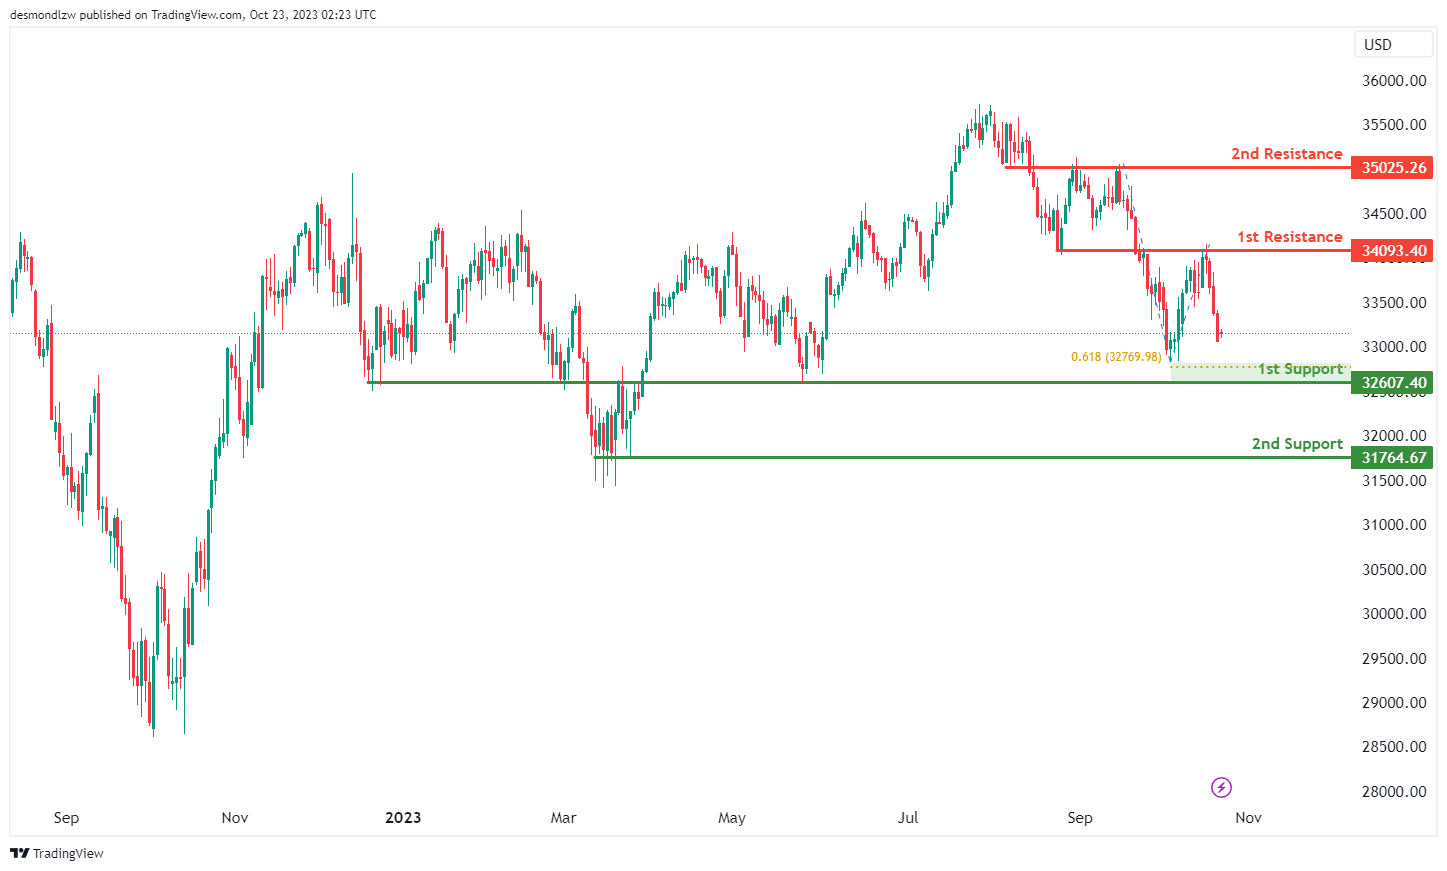
The instrument we are analyzing is DJ30, and the overall momentum of the chart indicates a bearish trend.
There is a possibility that the price may continue in a bearish direction, potentially reaching the first support level.
The first support level is at 32,607.40, and it’s considered strong because it represents an overlap of support and aligns with a 61.80% Fibonacci Projection.
The second support level is at 31,764.67, and it’s also significant as it marks a multi-swing low support.
On the resistance side, the first resistance level is at 34,093.40, and it’s noteworthy because it represents an overlap of resistance.
The second resistance level is at 35,025.26, and it’s significant as well, as it functions as an overlap resistance.
GER40:
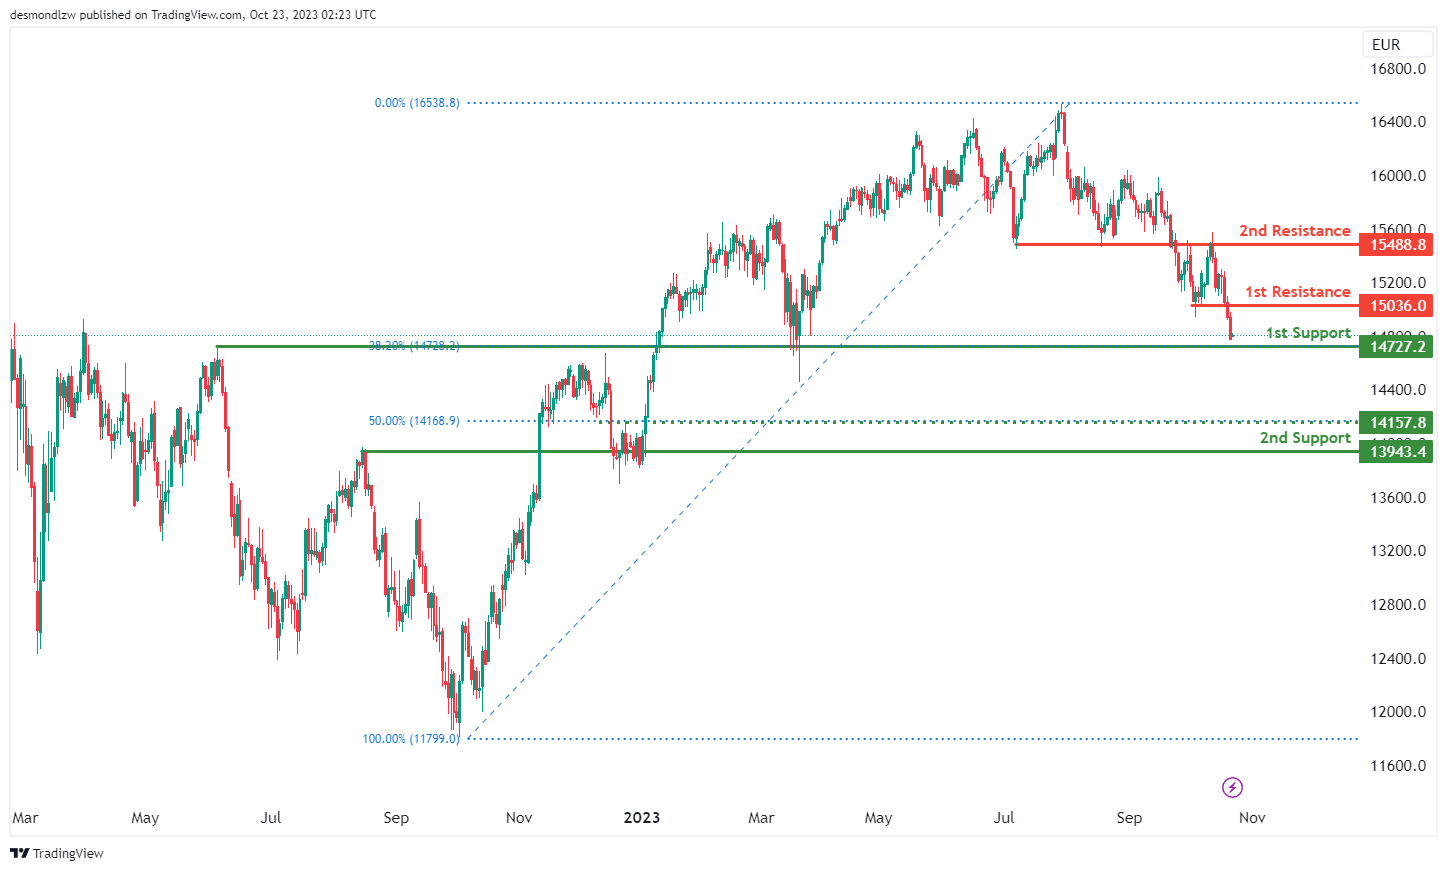
The instrument we are examining is GER40, and the overall momentum of the chart indicates a bearish trend.
There is a possibility that the price may continue in a bearish direction, potentially reaching the first support level.
The first support level is at 14,727.20, and it’s considered strong because it represents an overlap of support and aligns with a 38.20% Fibonacci Retracement.
The second support level is at 13,943.40, and it’s also significant as it marks another overlap of support.
On the resistance side, the first resistance level is at 15,036.00, and it’s noteworthy because it represents a pullback resistance.
The second resistance level is at 15,488.80, and it’s significant as well, as it functions as an overlap resistance.
Additionally, there is an intermediate support level at 14,157.80, and it’s considered significant because it represents a pullback support and aligns with a 50% Fibonacci Retracement.
US500
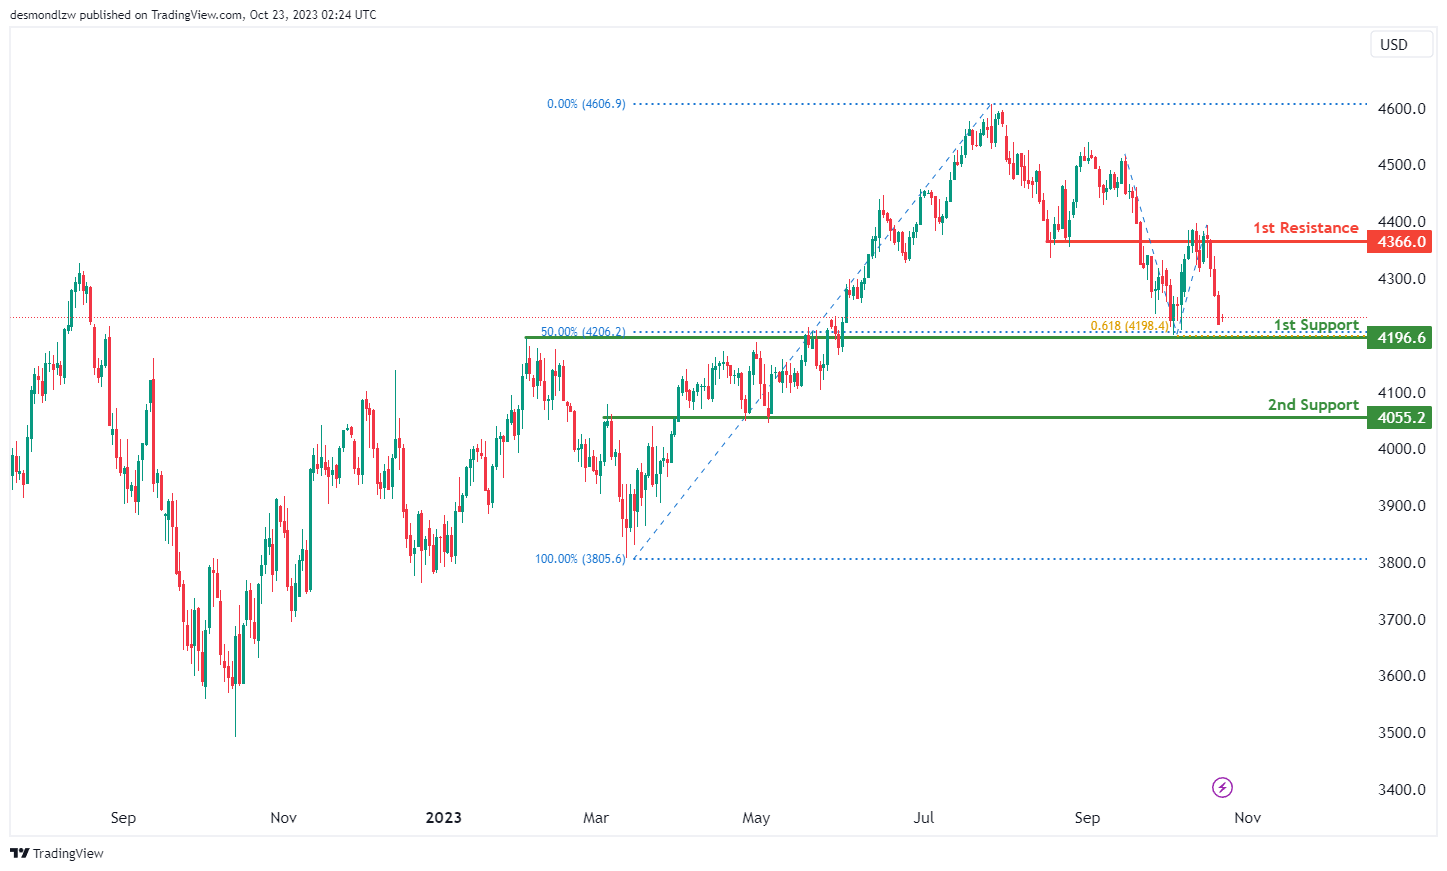
The instrument under analysis is US500, and the overall momentum of the chart indicates a bearish trend.
There is a possibility that the price may continue in a bearish direction, potentially reaching the first support level.
The first support level is at 4,196.6, and it’s considered strong because it represents an overlap of support and aligns with a 50% Fibonacci Retracement and a 61.80% Fibonacci Projection, indicating a Fibonacci confluence.
The second support level is at 4,055.2, and it’s also significant as it marks another overlap of support.
On the resistance side, the first resistance level is at 4,366.0, and it’s noteworthy because it represents an overlap of resistance.
BTC/USD:
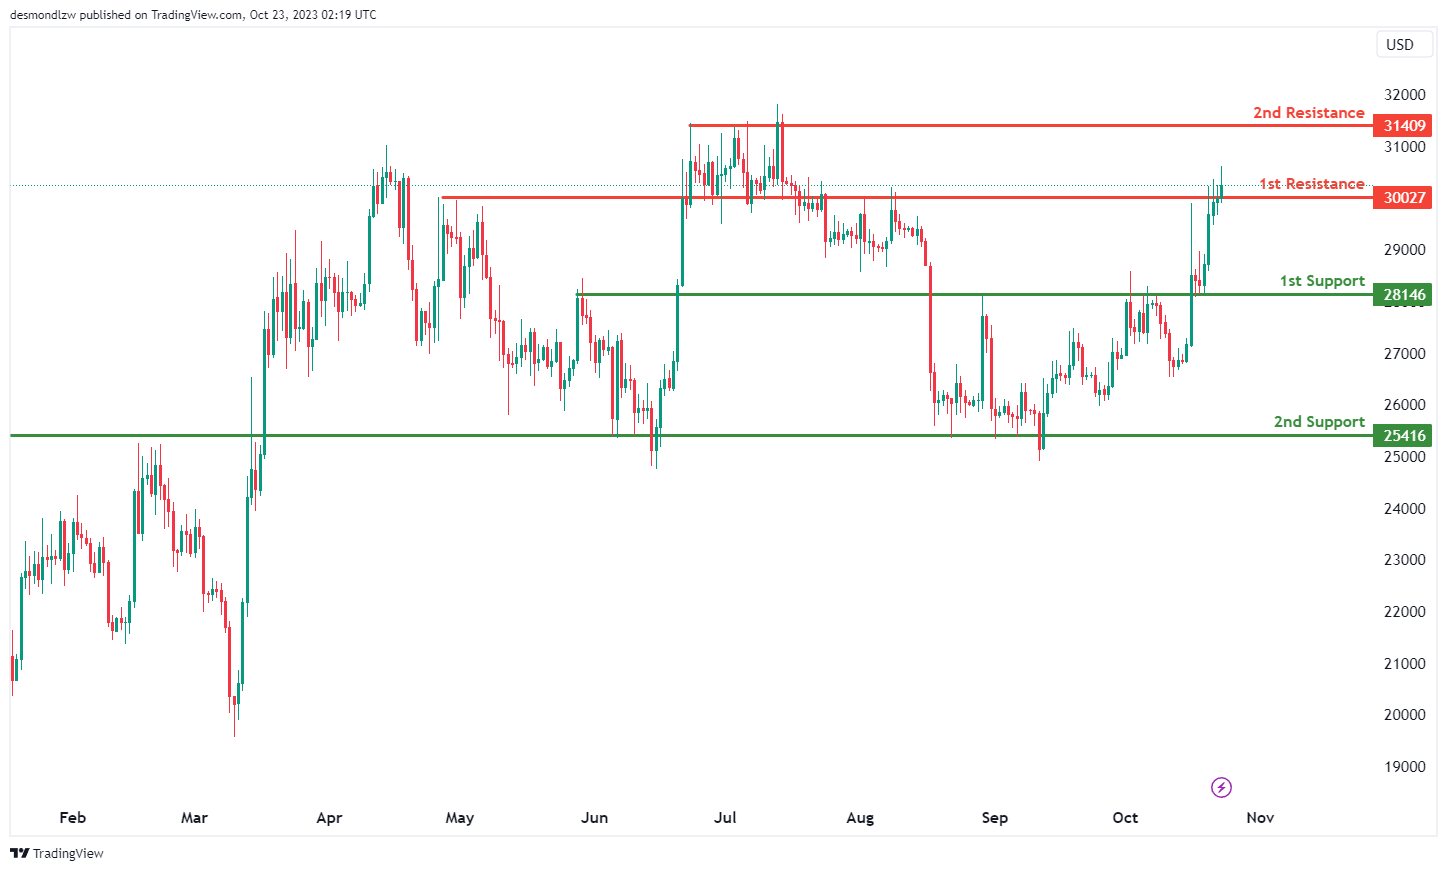
The instrument we are examining is BTC/USD, and the overall momentum of the chart indicates a bullish trend.
There is a possibility that the price may experience a bullish break through the first resistance level and then rise to the second resistance level.
The first support level is at 28,146, and it’s considered strong because it represents a pullback support.
The second support level is at 25,416, and it’s also significant as it marks an overlap of support.
On the resistance side, the first resistance level is at 30,027, and it’s noteworthy because it represents an overlap of resistance.
The second resistance level is at 31,409, and it’s significant as well, as it functions as a multi-swing high resistance.
ETH/USD:
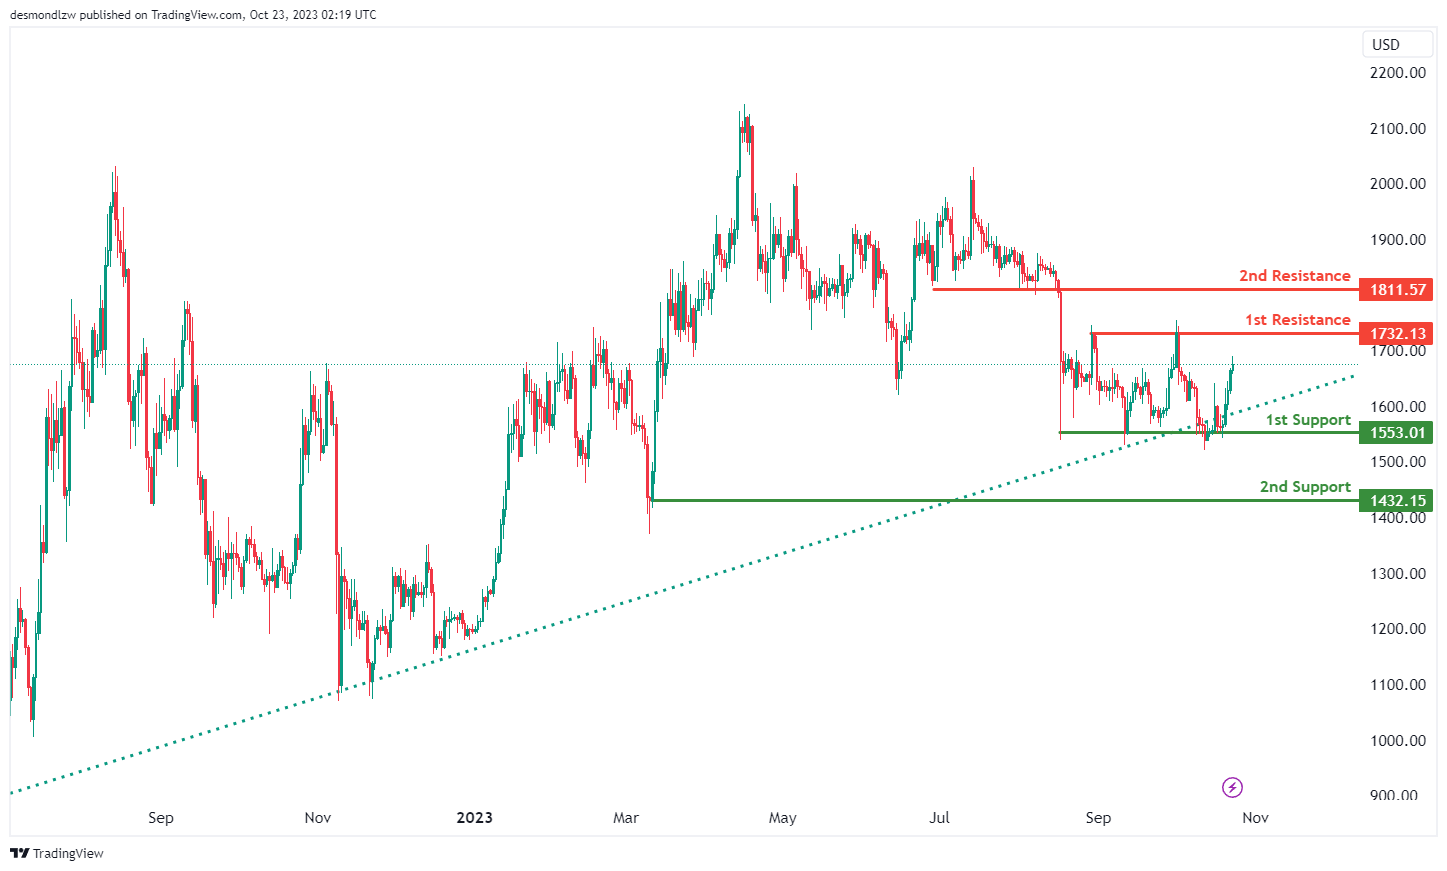
The instrument we are analyzing is ETH/USD, and the overall momentum of the chart is bullish. This momentum is attributed to the fact that the price is above a major ascending trend line, suggesting that further bullish momentum is likely.
There is a possibility that the price may experience a bullish break through the first resistance level and then rise to the second resistance level.
The first support level is at 1,553.01, and it’s considered strong because it represents a multi-swing low support.
The second support level is at 1,432.15, and it’s also significant as it marks a swing low support.
On the resistance side, the first resistance level is at 1,732.13, and it’s noteworthy because it represents a multi-swing high resistance.
The second resistance level is at 1,811.57, and it’s significant as well, as it functions as a pullback resistance.
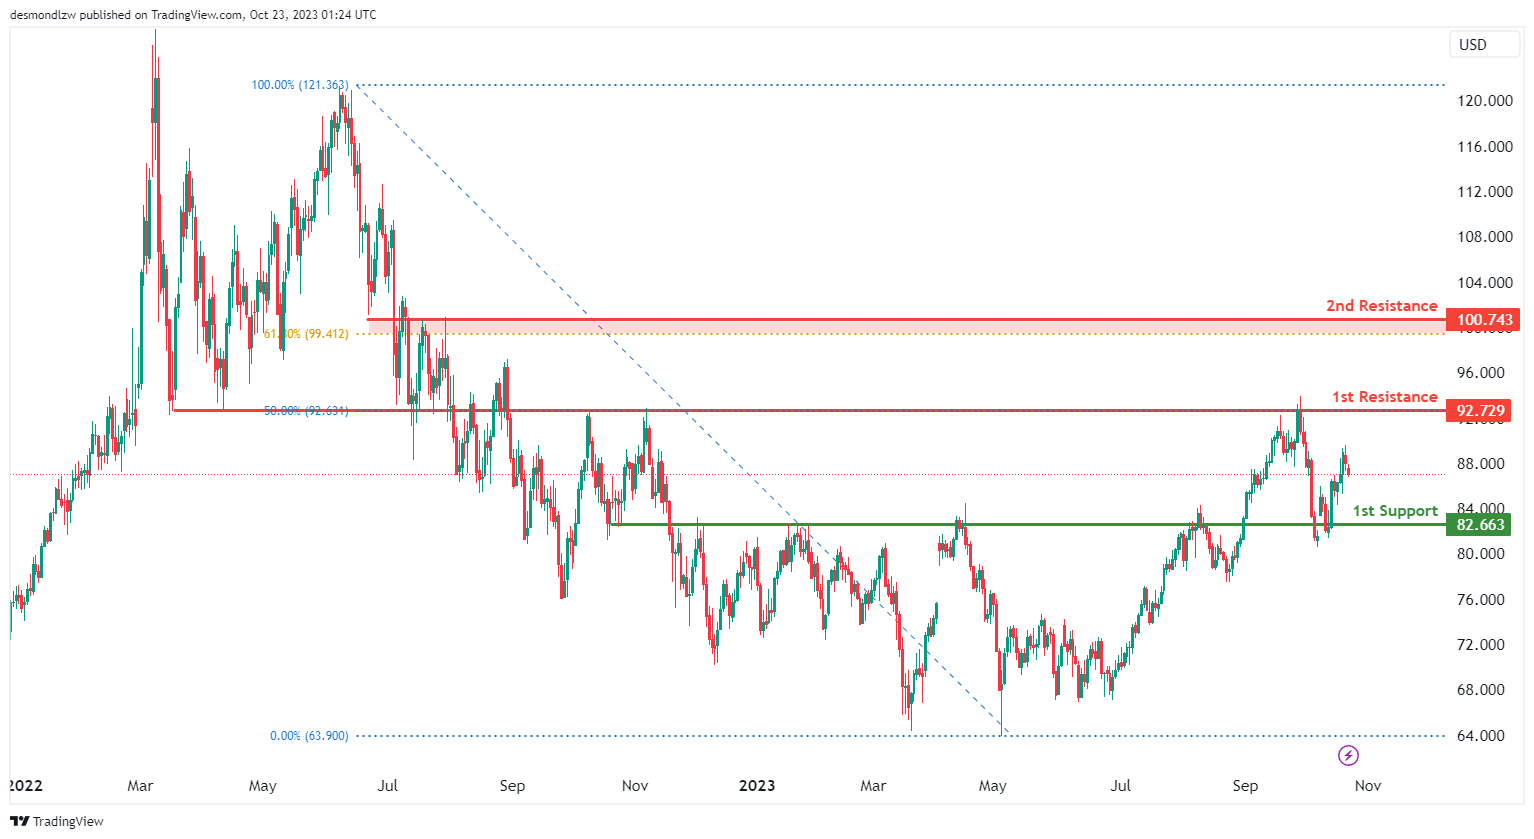
WTI/USD:
The WTI chart currently shows a bearish momentum, indicating a potential scenario for price to make a bearish continuation towards the 1st support level.
The 1st support level at 82.66 is identified as a major overlap support level, indicating a potential support zone.
To the upside, the 1st resistance level at 92.73 is identified as an overlap resistance that aligns with the 50.00% Fibonacci retracement level. Beyond this, the 2nd resistance level at 100.74 is also marked as an overlap resistance, making it a potentially strong resistance level.
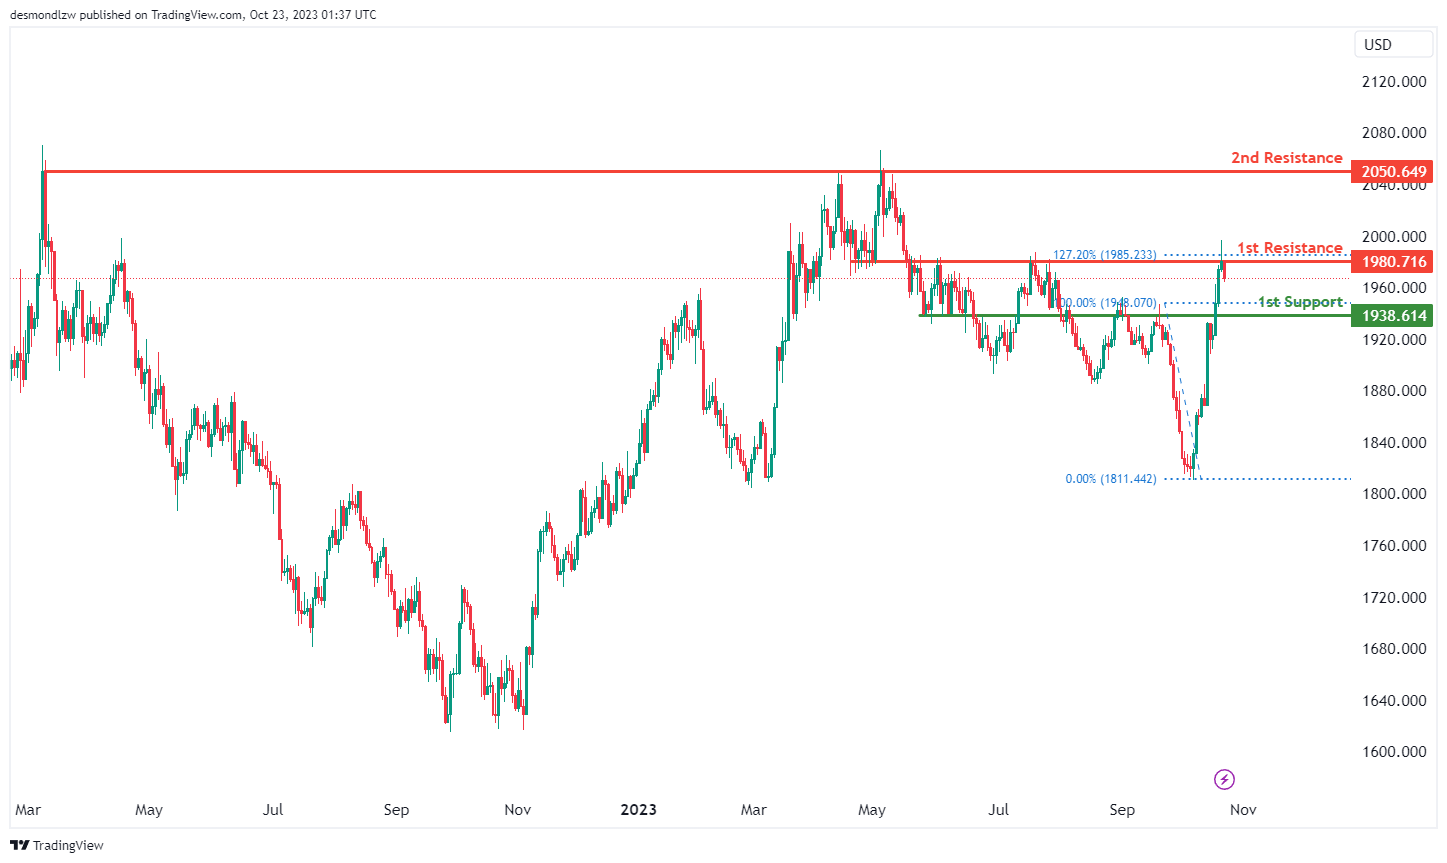
XAU/USD (GOLD):
The XAU/USD chart currently shows a bearish overall momentum, and there is a potential scenario for a bearish continuation towards the 1st support level.
The 1st support at 1938.61 is considered significant as it aligns with a pullback support level.
On the resistance side, the 1st resistance at 1980.00 is characterized as an overlap resistance level, and beyond this, the 2nd resistance at 2050.64 is identified as a multi-swing high resistance level.


