
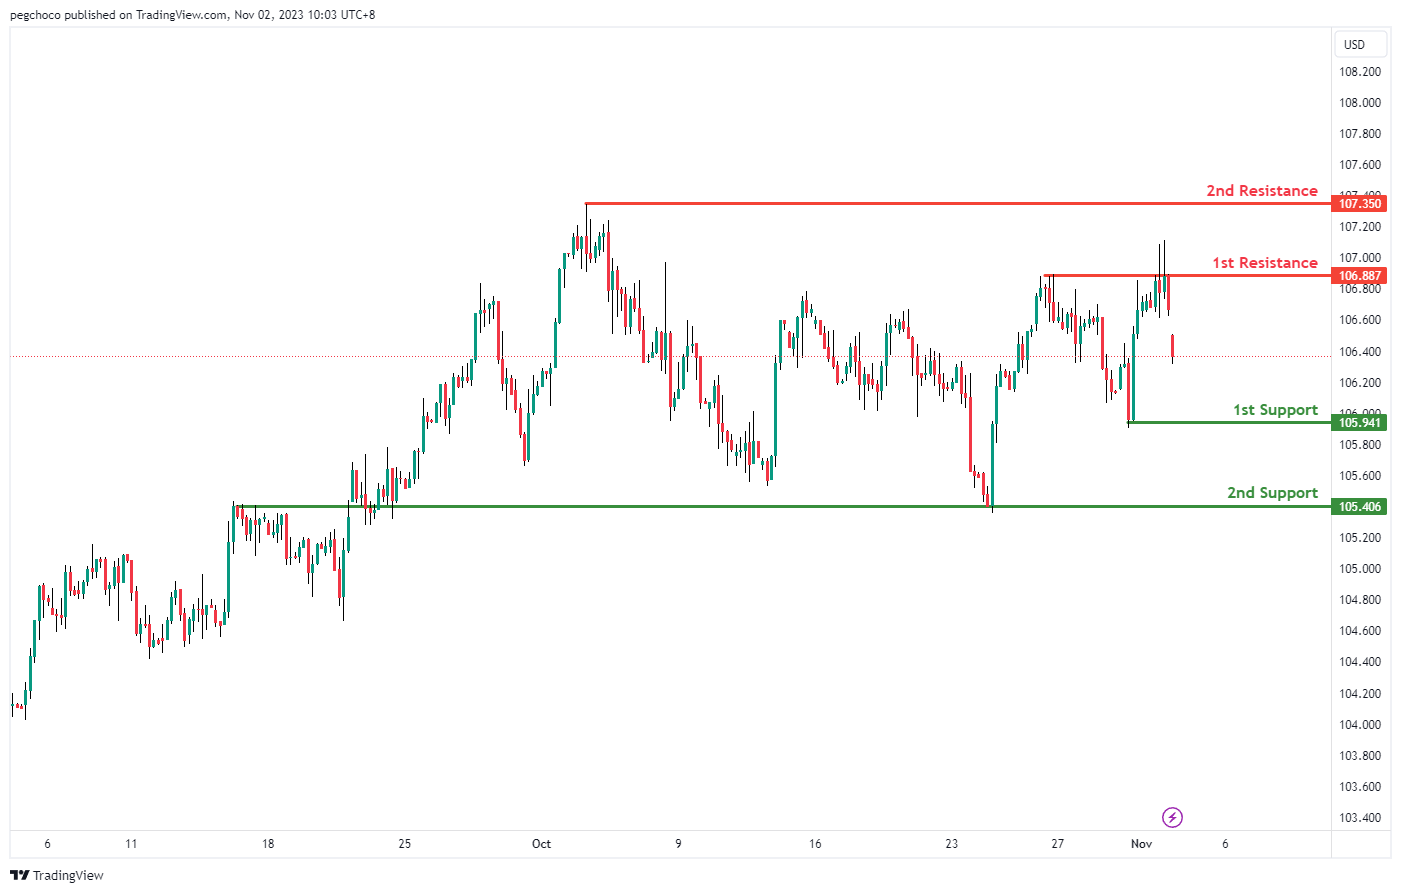
DXY:
The XAU/USD (Gold/US Dollar) chart currently exhibits a bearish overall momentum. However, there’s a potential short-term bullish scenario in which the price could bounce off the 1st support at 1977.14, which is identified as an overlap support. This bounce may lead the price towards the 1st resistance at 1992.30, characterized as a pullback resistance.
After reaching the 1st resistance, there’s a possibility of a reversal to the downside, seeking support. The 2nd support at 1953.53 is also considered significant, as it aligns with an overlap support, reinforcing its potential as a support level. The 2nd resistance at 2007.97 is another significant level, noted as an overlap resistance, where the price may face resistance.
EUR/USD:
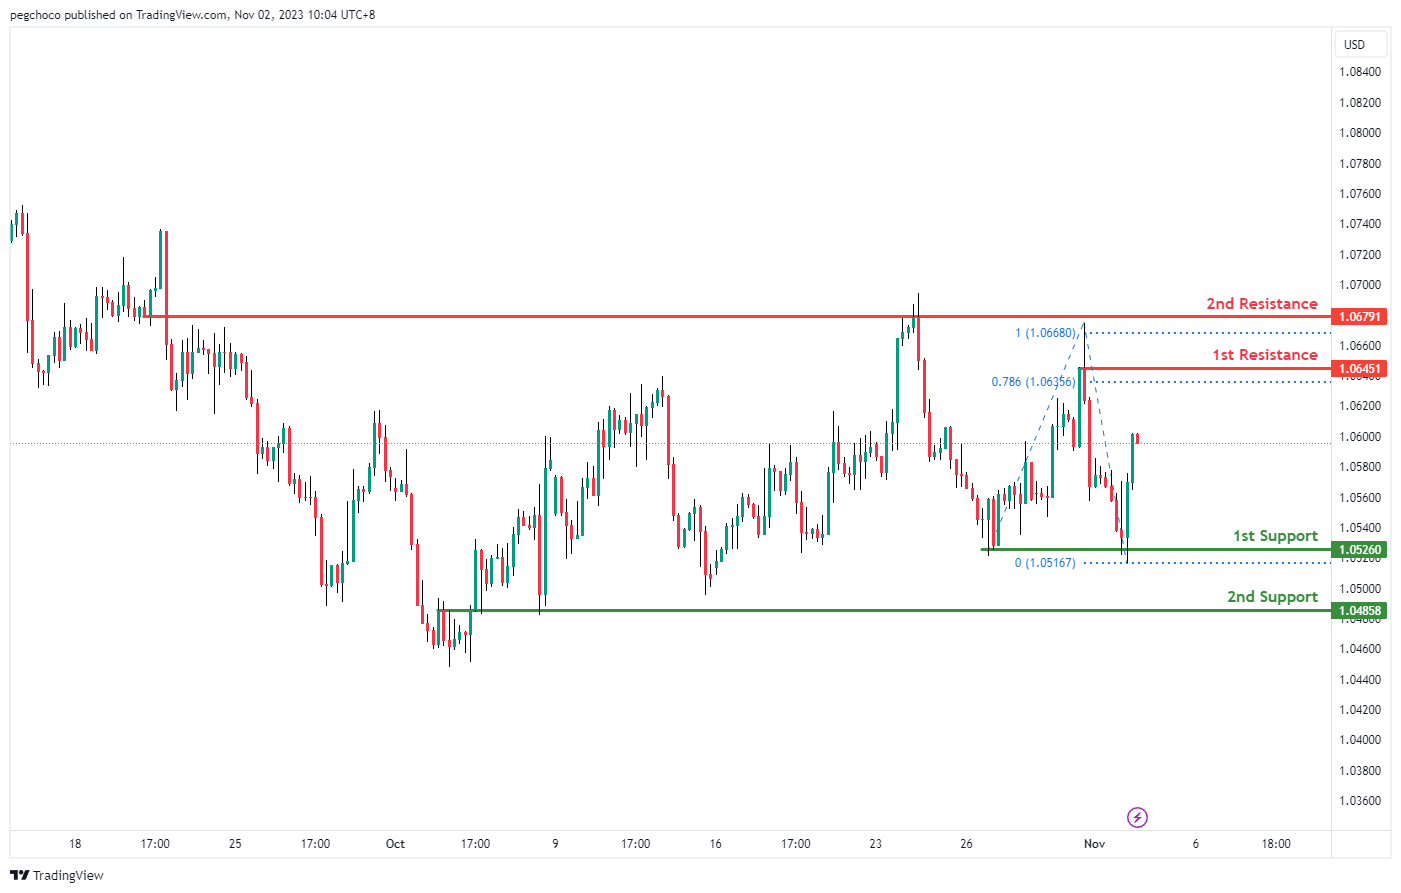
The EUR/USD chart currently demonstrates a bullish overall momentum, suggesting the potential for a bullish continuation towards the 1st resistance.
1st support at 1.0526 is considered significant as it aligns with a swing low support level, indicating its potential to act as strong support. Additionally, the 2nd support at 1.0485 is identified as an overlap support, reinforcing the potential support zone.
On the resistance side, the 1st resistance at 1.0645 is characterized as a swing high resistance, implying that it could pose a significant obstacle to any notable upward price movement in the bullish direction. Furthermore, the 2nd resistance at 1.0679 is identified as a swing high resistance and is marked by a 100% Fibonacci Projection, indicating another potential level where the price may face resistance.
EUR/JPY:
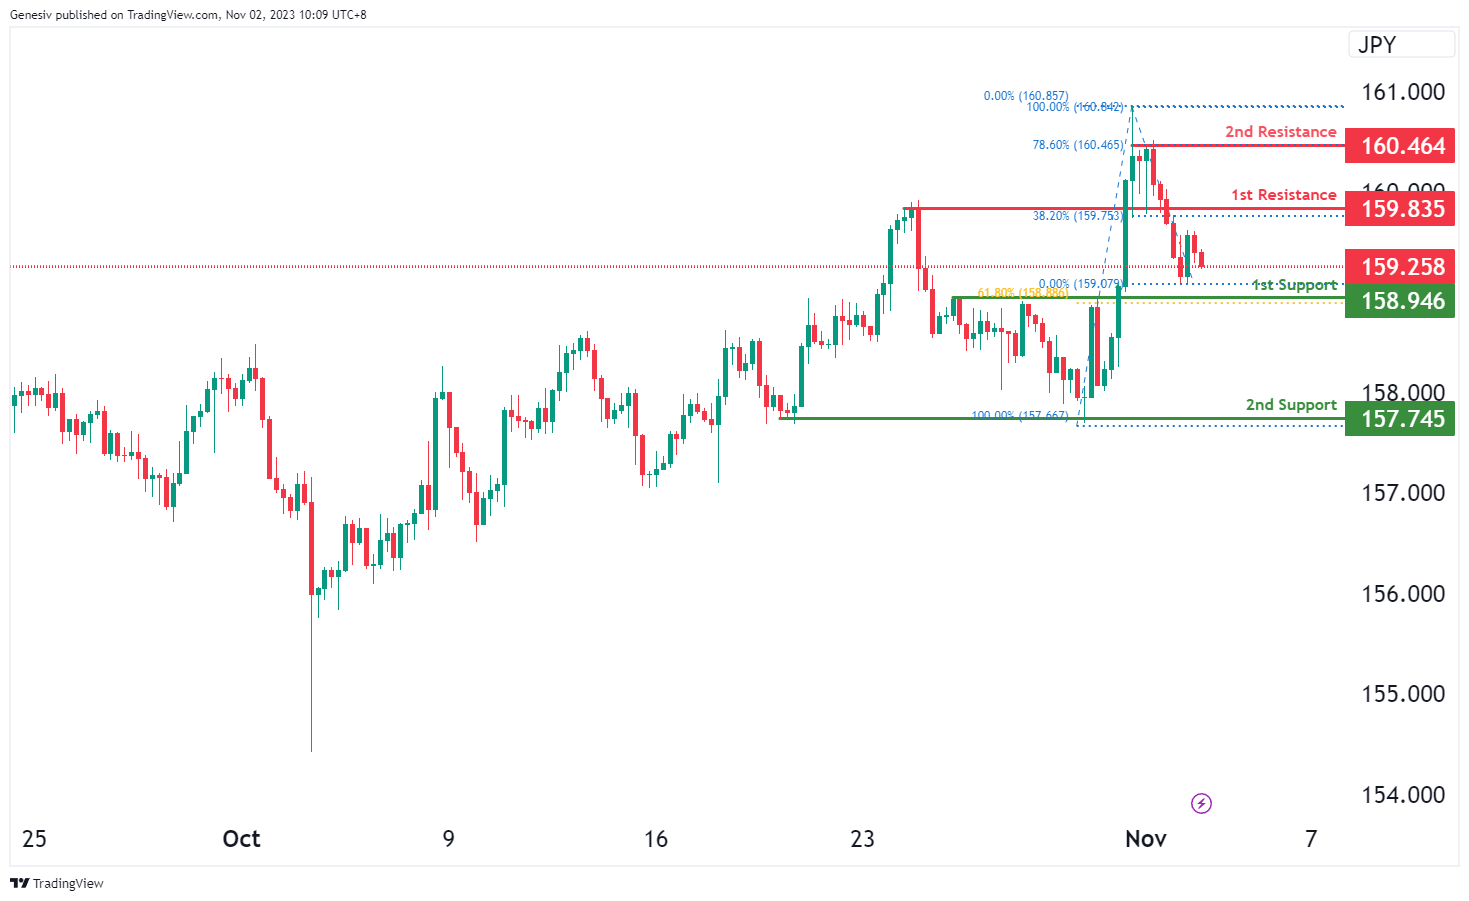
The EUR/JPY chart currently shows a bearish momentum, suggesting a potential scenario for a bearish continuation towards the first support at 158.94. The first support level at 158.94 is identified as a pullback support, coinciding with the 61.80% Fibonacci Retracement level, indicating a significant potential support level for the price decline.
The second support at 157.74 aligns with multi-swing low support, serving as an additional level that could potentially provide support in the bearish direction.
Regarding resistance levels, the first resistance at 159.83 represents pullback resistance and coincides with the 38.20% Fibonacci Retracement. The second resistance at 160.46 is associated with swing high resistance, corresponding to the 78.60% Fibonacci Retracement level, potentially acting as a substantial barrier to the price’s upward movement within the current bearish trend.
EUR/GBP:
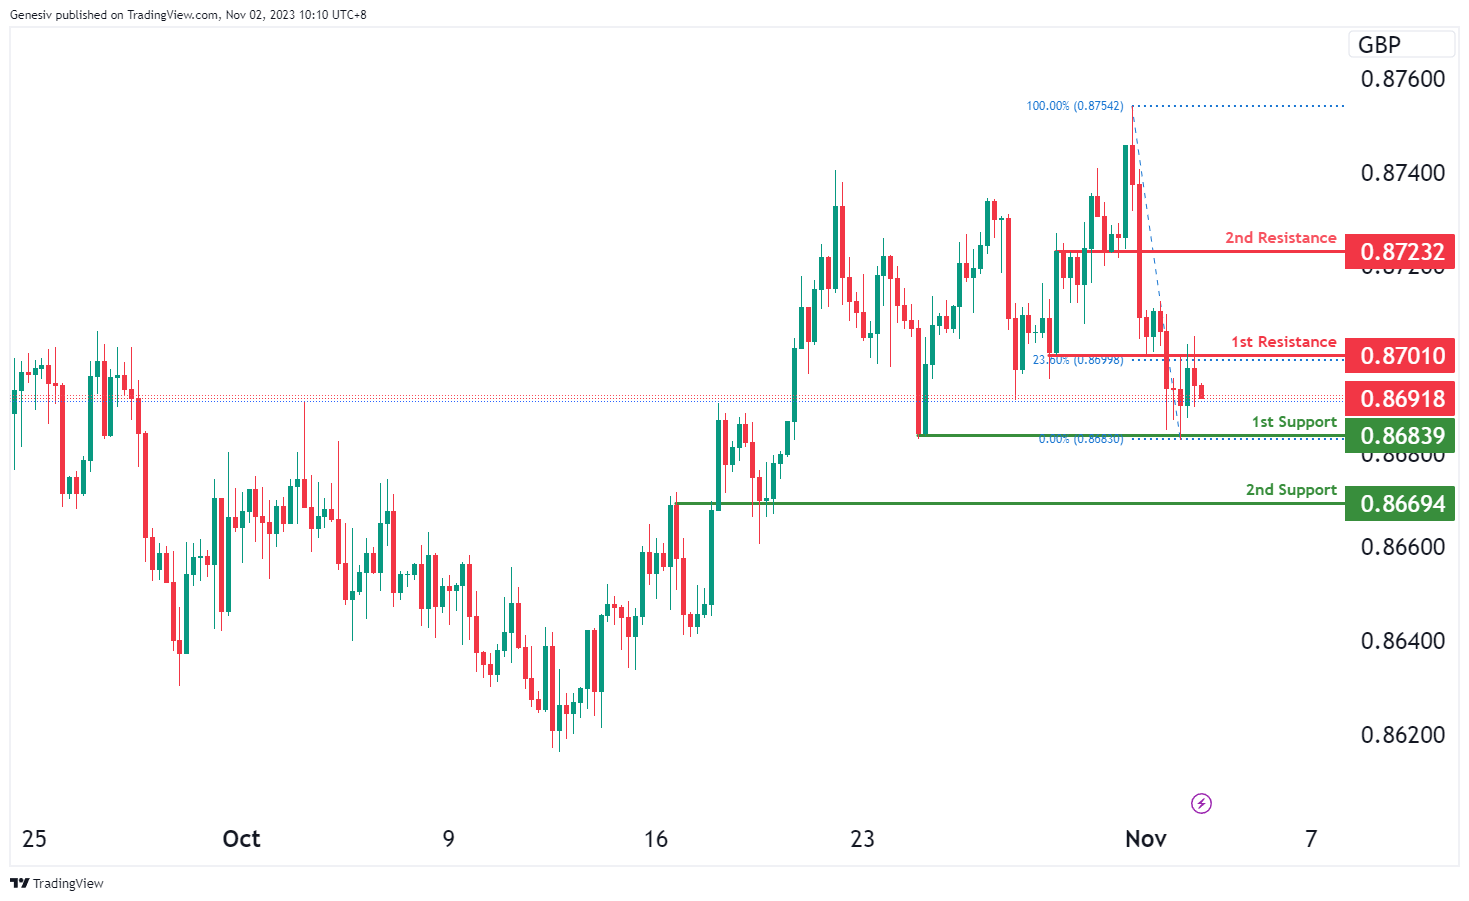
The EUR/GBP chart currently displays a bearish momentum, indicating a potential scenario for a bearish continuation towards the first support at 0.8683. This level is regarded as a multi-swing low support, suggesting it could serve as a significant level of potential support for the declining price movement.
The second support at 0.8669 is identified as an overlap support, providing an additional level of potential support during the bearish trend.
On the resistance side, the first resistance at 0.8701 represents an overlap resistance, coinciding with the 23.60% Fibonacci Retracement level, potentially acting as a significant barrier to the price’s downward movement. The second resistance at 0.8723 is characterized as pullback resistance, indicating another level that could impede the price from moving upward within the current bearish trend.
GBP/USD:
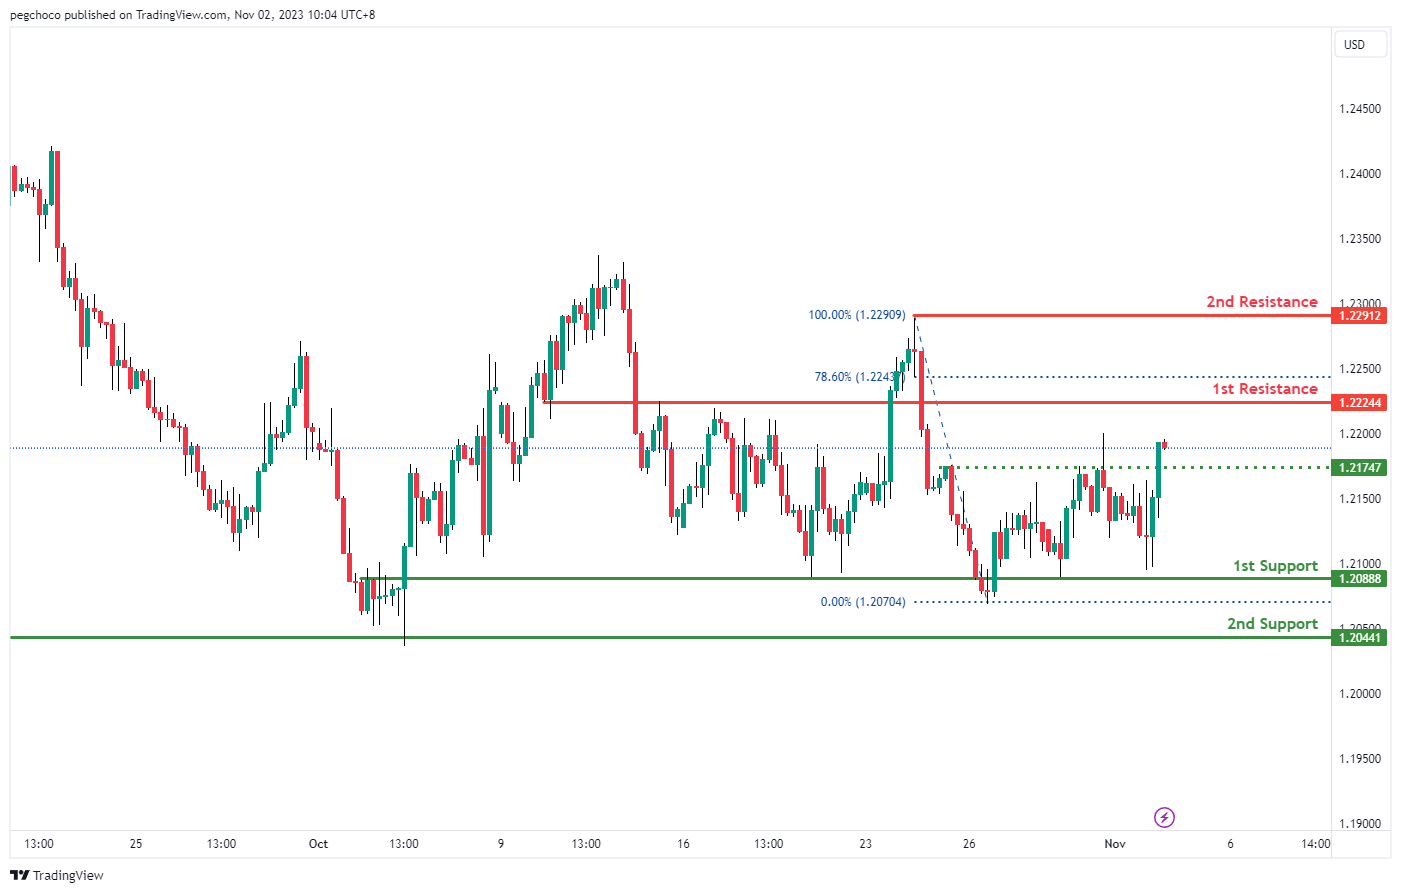
The GBP/USD chart currently exhibits a bullish overall momentum, suggesting the potential for a bullish continuation towards the 1st resistance.
1st support at 1.2088 is identified as an overlap support level, indicating its significance as potential support for the price. Additionally, the 2nd support at 1.2044 is also considered an overlap support, reinforcing the potential support zone.
On the resistance side, the 1st resistance at 1.2224 is categorized as a pullback resistance, which suggests it could act as a significant level of resistance for any further upward price movement. Furthermore, the 2nd resistance at 1.2291 is identified as a swing high resistance, indicating another potential resistance level where the price may face obstacles.
An intermediate support level at 1.2174 is noted, signifying a pullback support, which could provide additional support for the price in the bullish direction.
GBP/JPY:
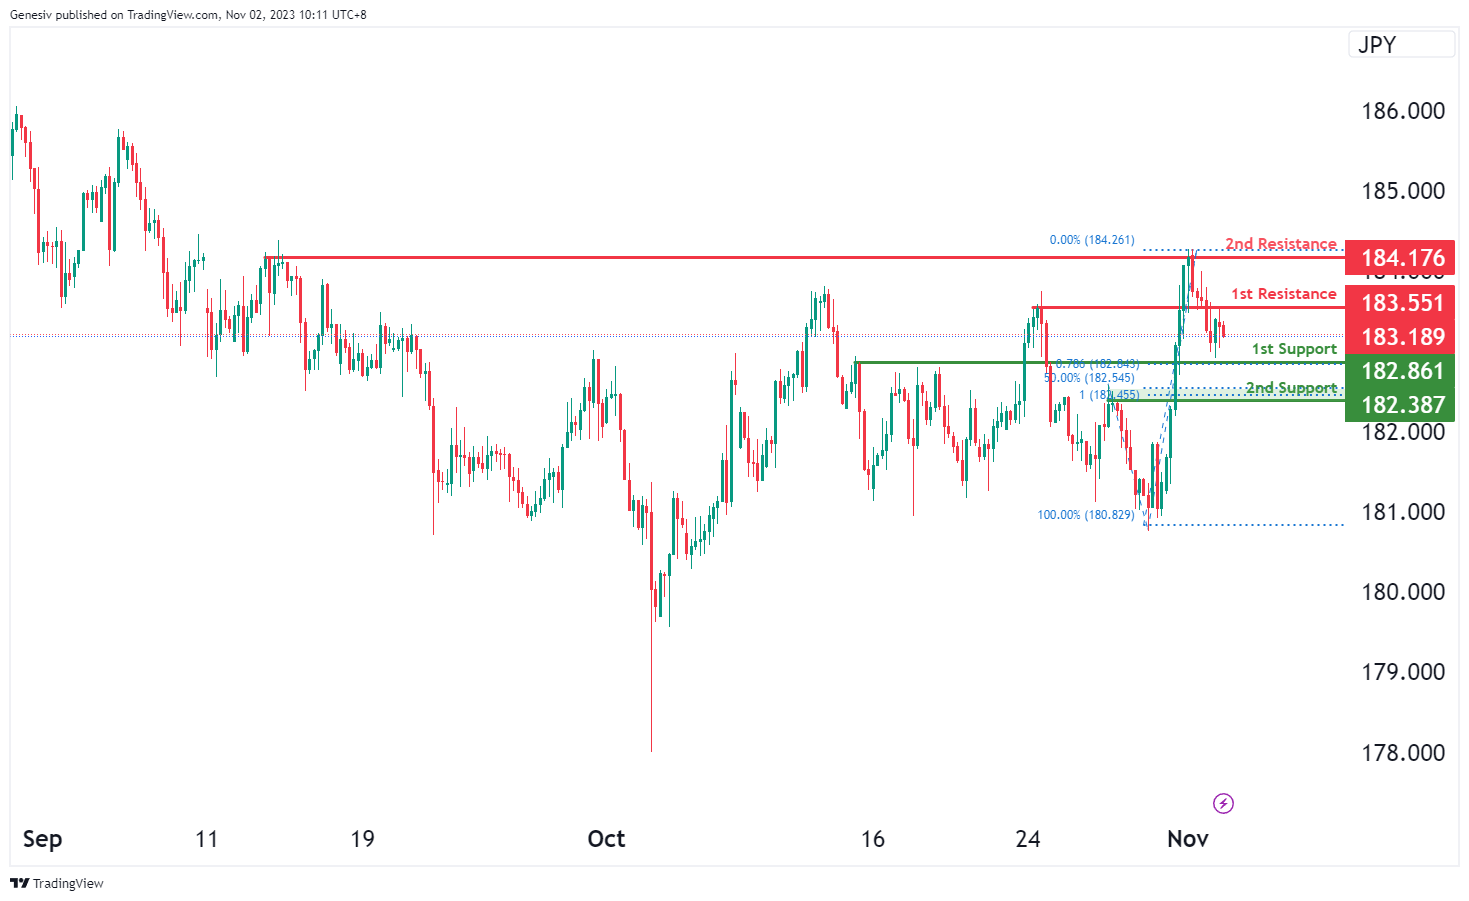
The GBP/JPY chart currently demonstrates a bearish momentum, suggesting a potential scenario for a bearish continuation towards the first support at 182.86. This level is identified as pullback support and holds significance due to the 50% Fibonacci Retracement and the 78.60% Fibonacci Projection, indicating a confluence of Fibonacci levels, which could potentially act as a strong support area for the price decline.
The second support at 182.38 is also categorized as pullback support and is highlighted by the 100% Fibonacci Projection, signifying another critical level that could potentially provide support within the bearish trend.
Regarding resistance levels, the first resistance at 183.55 is characterized as an overlap resistance, potentially serving as a barrier to the price’s upward movement in the bearish scenario. The second resistance at 184.17 aligns with multi-swing high resistance, indicating another substantial level that could hinder the price from rising within the current bearish trend.
USD/CHF:
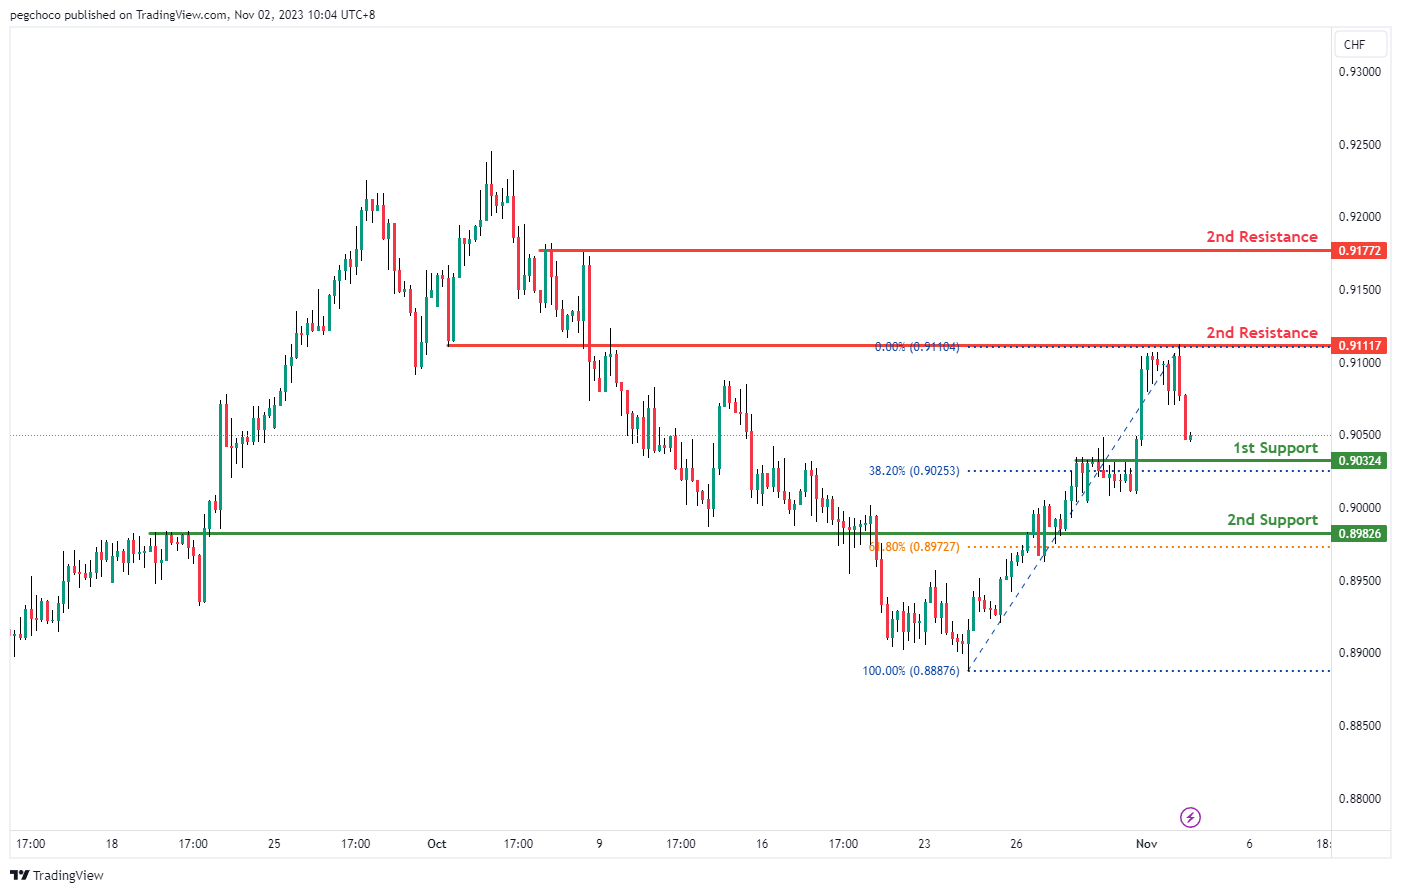
The USD/CHF chart currently has a bearish overall momentum, suggesting the potential for a bearish continuation towards the 1st support level.
1st support at 0.9032 is identified as a pullback support, and it coincides with the 38.20% Fibonacci Retracement level. This convergence of technical factors makes it a significant potential support level.
The 2nd support at 0.8982 is considered an overlap support and coincides with the 61.80% Fibonacci Retracement level. This level also adds to the potential support zone.
On the resistance side, the 1st resistance at 0.9111 is identified as an overlap resistance, suggesting it could act as a significant level of resistance for any upward price movement.
The 2nd resistance at 0.9177 is categorized as a multi-swing high resistance, indicating another potential level where the price may face obstacles in its upward movement.
USD/JPY:
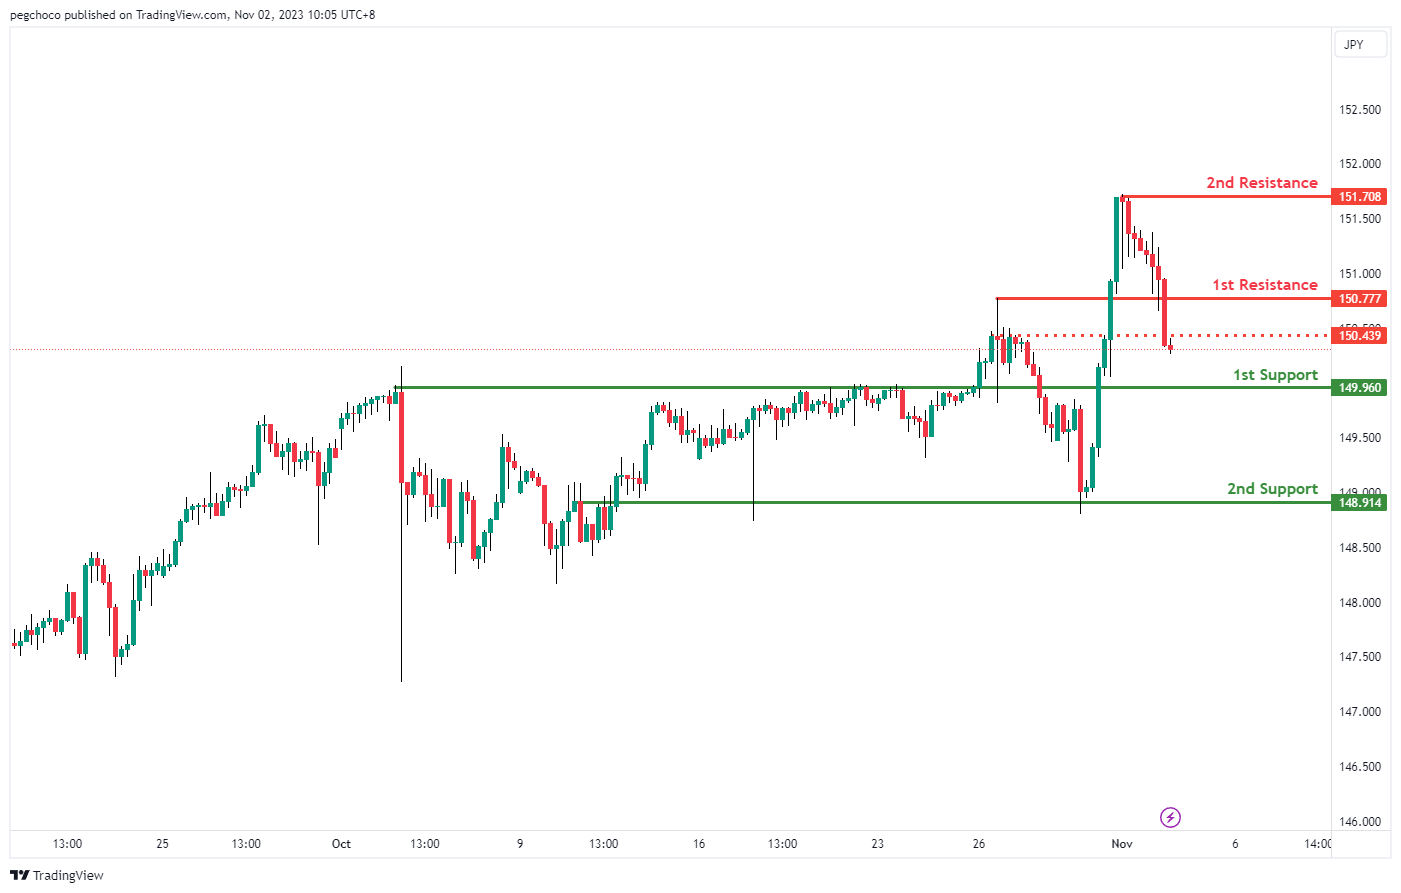
The USD/JPY chart currently has a bearish overall momentum, suggesting the potential for a bearish continuation towards the 1st support level.
1st support at 149.96 is identified as a pullback support, indicating it could be a significant level where the price might find some buying interest.
The 2nd support at 149.91 is considered an overlap support, further reinforcing its potential as a support level.
On the resistance side, the 1st resistance at 150.77 is identified as a pullback resistance, suggesting it could act as a level where the price may face selling pressure.
The 2nd resistance at 151.70 is categorized as a swing high resistance, indicating another potential level where the price may encounter obstacles in its upward movement.
Intermediate resistance at 150.43 is also noted as a pullback resistance, adding to the potential areas where the price might find resistance.
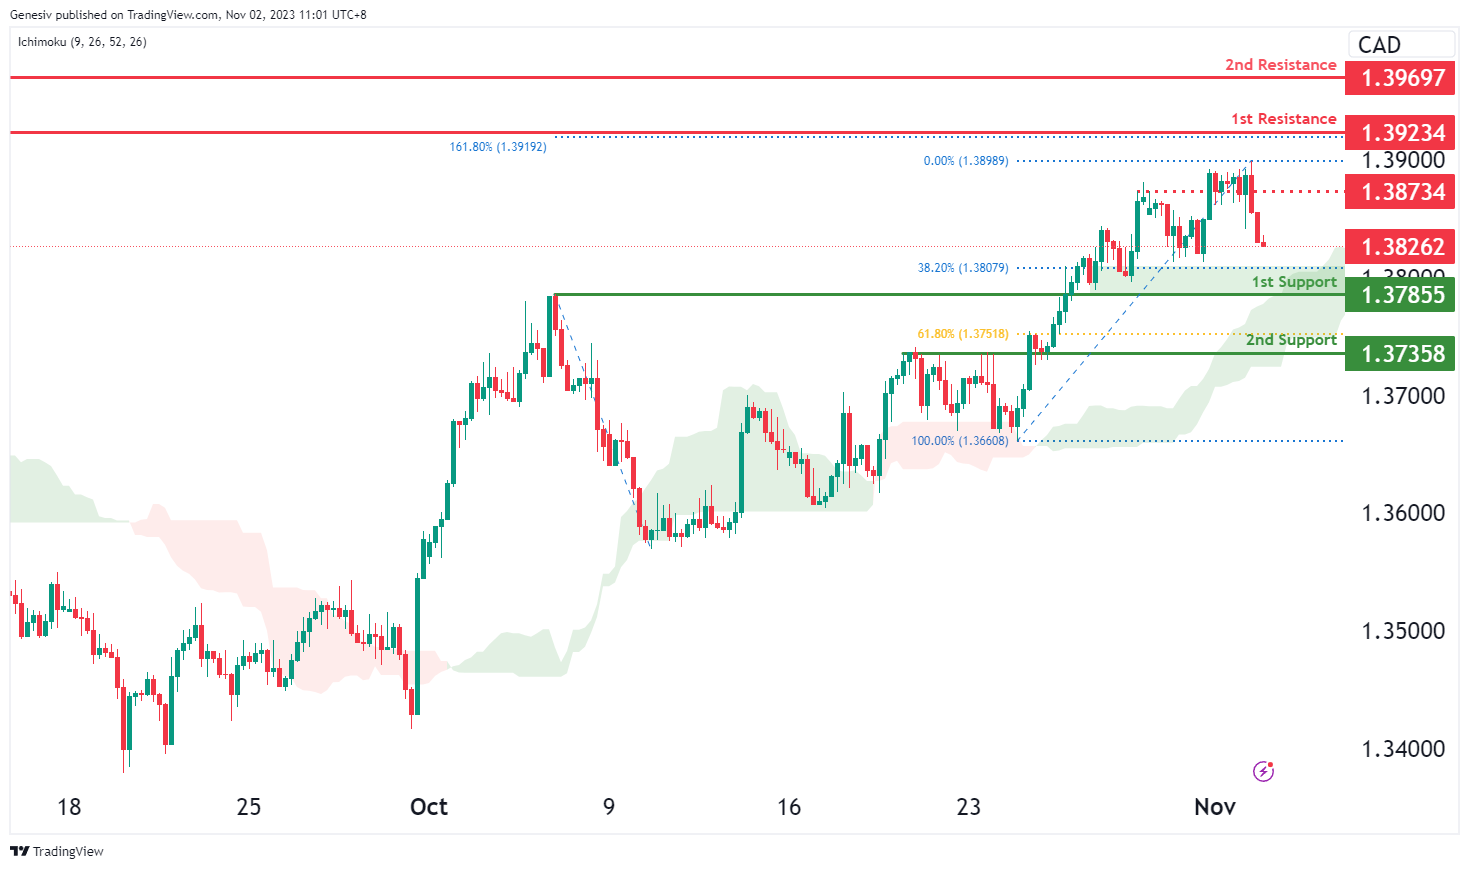
USD/CAD:
The USD/CAD chart currently demonstrates an overall bearish momentum. There is a potential scenario for price to make a bearish continuation towards the 1st support.
The 1st support level at 1.3786 is identified as an overlap support that aligns close to the 38.20% Fibonacci retracement level. Further below, the 2nd support level at 1.3736 is also marked as an overlap support that aligns close to the 61.80% Fibonacci retracement level, indicating a potential area of price support.
To the upside, the intermediate resistance at 1.3873 is identified as an overlap resistance while the 1st resistance level at 1.3923 is identified as a swing-high resistance that aligns with the 161.80% Fibonacci extension level. Beyond that, the 2nd resistance level at 1.3969 is also marked as a swing-high resistance, further reinforcing the potential for resistance in that region.
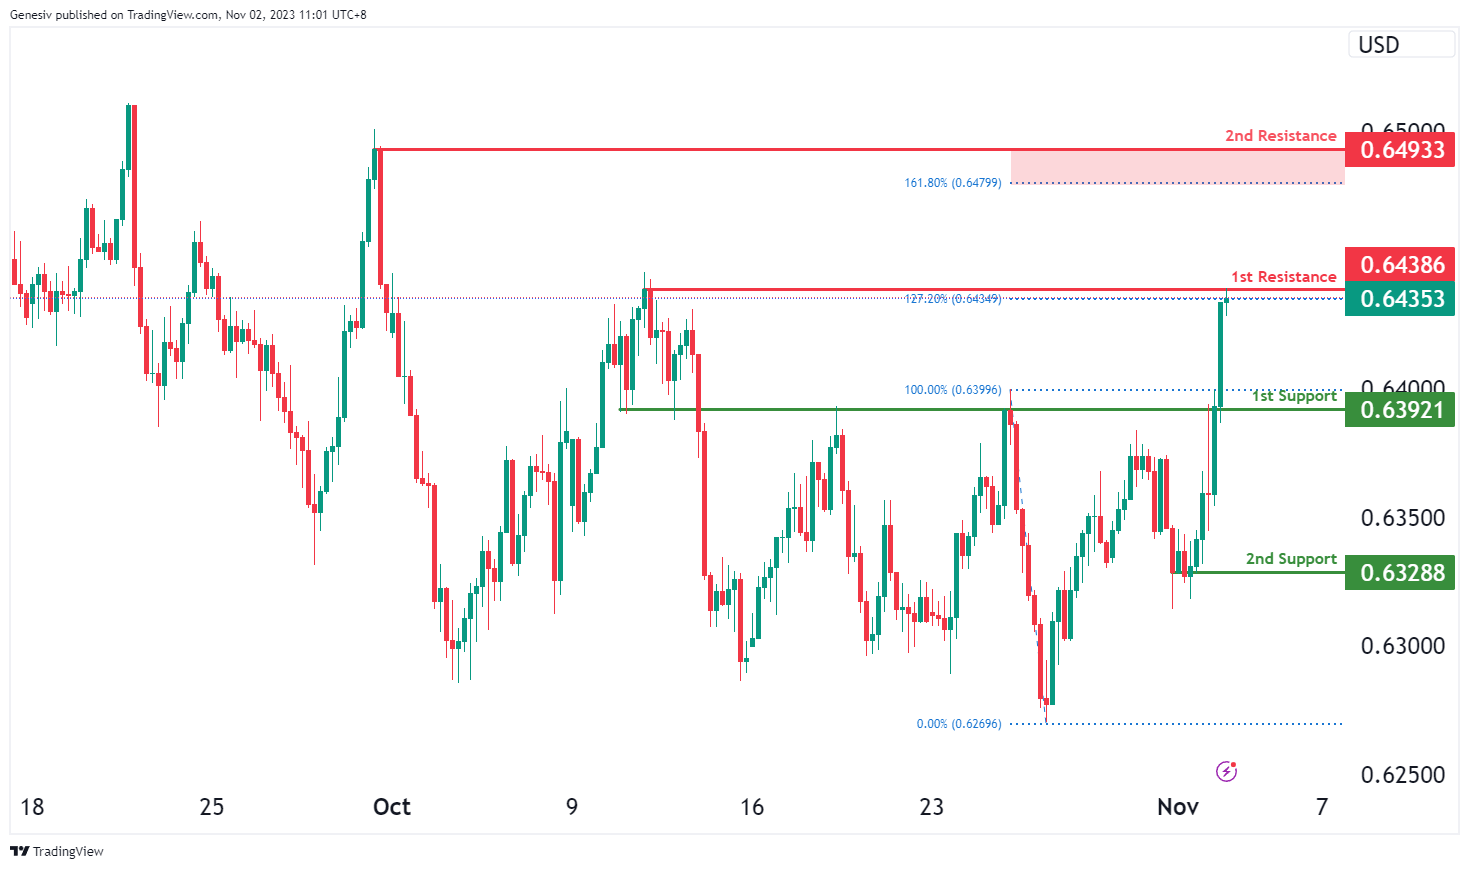
AUD/USD:
The AUD/USD chart currently exhibits an overall bullish momentum, suggesting a potential for a bullish continuation towards the 1st resistance.
The 1st resistance level at 0.6439 is identified as a swing-high resistance that aligns with the 127.20% Fibonacci extension level. Higher up, the 2nd resistance level at 0.6493 is also noted as a swing-high resistance that aligns close to the 161.80% Fibonacci extension level.
To the downside, the 1st support level at 0.6392 is identified as an overlap support. Further below, the 2nd support level at 0.6329 is marked as a pullback support, indicating a potential for a strong price support.
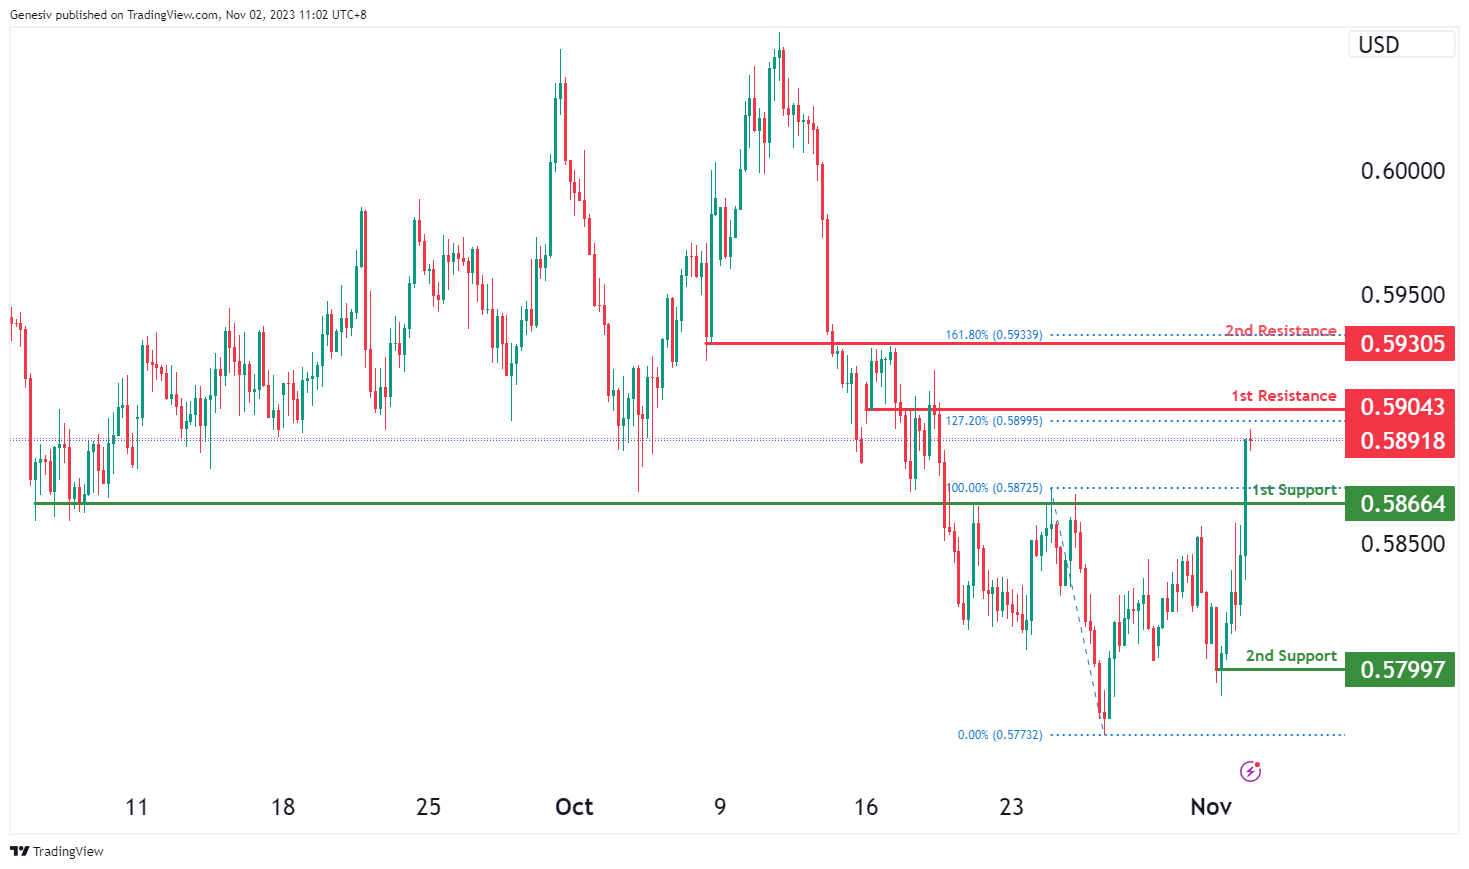
NZD/USD
The NZD/USD chart currently demonstrates an overall bullish momentum, suggesting a potential for a bullish continuation towards the 1st resistance.
The 1st resistance level at 0.5904 is identified as an overlap resistance that aligns with the 127.20% Fibonacci extension level. Beyond this, the 2nd resistance level at 0.5931 is also noted as an overlap resistance that aligns with the 161.80% Fibonacci extension level, acting as a potential barrier to upward price movements.
To the downside, the 1st support level at 0.5866 is identified as an overlap support. Additionally, the 2nd support level at 0.5799 is marked as a pullback, potentially acting as a strong support zone.
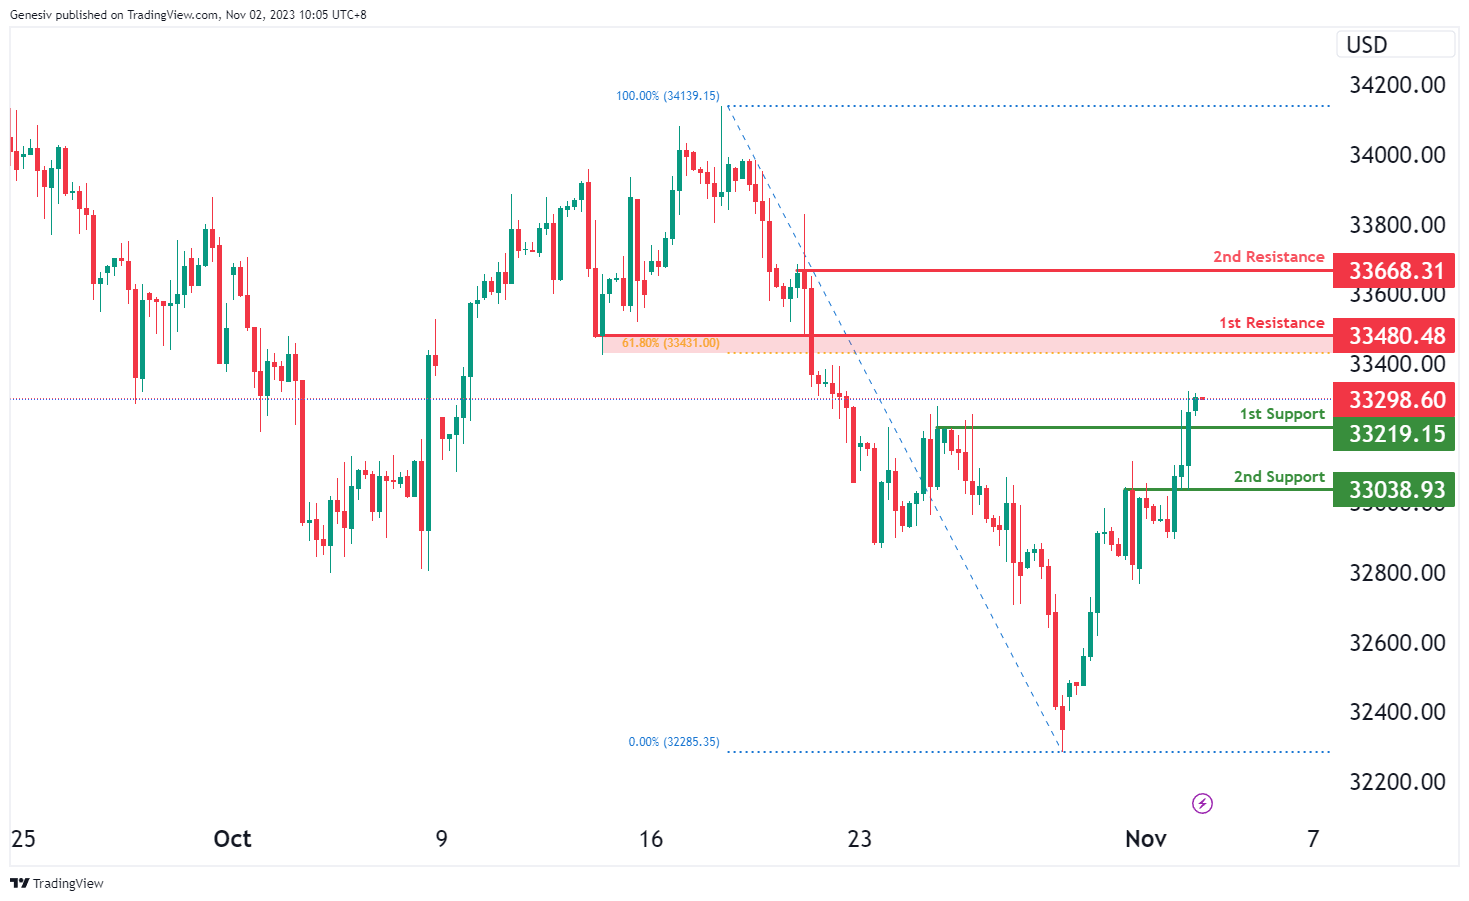
DJ30:
The DJ30 chart currently indicates a bullish momentum, suggesting a potential scenario for a bullish bounce off the first support at 33219.15. This level is considered a pullback support. The second support at 33038.93 aligns with swing low support levels. In terms of resistance, the first resistance at 33480.48 is marked by pullback resistance and coincides with the 61.80% Fibonacci Retracement. The second resistance at 33668.31 is identified as swing high resistance, potentially acting as a significant barrier for the price’s upward movement.
GER40:
The GER40 chart reflects a bullish trend, suggesting a potential scenario for a bullish continuation towards the first resistance at 15071.80. The first support at 14907.90 is regarded as a pullback support level, while the second support at 14800.00 aligns with an overlap support, both serving as potential levels where the price might find support.
On the resistance side, the first resistance level at 15071.80 is characterized by an overlap resistance, potentially posing a significant hurdle to the price’s upward movement. The second resistance at 15138.90 is identified as pullback resistance, indicating another potential barrier for further bullish advancement in price.

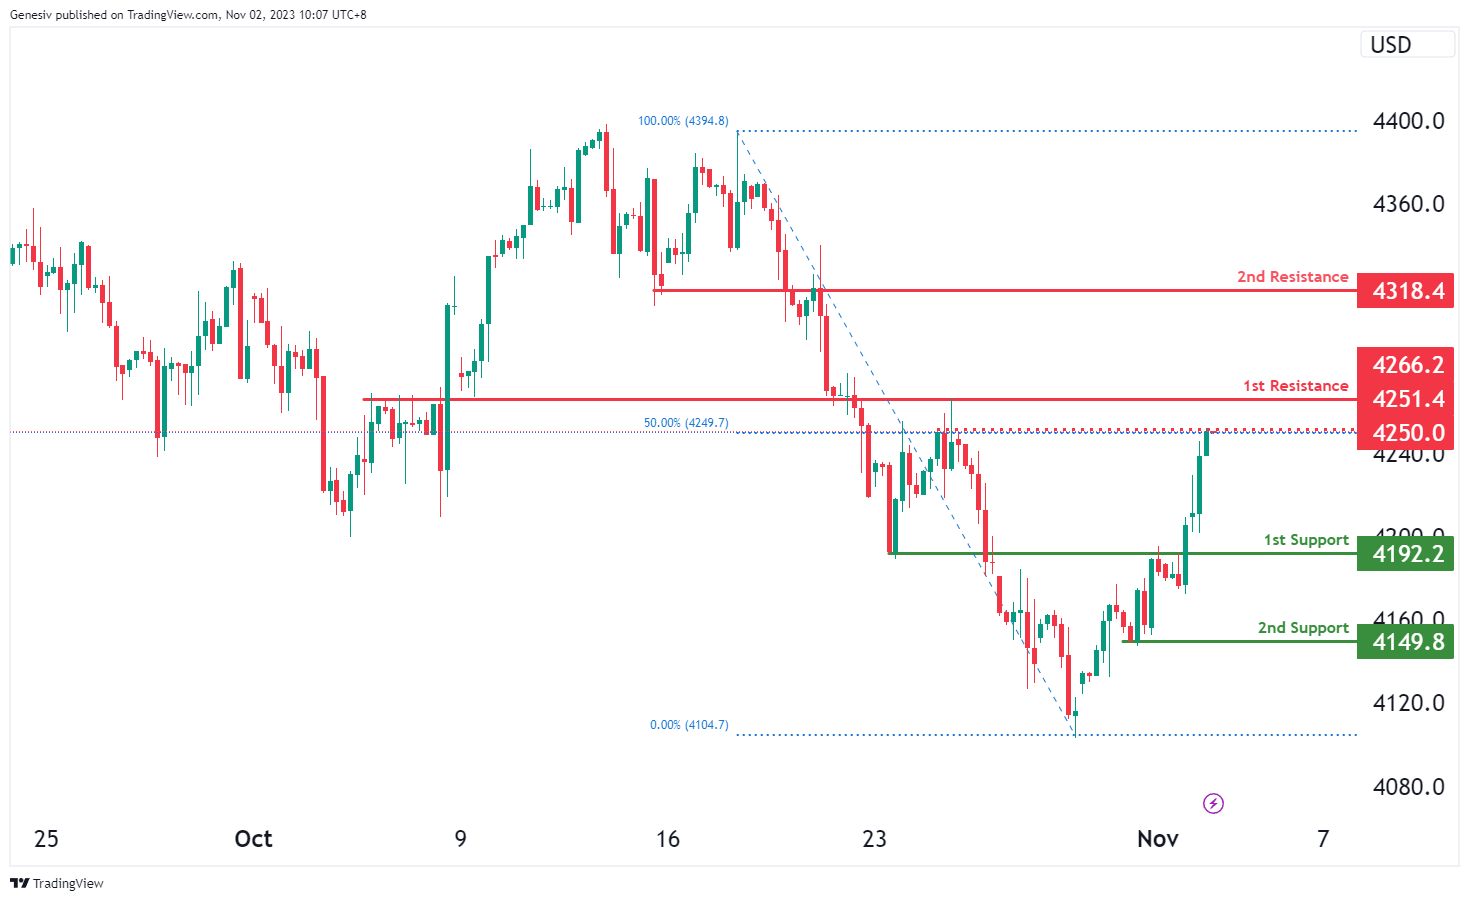
US500
The US500 chart exhibits a bullish trend, indicating the potential for a bullish continuation towards the first resistance at 4266.2. The first support at 4192.2 is considered a pullback support, while the second support at 4149.8 aligns with swing low support, both indicating potential levels where the price might find support during upward movement.
In terms of resistance, the first resistance at 4266.2 is characterized by an overlap resistance, representing a significant hurdle for the price’s upward movement. The second resistance at 4138.4 is also an overlap resistance, potentially posing another barrier to the upward momentum.
Additionally, an intermediate resistance at 4249.7 coincides with swing high resistance and the 50% Fibonacci Retracement level, further reinforcing a potential price barrier within the bullish trend.
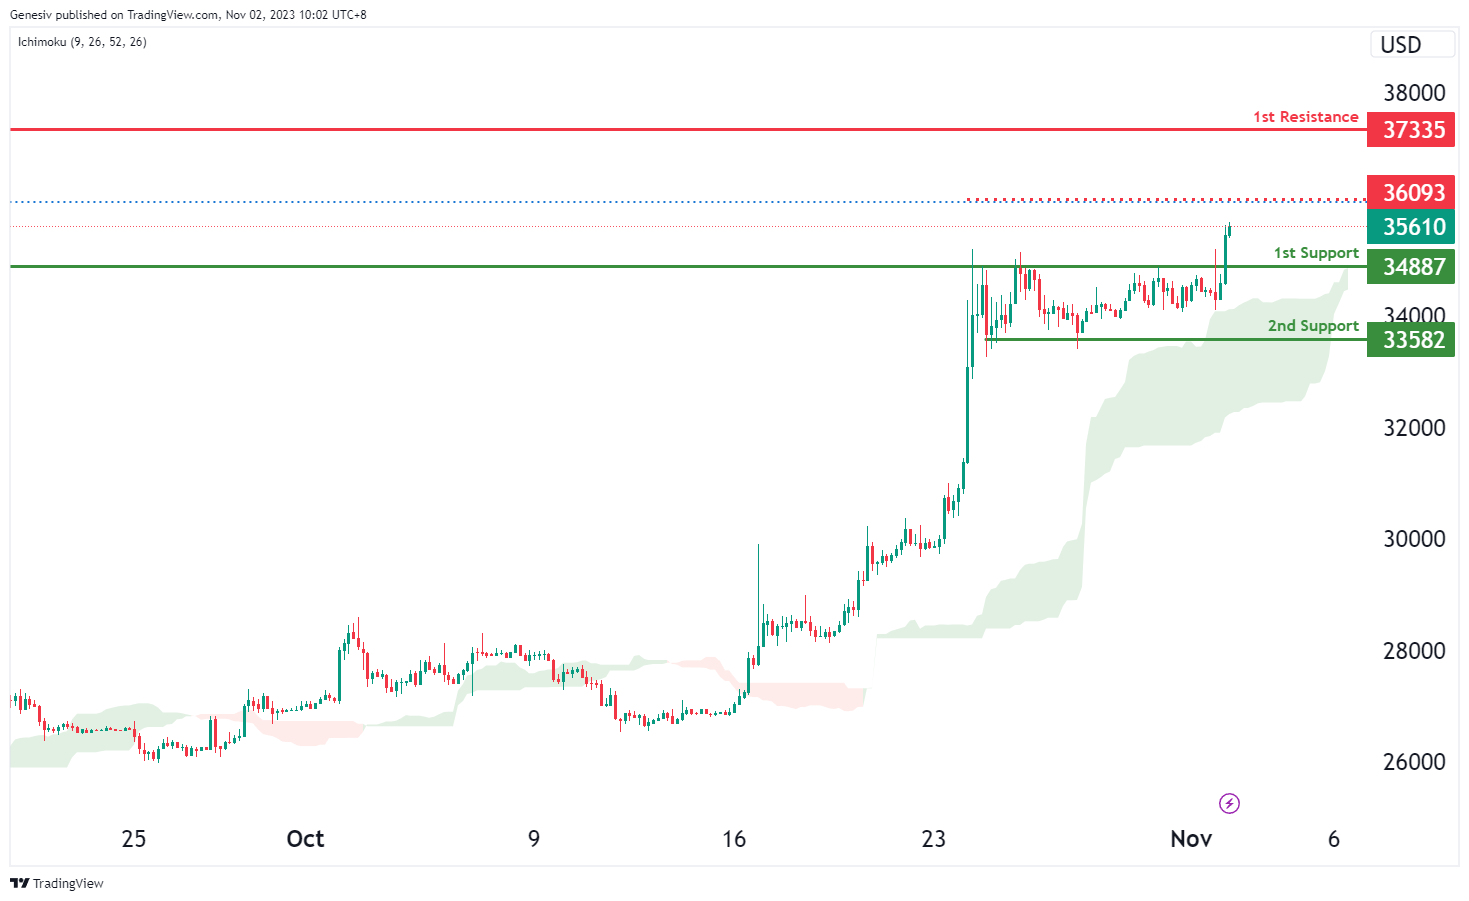
BTC/USD:
The BTC/USD chart exhibits a bullish trend, supported by its position above the bullish Ichimoku cloud. There’s a potential for a bullish continuation towards the first resistance at 37335, attributed to its pullback resistance. The first support at 34887 functions as a pullback support, while the second support at 33582 aligns with a multi-swing low support. Additionally, an intermediate resistance at 36093 coincides with the 161.80% Fibonacci Extension, further supporting the potential bullish movement.
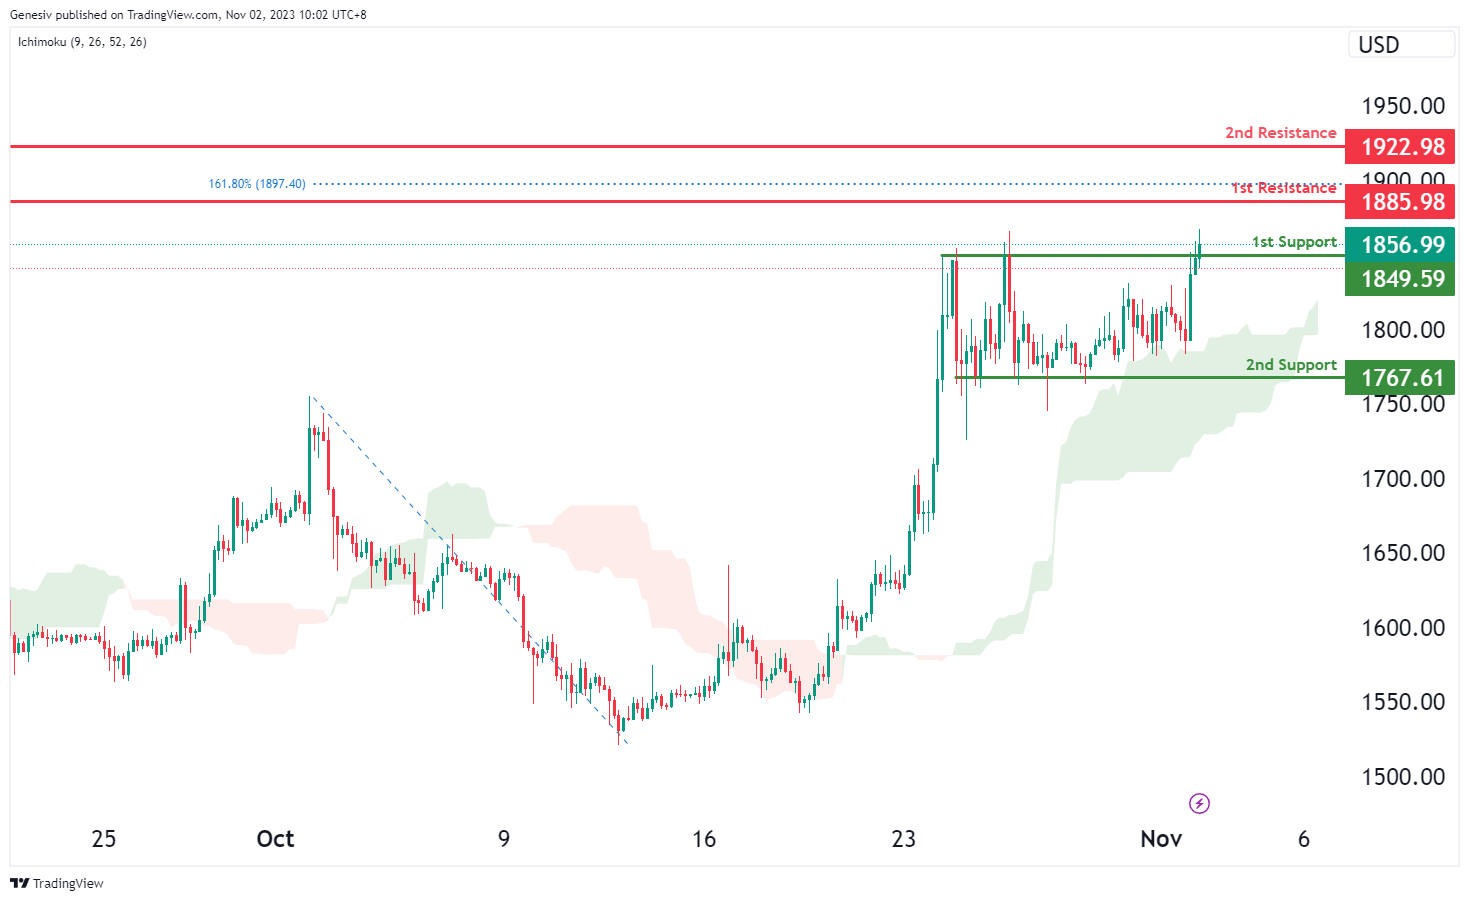
ETH/USD:
The ETH/USD chart is currently displaying a bullish trend, supported by its position above the bullish Ichimoku cloud. There’s a potential for a bullish bounce off the first support at 1849.59, which serves as a pullback support, possibly heading towards the first resistance at 1885.98. The second support at 1767.61 aligns with a multi-swing low support. Additionally, the first resistance is reinforced by an overlap resistance and the 161.80% Fibonacci Extension, while the second resistance at 1922.98 is also identified as an overlap resistance, indicating potential price barriers.
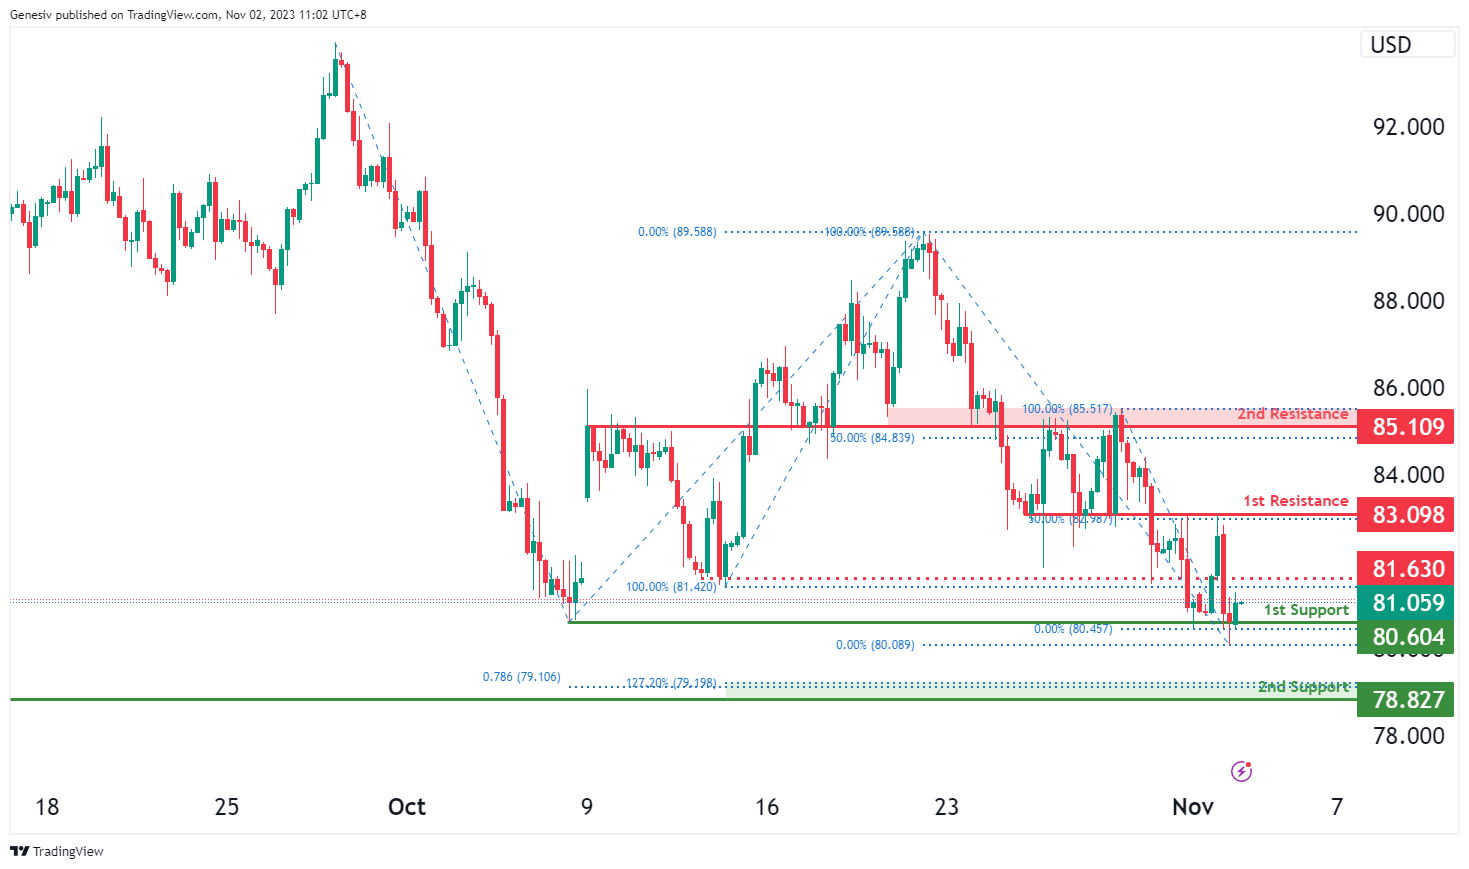
WTI/USD:
The WTI chart currently exhibits an overall bearish momentum. However, there is a potential for price to make a bullish bounce off the 1st support. Should price break above the intermediate resistance, there is a possibility for price to rise towards the 1st resistance.
The intermediate resistance level at 81.63 is identified as a pullback resistance while the 1st resistance level at 83.09 is noted as an overlap resistance that aligns with the 50.00% Fibonacci retracement level. Higher up, the 2nd resistance level at 85.11 is also marked as an overlap resistance that aligns with the 50.00% Fibonacci retracement level, making it a strong potential barrier to upward price movement.
To the downside, the 1st support level at 80.60 is identified as a swing-low support. Additionally, the 2nd support level at 78.83 is marked as a pullback support that aligns with a confluence of Fibonacci levels i.e. the 127.20% extension and the 78.60% projection levels, reinforcing a potential support zone.
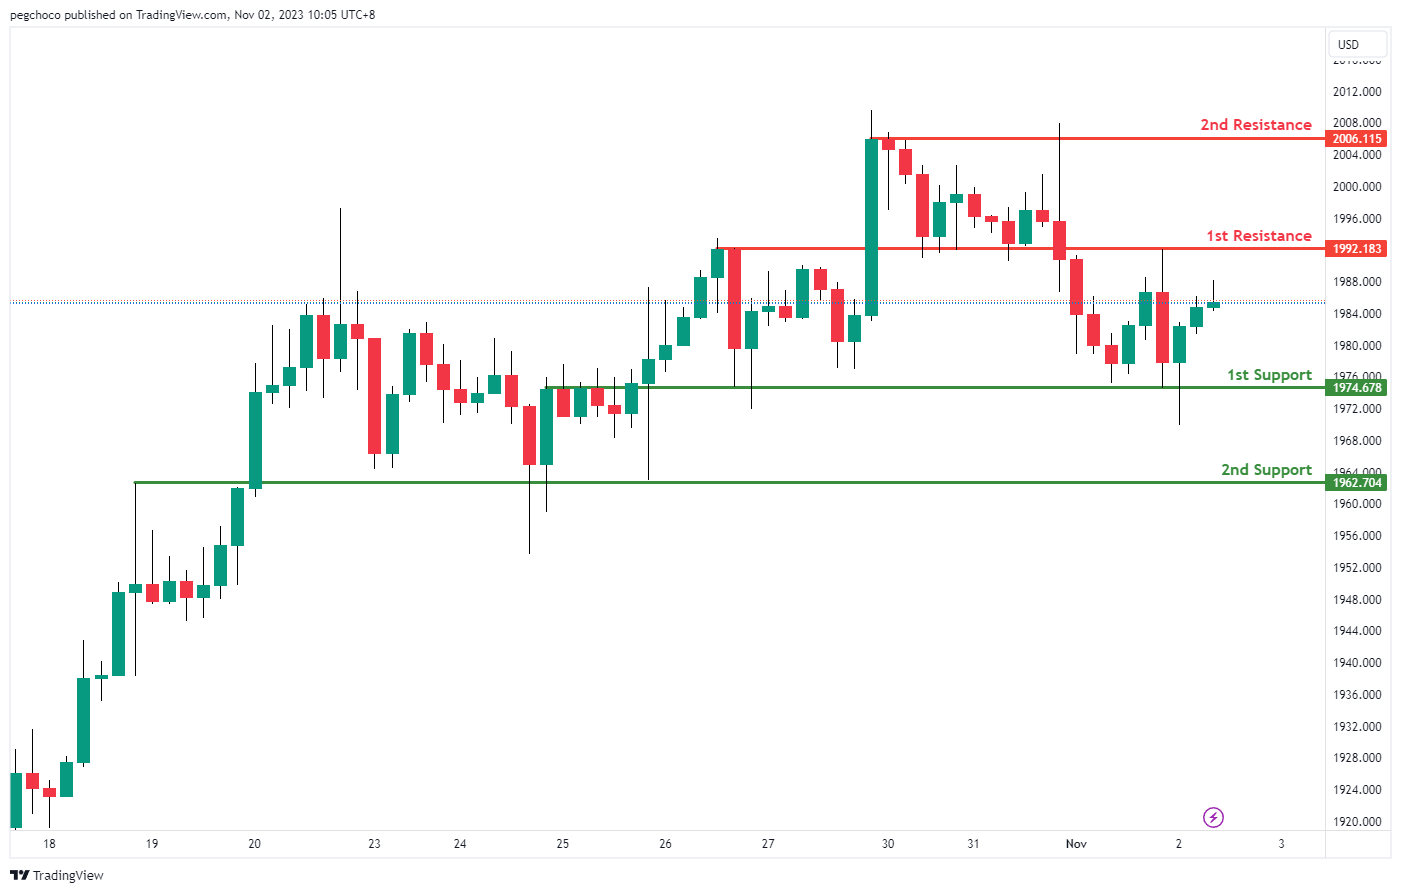
XAU/USD (GOLD):
The XAU/USD (Gold/US Dollar) chart currently has a neutral overall momentum, indicating a lack of a strong directional bias. In this situation, it’s suggested that the price could potentially fluctuate between the 1st support and 1st resistance levels.
1st support at 1974.67 is identified as an overlap support, suggesting it could be a significant level where the price might find some buying interest.
The 2nd support at 1962.70 is also categorized as an overlap support, further reinforcing its potential as a support level.
On the resistance side, the 1st resistance at 1992.18 is noted as an overlap resistance, indicating it could act as a level where the price may face selling pressure.
The 2nd resistance at 2006.11 is categorized as a multi-swing high resistance, suggesting it might be a level where the price encounters obstacles in its upward movement.


