
In the last years, the renminbi made a pause in his attempt to get stronger against USD dollar. In February 2014, renminbi found support at 6.0153 as wave ((III)) and from there it made a perfect zig – zag correction structure to equal legs at 7.1964 in June 2020. After these 3 swings, USDCNH should have continued with the downtrend. However, the pair turning up again breaking 7.1964 high suggesting that market is developing a double correction structure. (If you want to learn more about Elliott Wave Theory, please follow these links: Elliott Wave Education and Elliott Wave Theory)
USDCNH July 2023 Weekly Chart
The wave “a” began at 6.0153 (2014 low) and moved high in 3 waves structure almost hit 7.00 dollars ending at 6.9854. After this zig zag correction, we have a huge drop to 6.2359 developing a double correction structure to end wave “b”. The volatility did not leave things like that an enormous rally took place in the beginning of wave “c”. This movement built again 3 waves higher completing wave “c” at 7.1974 and also wave (w) reaching the 100% Fibonacci extension.
Down from (w), we could see that an expanded flat correction took place as wave (x) finishing as an ending diagonal at 6.3058 low. Then again a strong rally took a part. This move higher looks like an impulse and we labeled as wave “a” ended at 7.3748 above wave (w) confirming a corre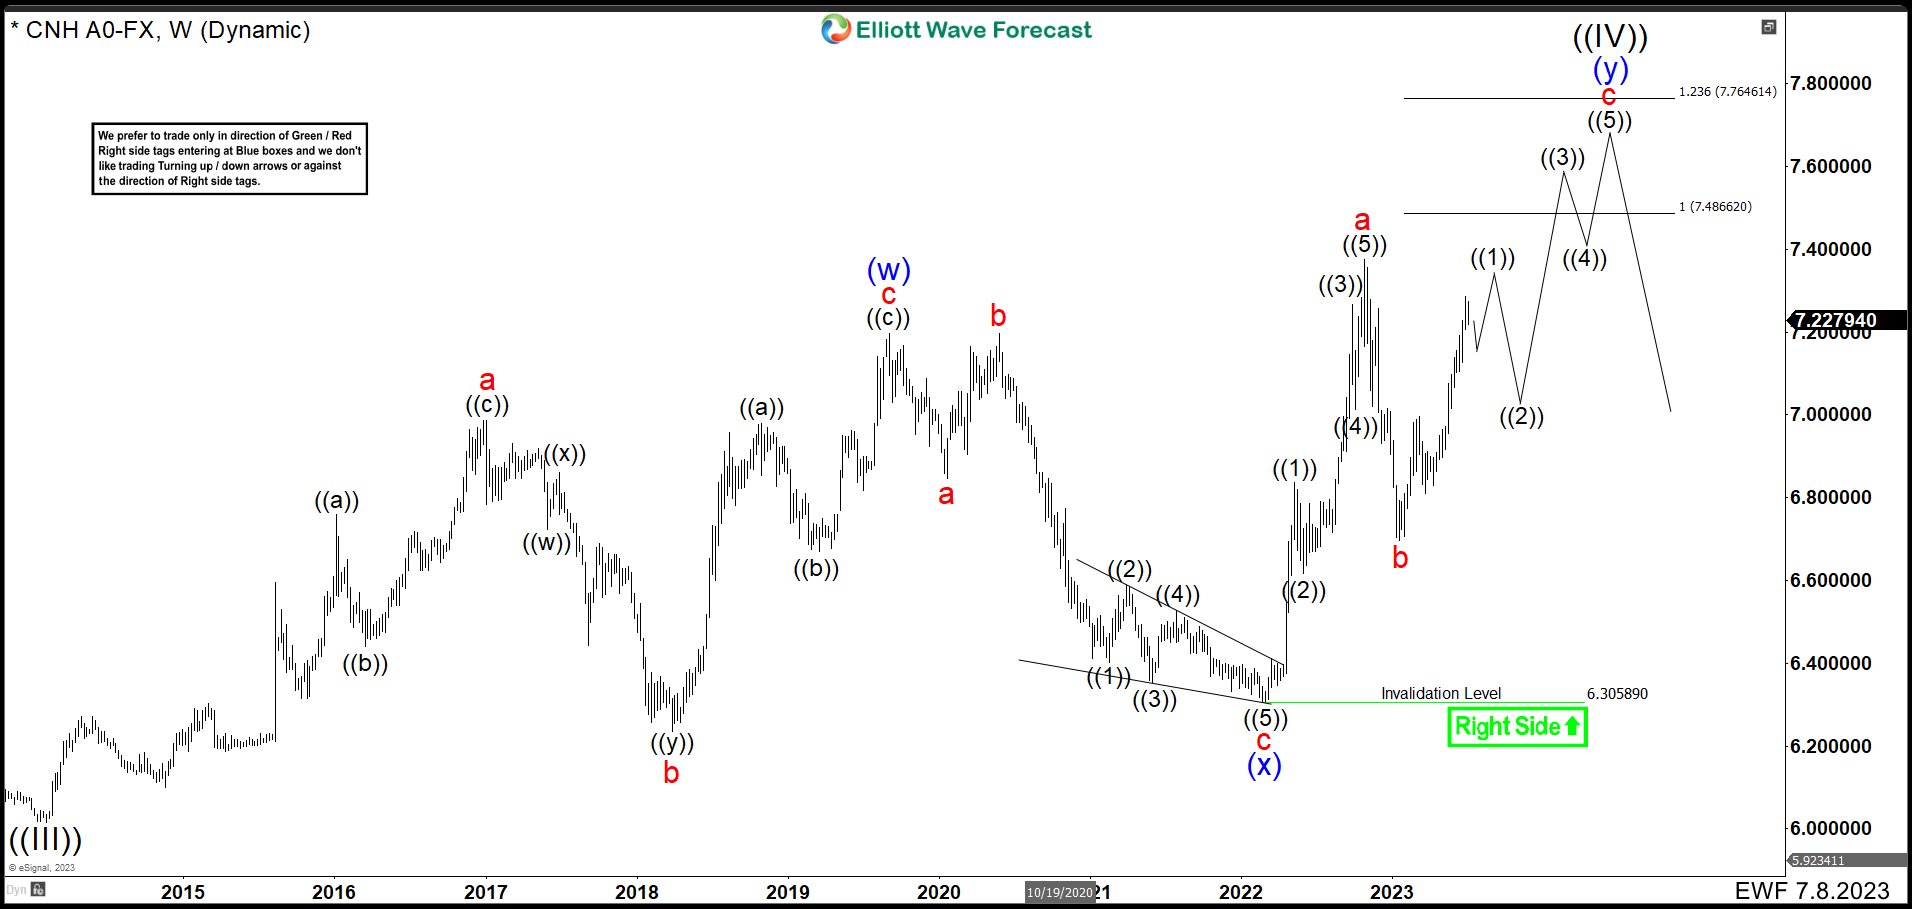 ctive bullish sequence. Then USDCNH made a wave “b” ended at 6.6883 and bounced in the last leg higher.
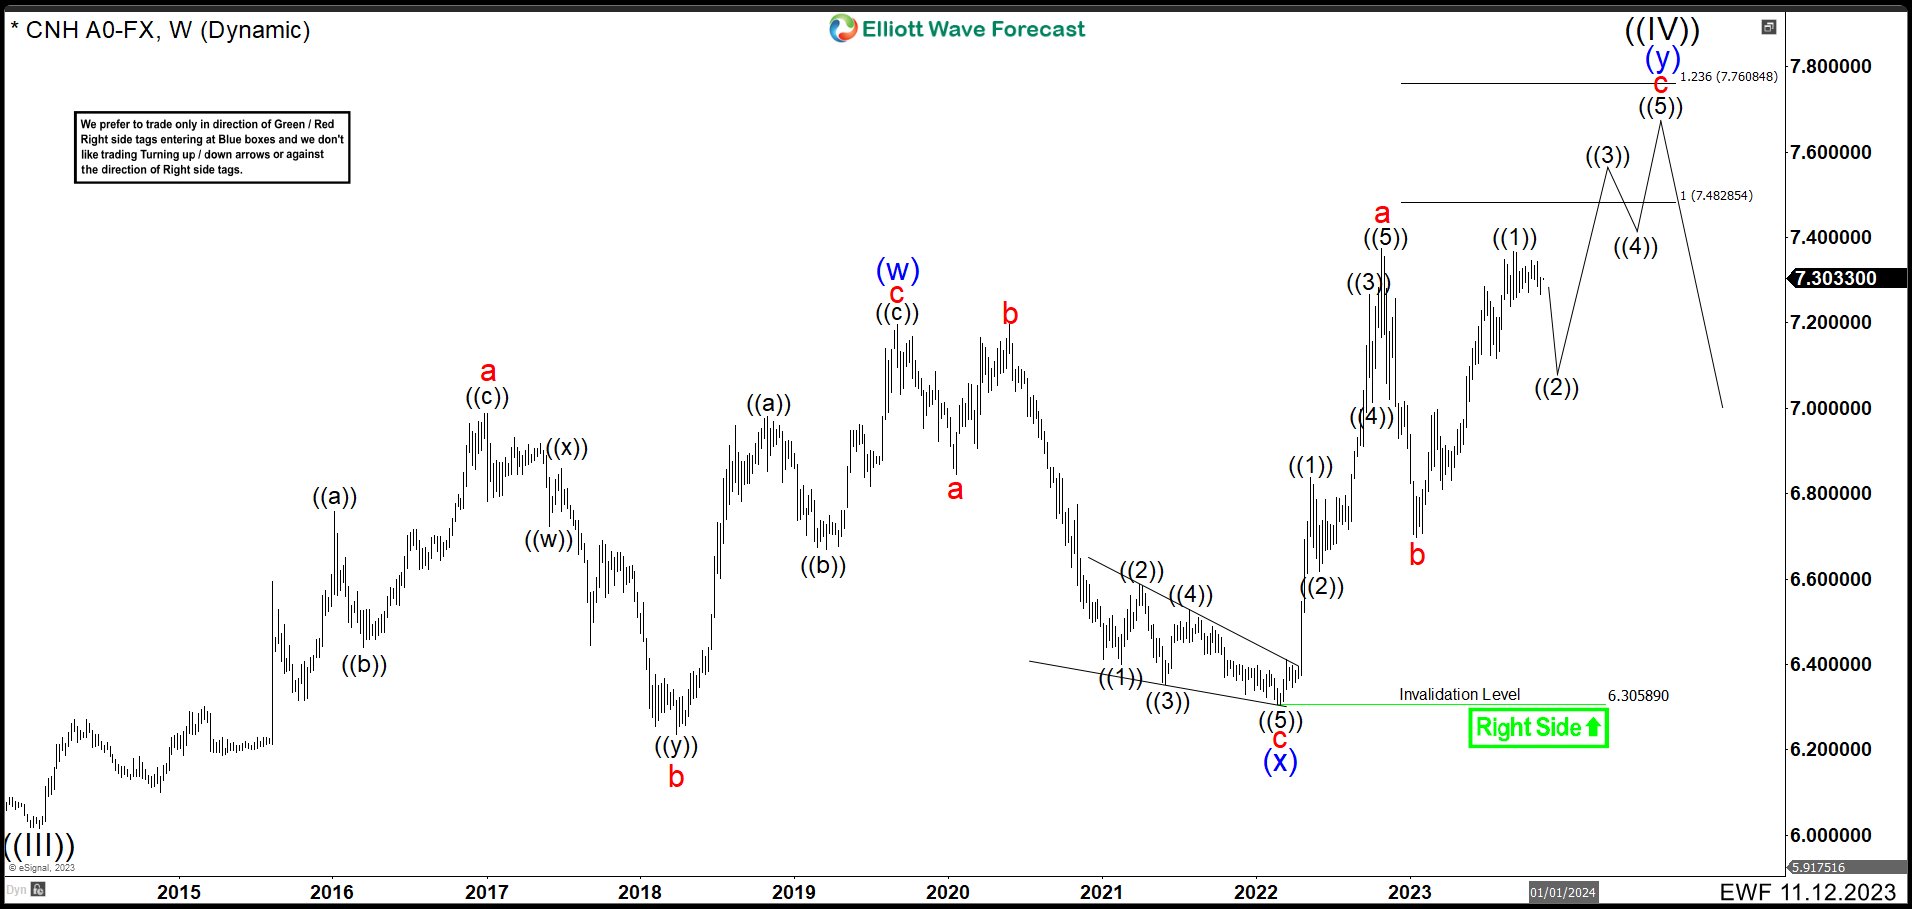
USDCNH November 2023 Weekly Chart
In the chart above, looks like the first leg of the wave “c” ended as wave ((1)). Up from 6.6883 low, we can see 5 swings higher creating an impulse. First wave ended at 6.9967. Wave (2) pullback at 6.8107 low. Then USDCNH rally finishing wave (3) at 7.2855. Wave (4) correction completed at 7.1162 low. Last push to 7.3679 ended wave (5) and wave ((1)). Currently, we are expecting a correction as wave ((2)) of “c”. This movement should drop to 7.12 – 6.95 area correlating with USDX weakness that we are looking for. After finishing wave ((2)), pair should rally in 3 swings to build an impulse as wave “c” to 7.4866 – 7.7646 area. This also will finish the double correction wave (y), and the wave ((IV)) before renminbi continues with the downtrend.


) and from there it made a perfect zig – zag correction structure to equal legs at 7.1964 in June 2020. After these 3 swings, USDCNH should have continued with the downtrend. However, the pair turning up again breaking 7.1964 high suggesting that market is developing a double correction structure. (If you want to learn more about Elliott Wave Theory, please follow these links: Elliott Wave Education and Elliott Wave Theory))