
- Yesterday’s swift rally has led to an overstretched upside momentum condition.
- At the risk of a minor corrective pull-back within its short-term uptrend phase.
- Watch the 33,150 key short-term support.
The price actions of the Japan 225 Index (proxy of the Nikkei 225 futures) have managed to hold above the 32,090 key medium-term support as highlighted in our previous analysis (printed an intraday low of 32,164 on 8 December 2023 before it reversed up by +5.2% to retest its 33 -year high which is the medium-term range resistance of 33,770/825 in place since 16 June 2023.
At a 33-year high with a positive medium-term momentum condition
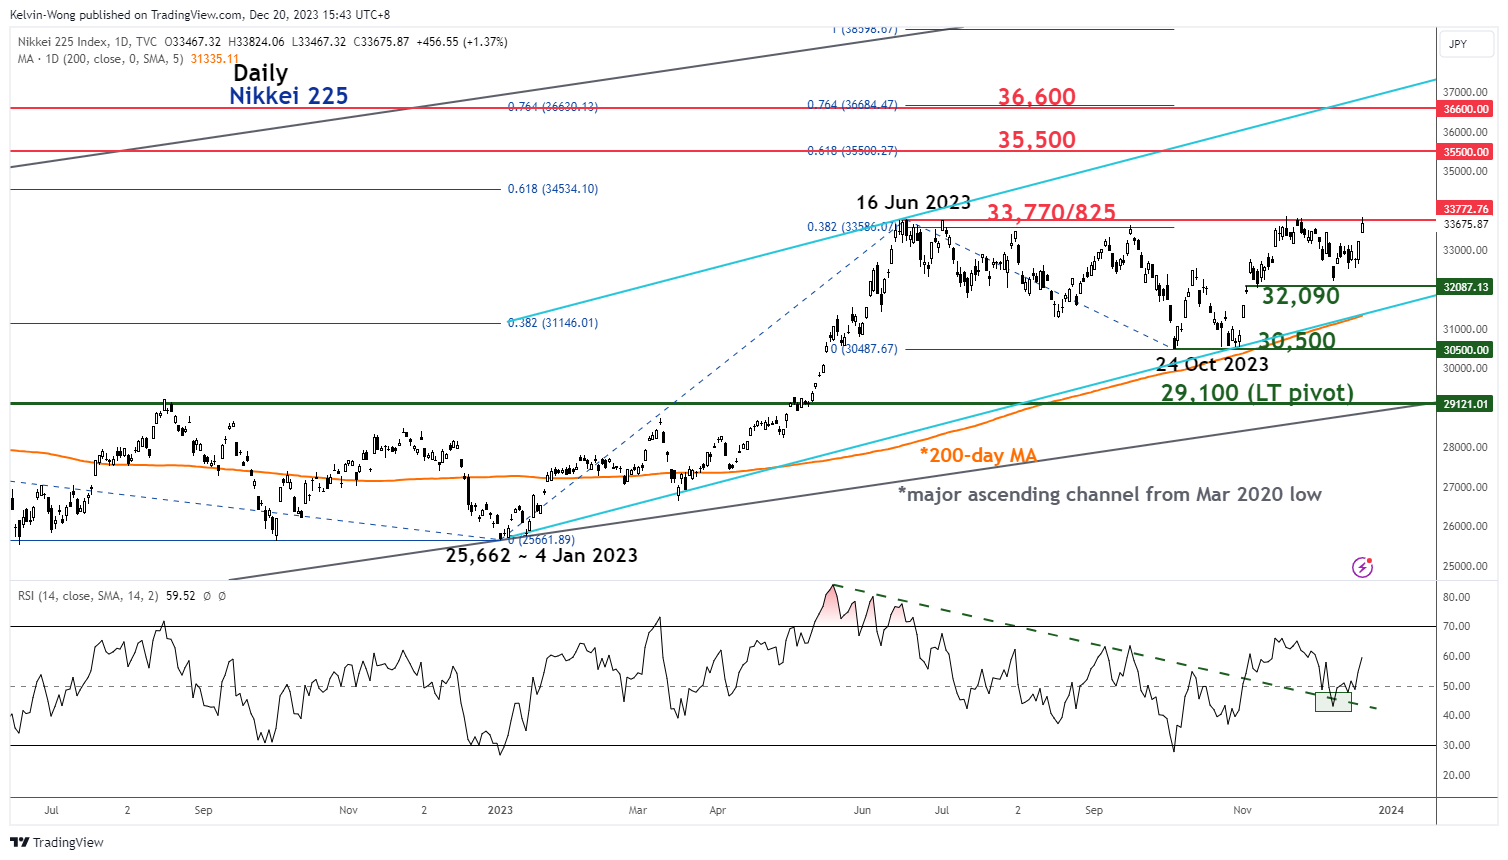
Fig 1: Nikkei 225 major & medium-term trends as of 20 Dec 2023 (Source: TradingView, click to enlarge chart)
This “stubborn level” of 33,770/825 has created a barrier for the bulls thrice on 3 July, 15 September, and 20 November. Hence, right now it will be the fourth test on this barrier today, 20 December at this time of writing.
So, will it be another failure or a bullish breakthrough? The latest reading seen in the medium-term daily RSI momentum indicator has advocated for a potential bullish breakout scenario above 33,770/825.
The daily RSI has managed to stage a rebound after a retest at a parallel pull-back support at the 43 level and has yet to reach its overbought region. These observations suggest that medium-term upside momentum has resurfaced without being overstretched.
Minor corrective pull-back in progress
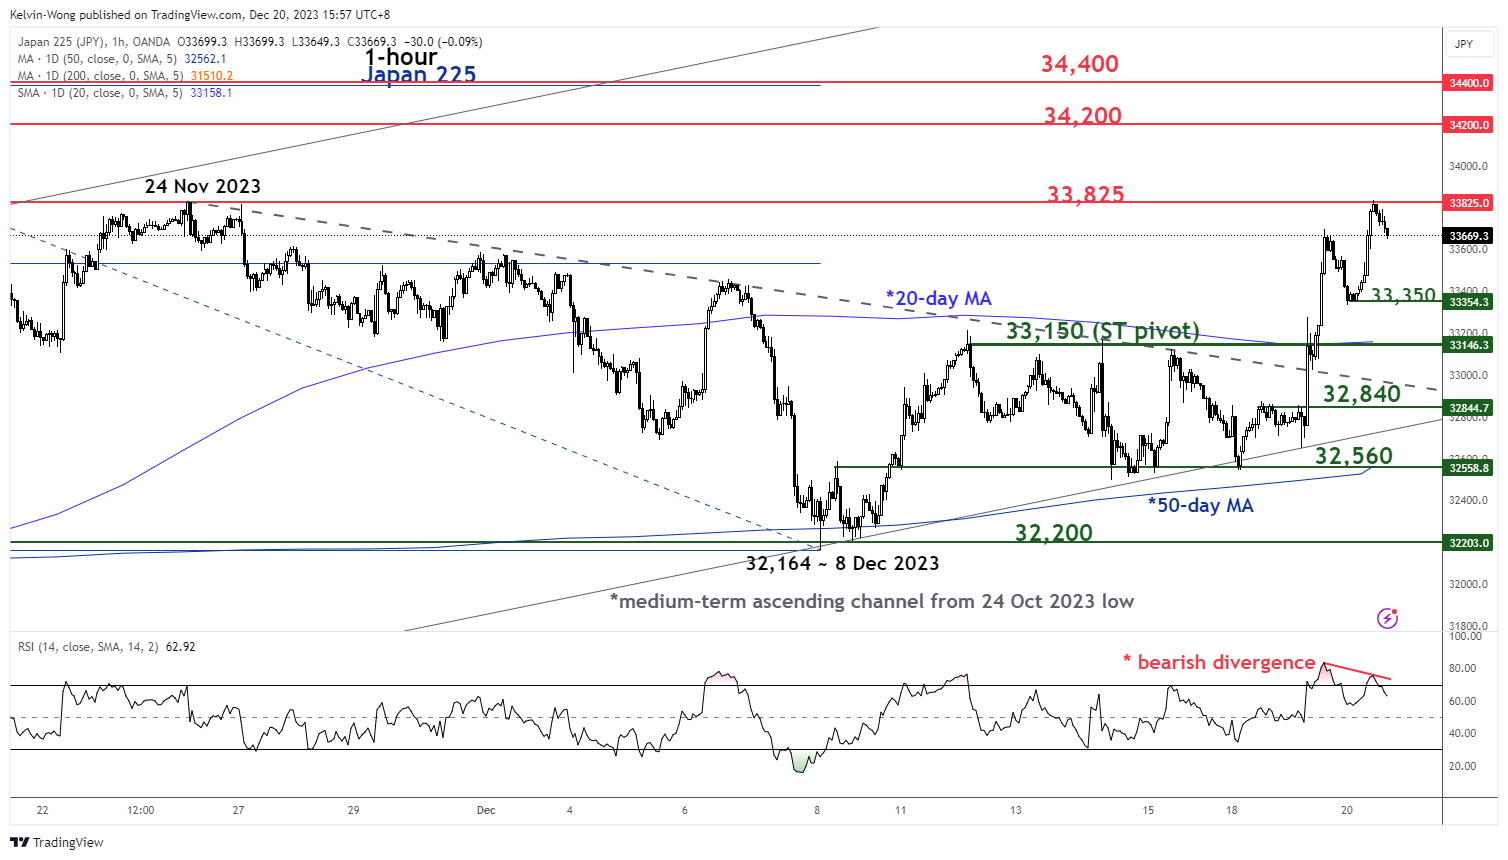
Fig 2: Japan 225 minor short-term trend as of 20 Dec 2023 (Source: TradingView, click to enlarge chart)
Through the lens of technical analysis, price actions do not move in a vertical direction but instead oscillate within trends. The Index has evolved into a short-term uptrend phase from its 8 December 2023 low of 32,164 as price actions surpassed the 20-day moving average.
A point to note that is the rally seen yesterday, 9 December has been reinforced by the Bank of Japan’s monetary policy forward guidance that offered no clear indication of an imminent removal of its short-term negative interest rate policy.
This set of short-term bullish impulsive sequence has been swift which in turn led to an overstretched upside momentum condition as the hourly RSI momentum indicator has just flashed a bearish divergence condition as its overbought region.
Hence, the Index may undergo a minor corrective pull-back at this juncture within its short-term uptrend phase toward the near-term support at 33,350.
If the 33,150 key short-term pivotal support (also the 20-day moving average) manages to hold, the Index may see another probe at 33,825 and above it sees the next intermediate resistance coming in at 34,200 in the first step.
However, a break below 33,150 negates the bullish tone to expose the next immediate supports at 32,840 and 32,560 (50-day moving average).


 have managed to hold above the 32,090 key medium-term support as highlighted in our previous analysis (printed an intraday low of 32,164 on 8 December 2023 before it reversed up by +5.2% to retest its 33 -year high which is the medium-term range resistance of 33,770/825 in place since 16 June 2023.)