
DXY:
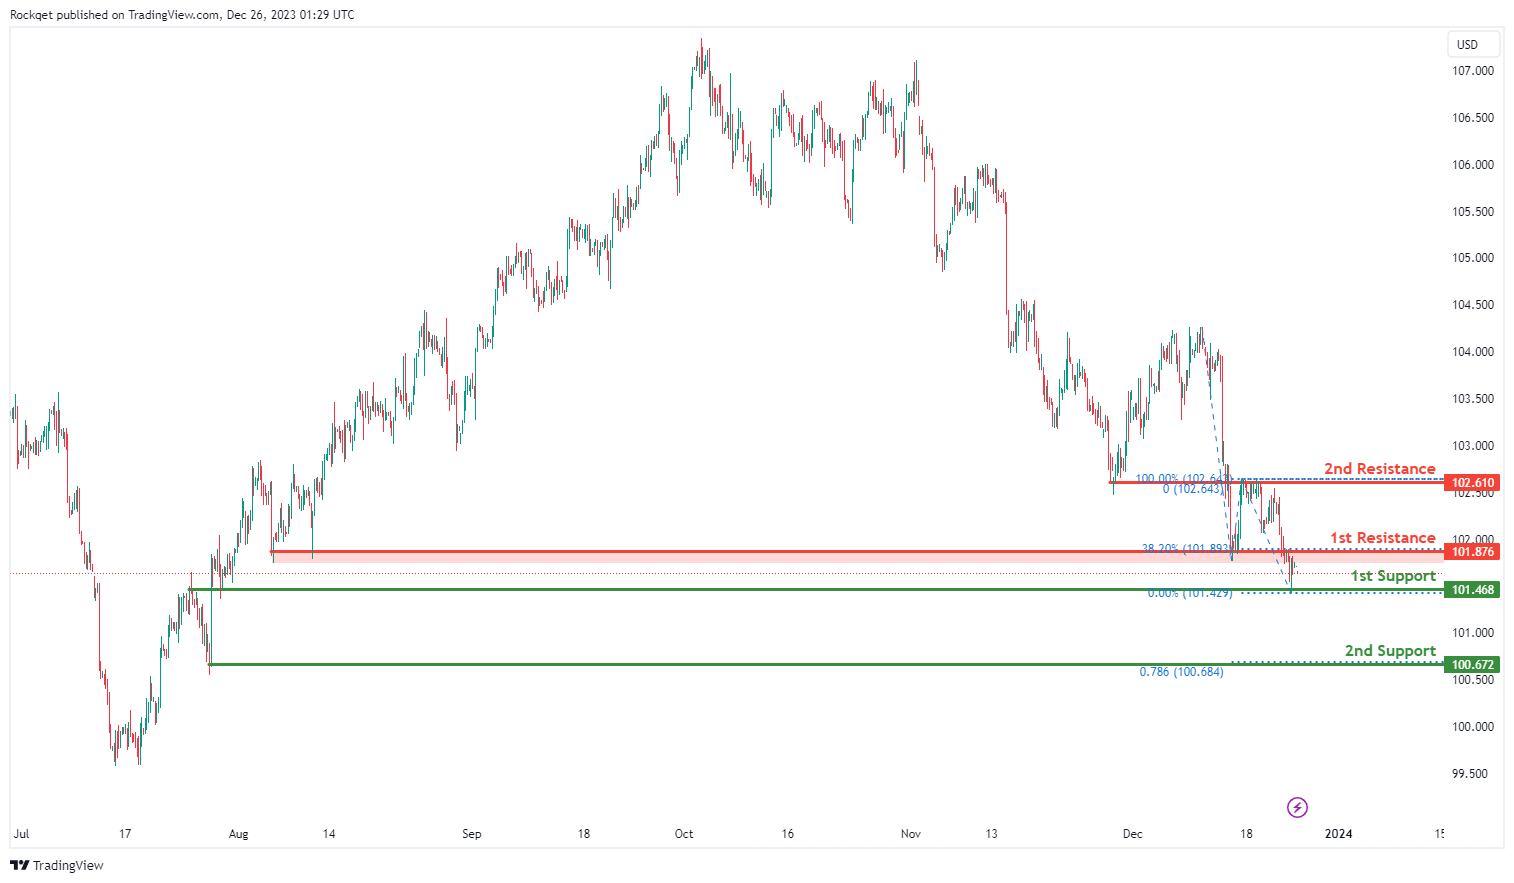
The DXY (US Dollar Index) chart currently shows an overall bearish momentum, indicating a potential for price to make a bearish continuation towards the 1st support.
The 1st support level at 101.46 is identified as an overlap support. Further below, the 2nd support level at 100.67 is noted as a swing-low support that aligns with the 78.60% Fibonacci projection level, further reinforcing its importance as a potential key support level.
To the upside, the 1st resistance level at 101.87 is identified as an overlap resistance that aligns with the 38.20% Fibonacci retracement level. Higher up, the 2nd resistance level at 102.61 is also marked as an overlap resistance, suggesting a potential barrier for further upside movement.
EUR/USD:
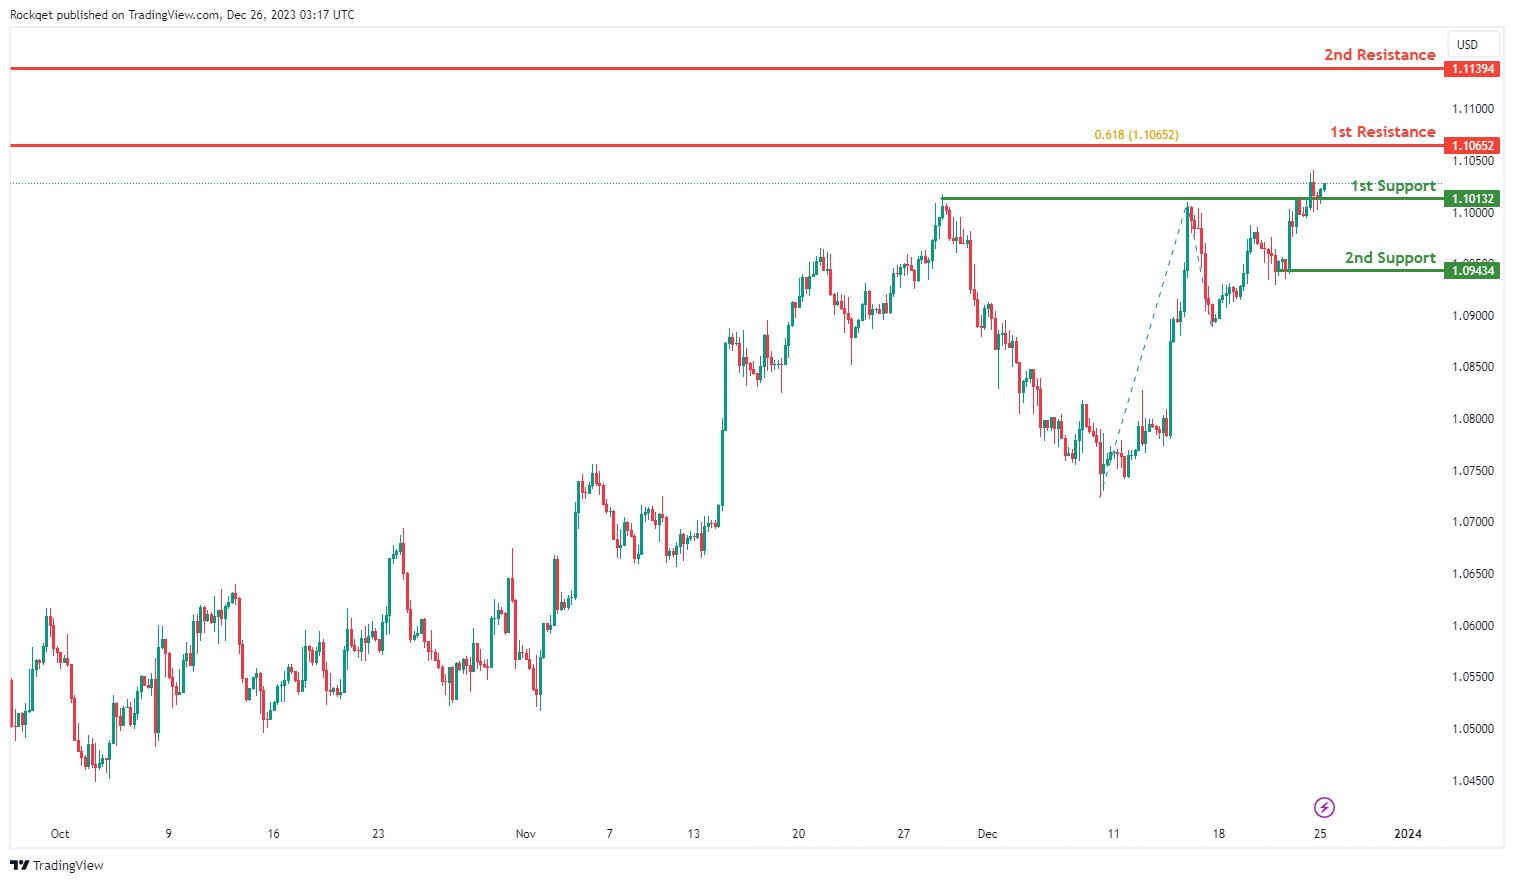
The EUR/USD chart currently exhibits an overall bullish momentum. In this context, there is a potential scenario for price to make a bullish continuation towards the 1st resistance.
The 1st resistance level at 1.1065 is identified as a swing-high resistance that aligns with the 61.80% Fibonacci projection level. Higher up, the 2nd resistance level at 1.1139 is also noted as a swing-high resistance, suggesting a potential barrier for further upside movement.
To the downside, the 1st support level at 1.1013 is identified as an overlap support. Further below, the 2nd support level at 1.0943 is marked as a pullback support, further reinforcing its importance as a potential key support level.
EUR/JPY:
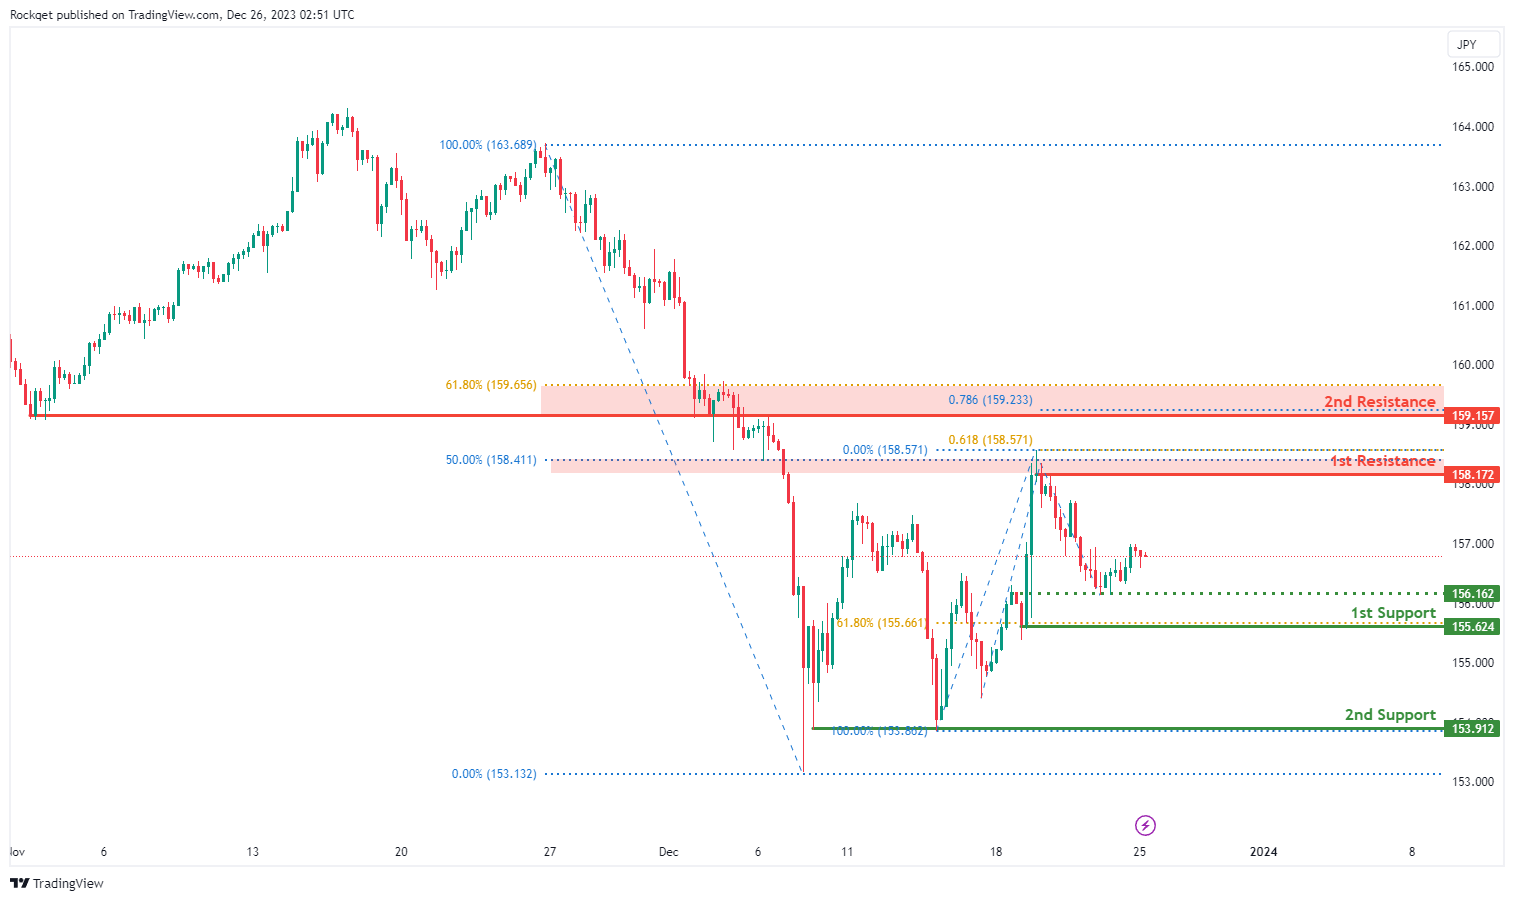
The EUR/JPY chart currently exhibits a bearish overall momentum, suggesting a potential scenario for a bearish continuation towards the 1st support.
The 1st support at 155.62 is identified as a pullback support and coincides with the 61.80% Fibonacci Retracement, indicating a historical area where buying interest has been present.
Additionally, the 2nd support at 153.91 is considered a multi-swing low support, providing an additional layer of potential support for the ongoing bearish trend.
On the resistance side, the 1st resistance at 158.17 is associated with a pullback resistance and aligns with the 61.80% Fibonacci Projection, highlighting a potential barrier where selling interest could intensify.
Furthermore, the 2nd resistance at 159.16 is linked to an overlap resistance and the 61.80% Fibonacci Retracement, adding extra layers of potential resistance for the price.
An intermediate support level at 156.62 is also identified, corresponding to an overlap support. This level may act as a potential area where buying interest could provide support for the price.
EUR/GBP:
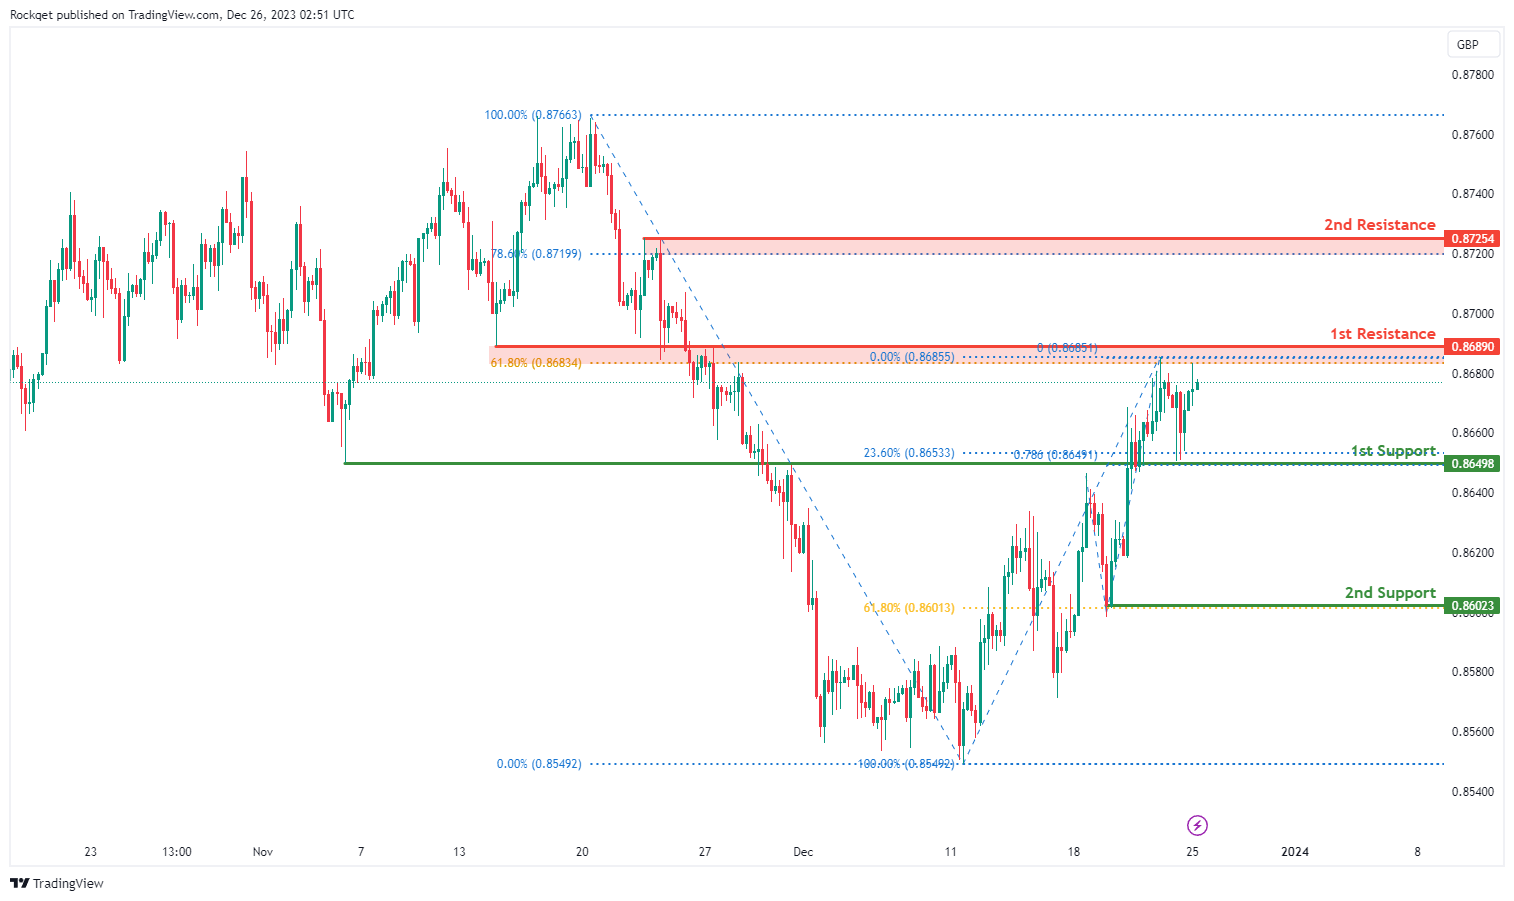
The EUR/GBP chart currently exhibits a bullish overall momentum, suggesting a potential scenario for a bullish continuation towards the 1st resistance.
The 1st support at 0.8650 is identified as an overlap support and coincides with the 23.60% Fibonacci Retracement, indicating a historical area where buying interest has been present.
Additionally, the 2nd support at 0.8602 is considered a pullback support, providing an additional layer of potential support for the ongoing bullish trend.
On the resistance side, the 1st resistance at 0.8689 is associated with an overlap resistance and the 61.80% Fibonacci Retracement, highlighting a potential area where selling interest could intensify.
Furthermore, the 2nd resistance at 0.8725 is linked to a pullback resistance and the 78.60% Fibonacci Retracement, adding extra layers of potential resistance for the price.
GBP/USD:
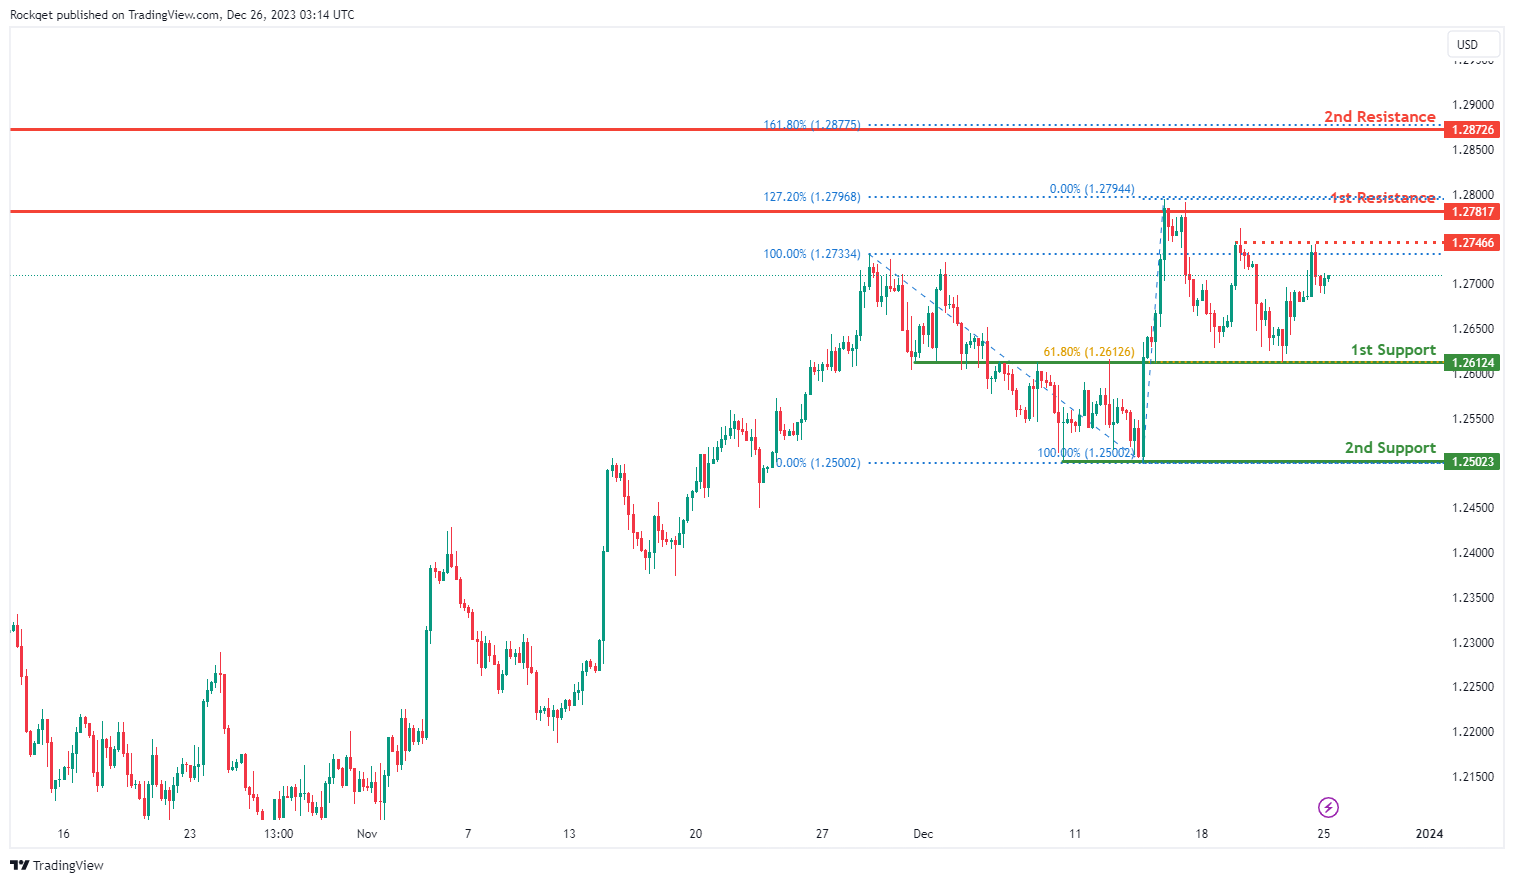
The GBP/USD chart currently exhibits a neutral bias. In this context, there is a potential scenario for price to fluctuate between the 1st support and the 1st resistance.
The 1st support level at 1.2612 is identified as an overlap support that aligns with the 61.80% Fibonacci retracement level. Further below, the 2nd support level at 1.2502 is marked as a swing-low support, further reinforcing its importance as a potential key support level.
To the upside, the intermediate resistance at 1.2746 is identified as a pullback support while the 1st resistance level at 1.2781 is identified as a multi-swing-high resistance that aligns with the 127.20% Fibonacci extension level. Higher up, the 2nd resistance level at 1.2872 is noted as a pullback resistance that aligns with the 161.80% Fibonacci extension level, suggesting a potential barrier for further upside movement.
GBP/JPY:
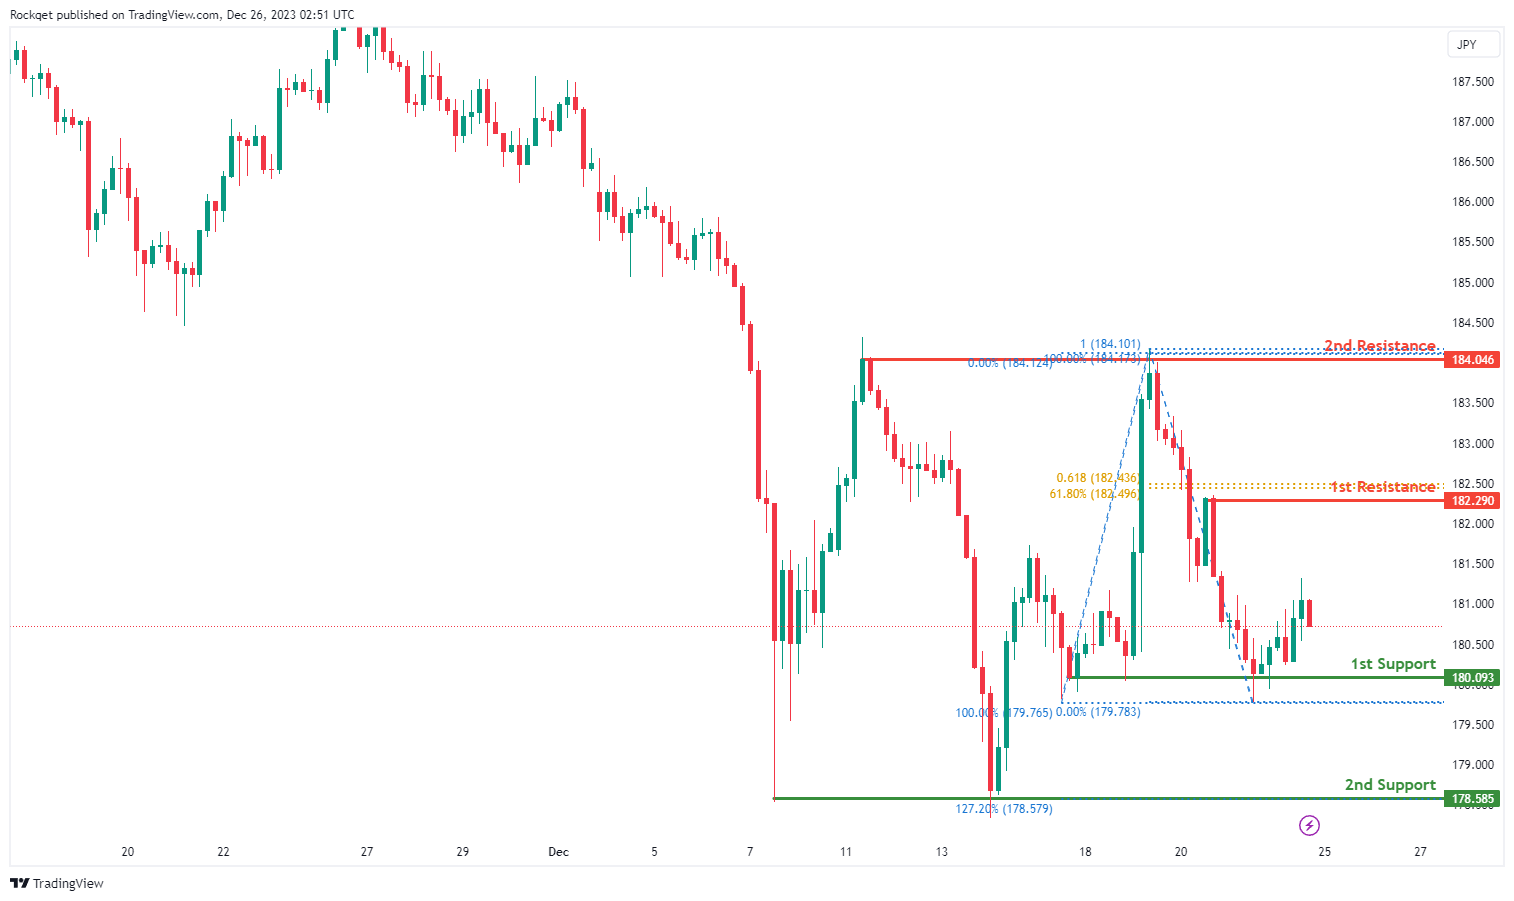
The GBP/JPY chart currently displays a bearish overall momentum, indicating a potential scenario for a bearish continuation towards the 1st support.
The 1st support at 180.09 is considered significant as it represents a multi-swing low support and aligns with a Fibonacci projection, indicating a historical area where buying interest has been present.
Additionally, the 2nd support at 178.59 is identified as another multi-swing low support and coincides with the 127.20% Fibonacci Extension, providing an additional layer of potential support for the ongoing bearish trend.
On the resistance side, the 1st resistance at 182.29 is associated with a pullback resistance, the 61.80% Fibonacci Projection, and the 61.80% Fibonacci Retracement, highlighting a potential area where selling interest could intensify.
Furthermore, the 2nd resistance at 184.05 is linked to a multi-swing high resistance, adding an extra layer of potential resistance for the price.
USD/CHF:
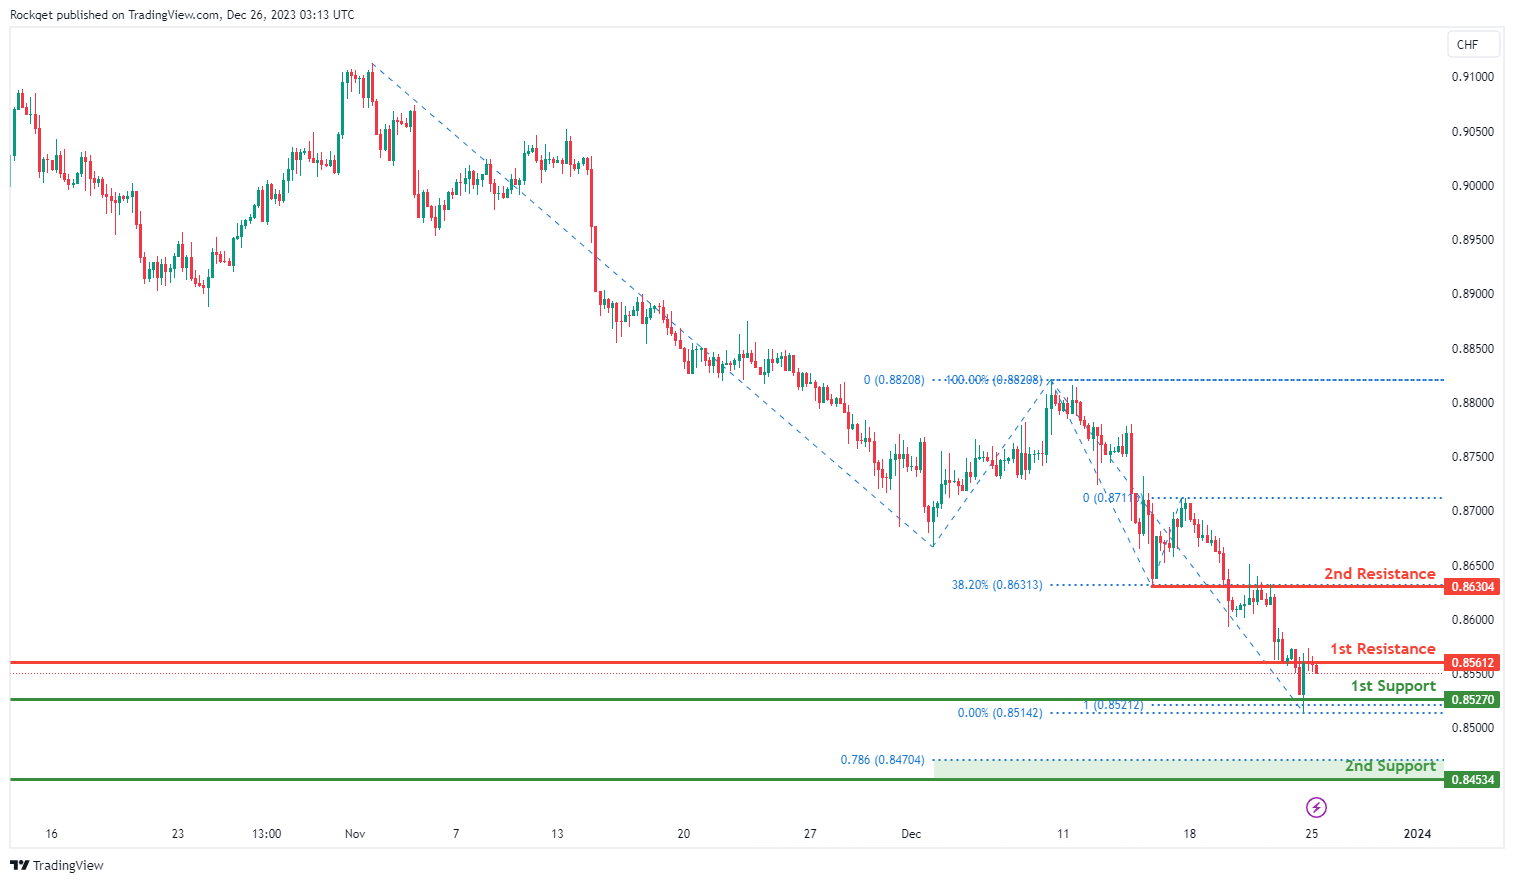
The USD/CHF chart currently exhibits an overall bearish momentum. In this context, there is a potential scenario for price to make a bearish continuation towards the 1st support.
The 1st support level at 0.8527 is marked as a multi-swing-low support that aligns with the 100.00% Fibonacci projection level. Further below, the 2nd support level at 0.8453 is noted as a swing-low support that aligns close to the 78.60% Fibonacci projection level, further reinforcing its importance as a key support level.
To the upside, the 1st resistance level at 0.8561 is identified as an overlap resistance. Higher up, the 2nd resistance level at 0.8630 is also marked as an overlap resistance that aligns with the 38.20% Fibonacci retracement level, suggesting a potential barrier for further upside movement.
USD/JPY:
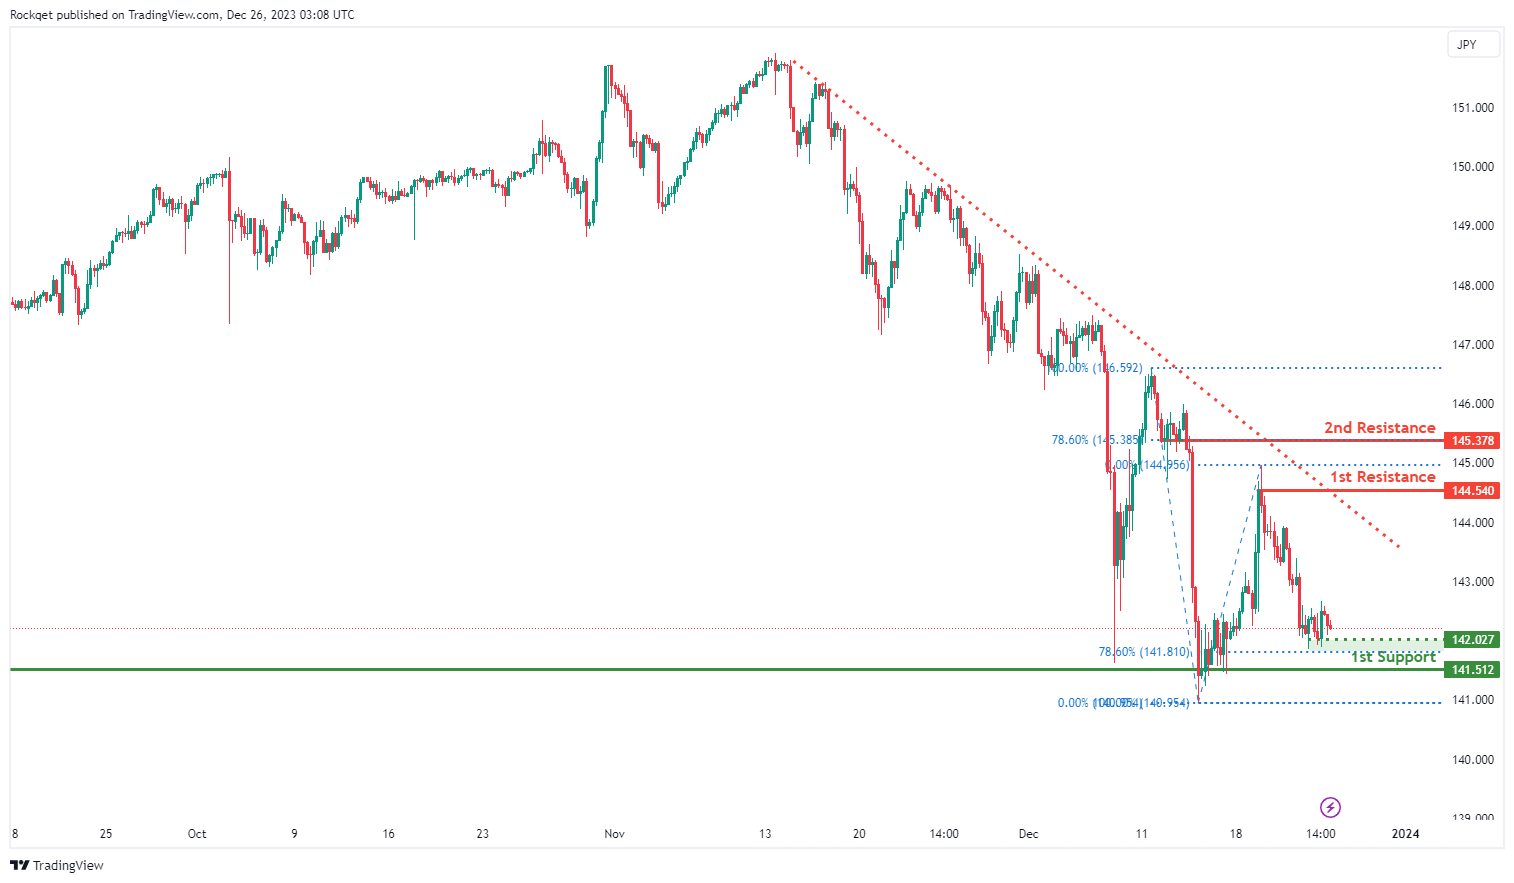
The USD/JPY chart currently exhibits an overall bearish momentum. In this context, there is a potential for price to break under the intermediate support and drop towards the 1st support.
The intermediate support level at 142.02 is identified as a pullback support that aligns close to the 78.60% Fibonacci retracement level. Further below, the 1st support level at 141.51 is noted as a multi-swing-low support, further reinforcing its importance as a key support level.
To the upside, the 1st resistance level at 144.54 is noted as a swing-high resistance. Higher up, the 2nd resistance level at 145.37 is marked as a pullback resistance that aligns with the 78.60% Fibonacci retracement level, suggesting a potential barrier for further upside movement.
USD/CAD:
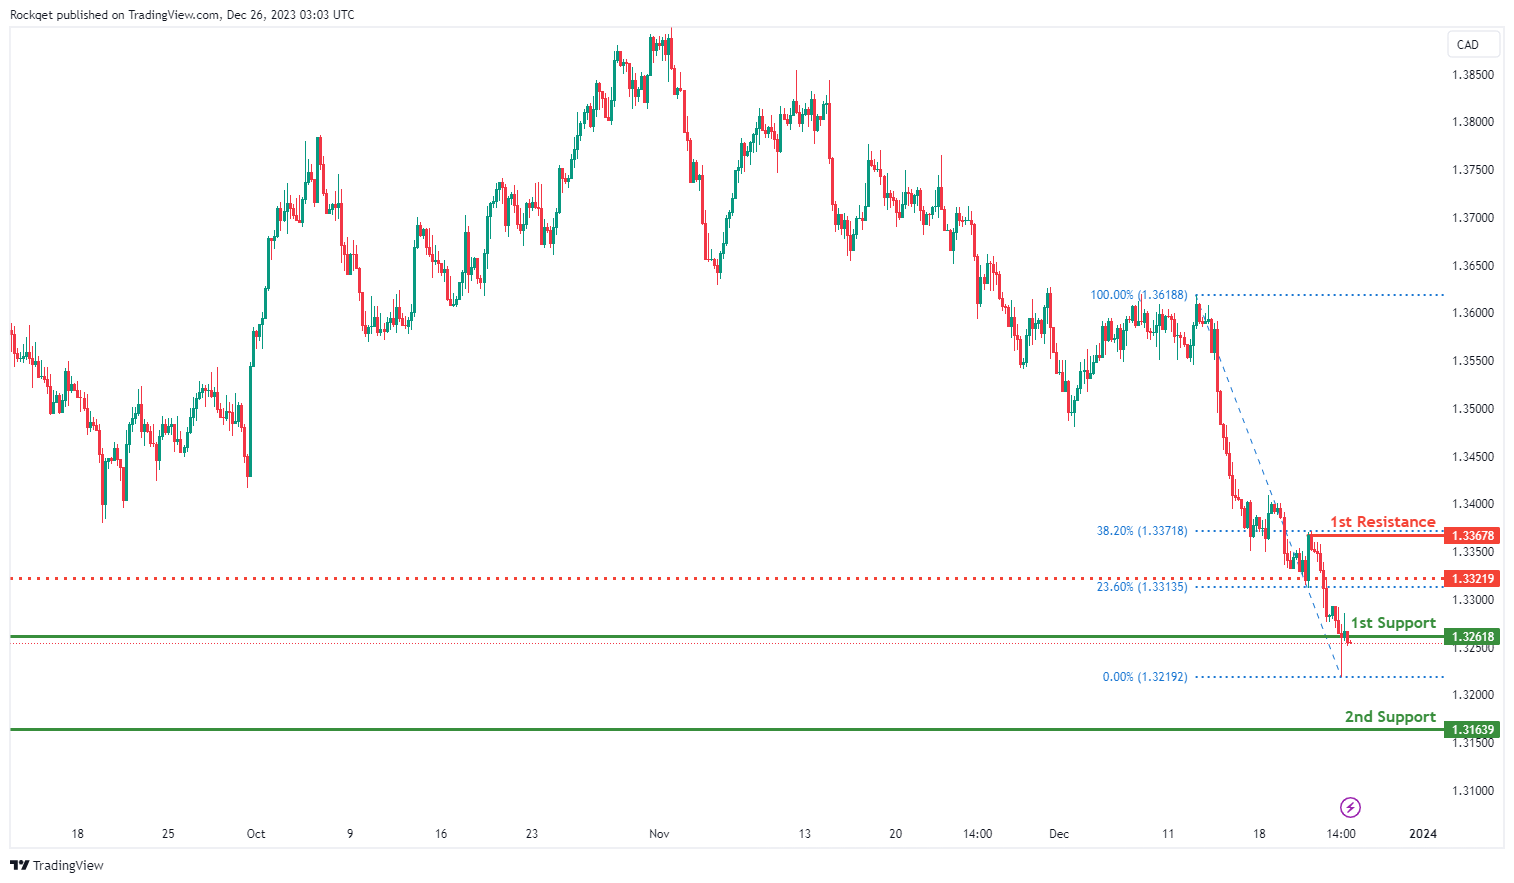
The USD/CAD chart currently exhibits an overall bearish momentum, indicating a potential for a break under the 1st support and drop towards the 2nd support.
The 1st support level at 1.3261 is identified as an overlap support. Further below, the 2nd support level at 1.3163 is noted as a multi-swing-low support, further reinforcing its importance as a key support level.
To the upside, the intermediate resistance level at 1.3321 is identified as a pullback resistance that aligns with the 23.60% Fibonacci retracement level. Higher up, the 1st resistance level at 1.3367 is also marked as a pullback resistance that aligns with the 38.20% Fibonacci retracement level, suggesting a potential barrier for further upside movement.
AUD/USD:
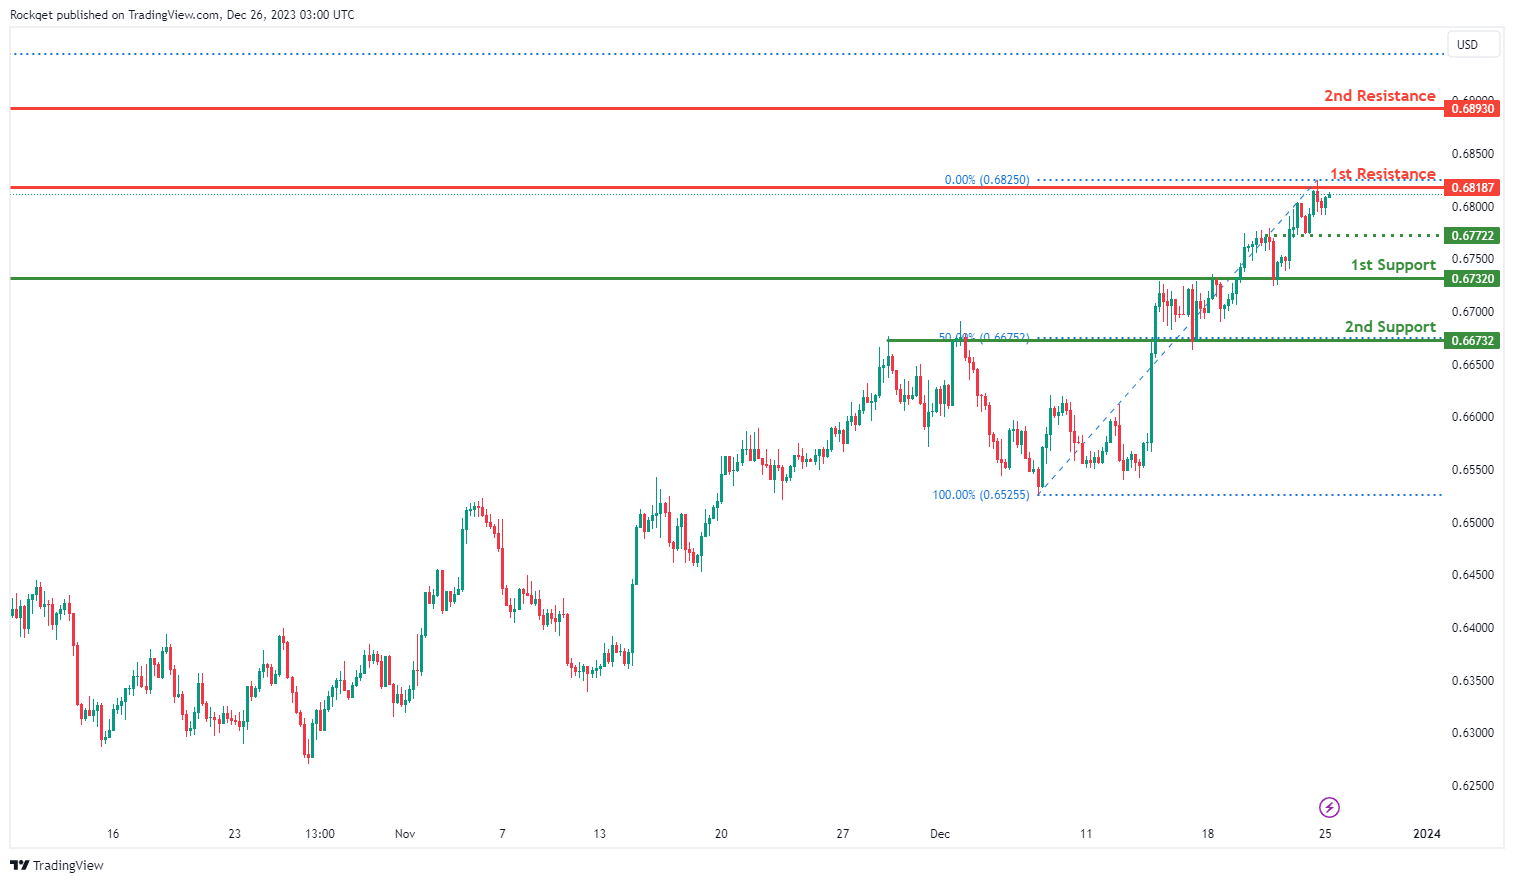
The AUD/USD chart currently exhibits an overall bullish momentum. However, there is a potential scenario for price to make a bearish reaction off the 1st resistance and drop towards the 1st support, especially if price breaks below the intermediate support.
The 1st resistance level at 0.6818 is identified as a swing-high resistance. Higher up, the 2nd resistance level at 0.6893 is noted as a multi-swing-high resistance, indicating its potential significance as a barrier for further upward movement.
To the downside, the intermediate support level at 0.6776 is identified as an overlap support while the 1st support level at 0.6732 is also noted as an overlap support. Further below, the 2nd support level at 0.6673 is also marked as an overlap support that aligns with the 50.00% Fibonacci retracement level, further reinforcing its importance as a key support level.
NZD/USD
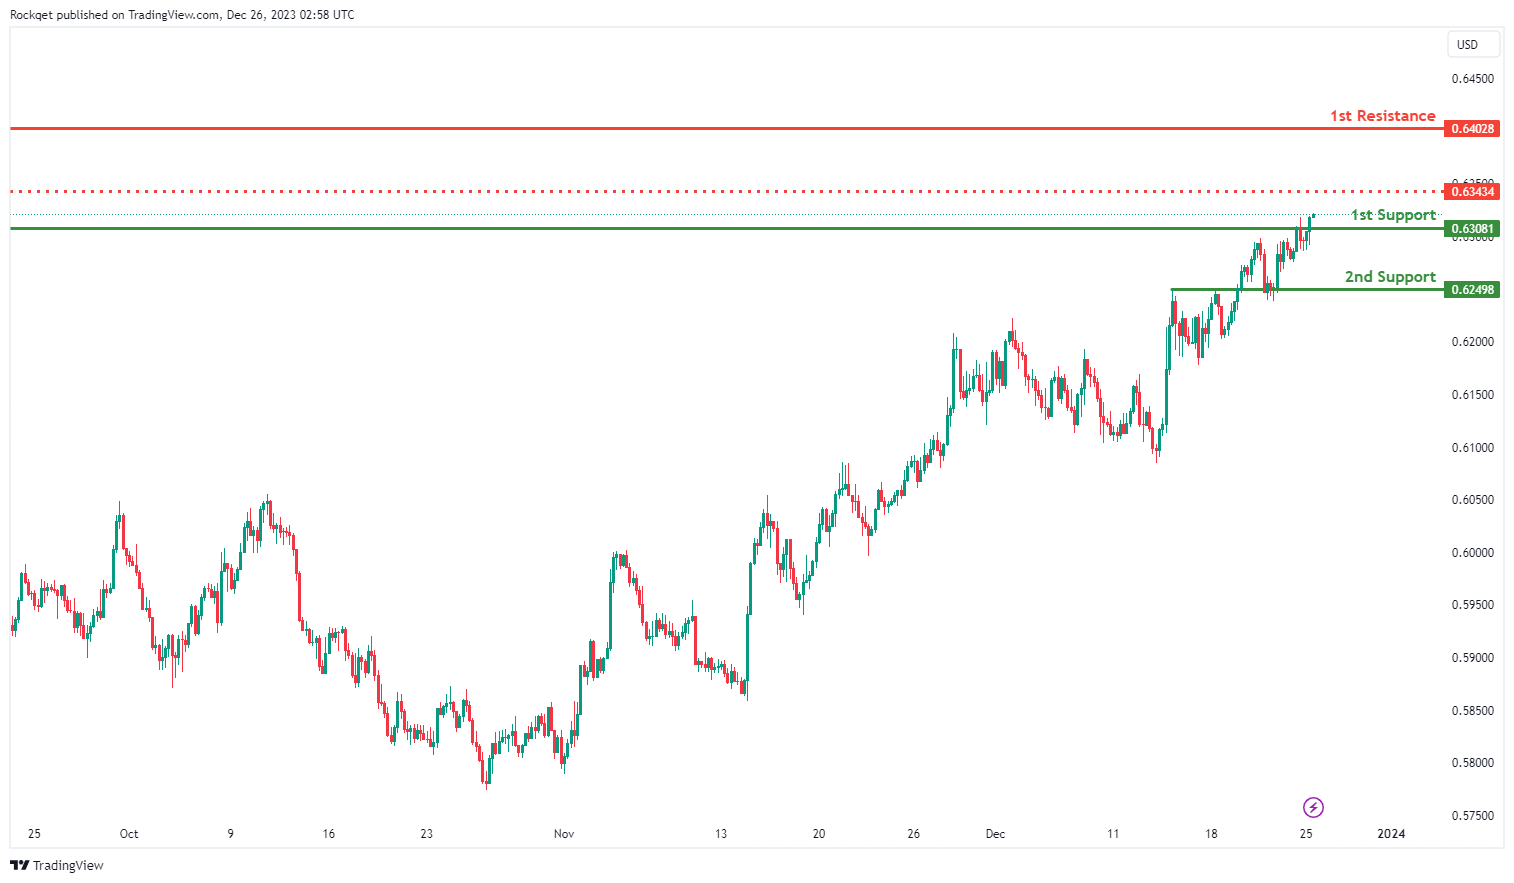
The NZD/USD chart currently exhibits an overall bullish momentum. In this context, there is a potential scenario for price to make a bullish continuation towards the 1st resistance.
The intermediate resistance level at 0.6343 is identified as a pullback resistance. Higher up, the 1st resistance level at 0.6402 is also marked as a swing-high resistance, indicating its potential significance as a barrier for further upward movement.
To the downside, the 1st support level at 0.6308 is identified as an overlap support. Further below, the 2nd support level at 0.6249 is also noted as an overlap support, further reinforcing its importance as a key support level.
DJ30:
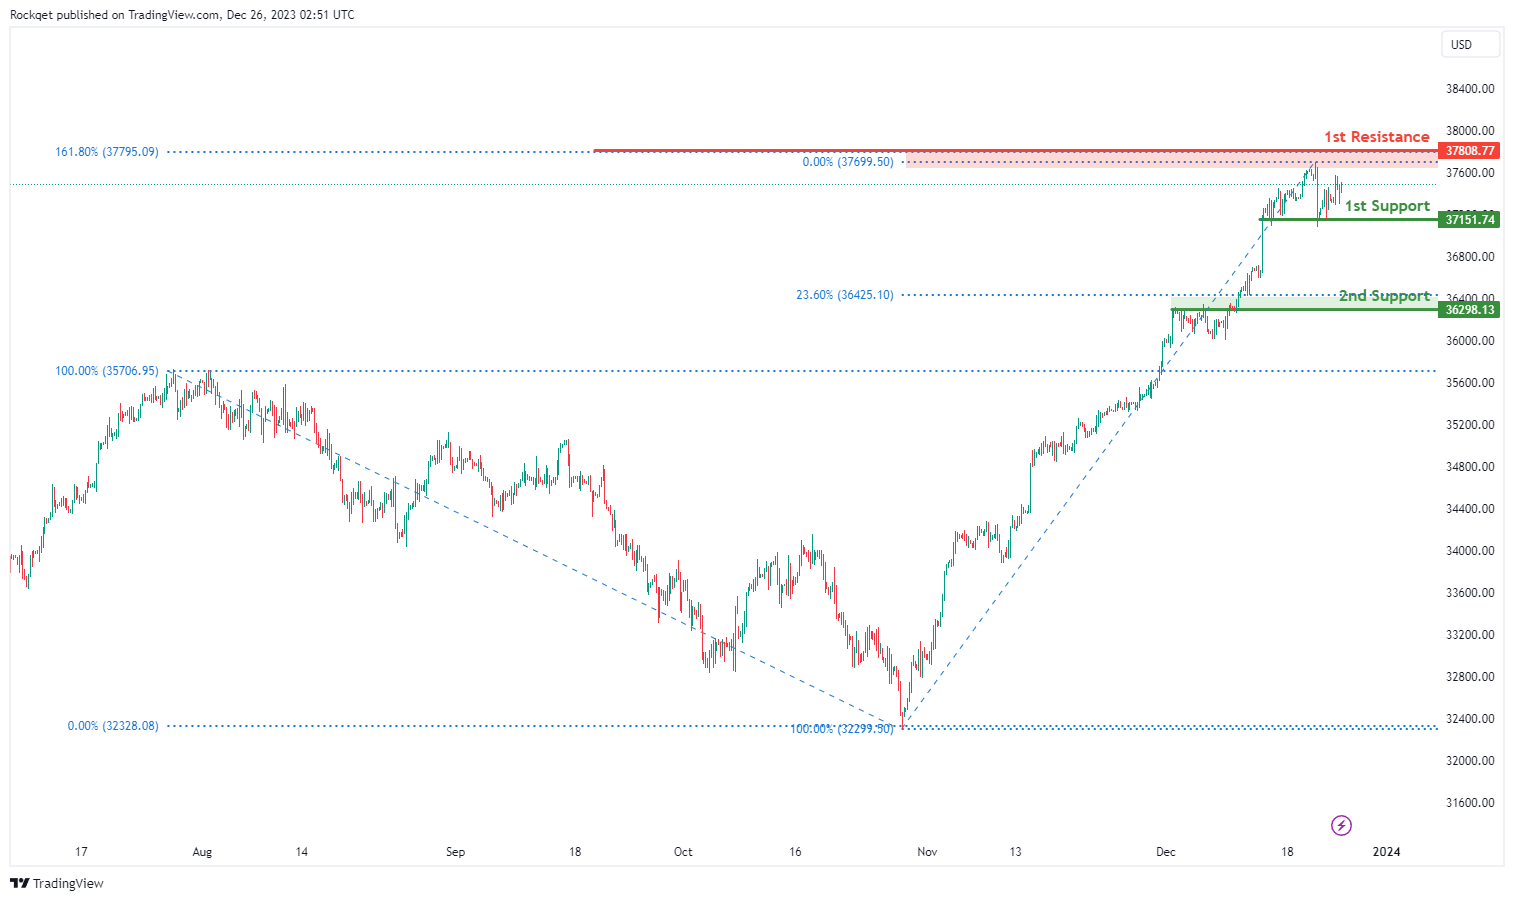
The DJ30 chart currently displays a bullish overall momentum, suggesting a potential scenario for a bullish continuation towards the 1st resistance.
The 1st support at 37151.74 is considered significant as it represents an overlap support, indicating a historical area where buying interest has been present.
Additionally, the 2nd support at 36298.13 is identified as another overlap support and is associated with the 23.60% Fibonacci Retracement, providing an additional layer of potential support for the ongoing bullish trend.
On the resistance side, the 1st resistance at 37808.77 is linked to the 161.80% Fibonacci Extension, indicating a level where buying interest could intensify. This level suggests a potential target for the bullish continuation.
GER40:
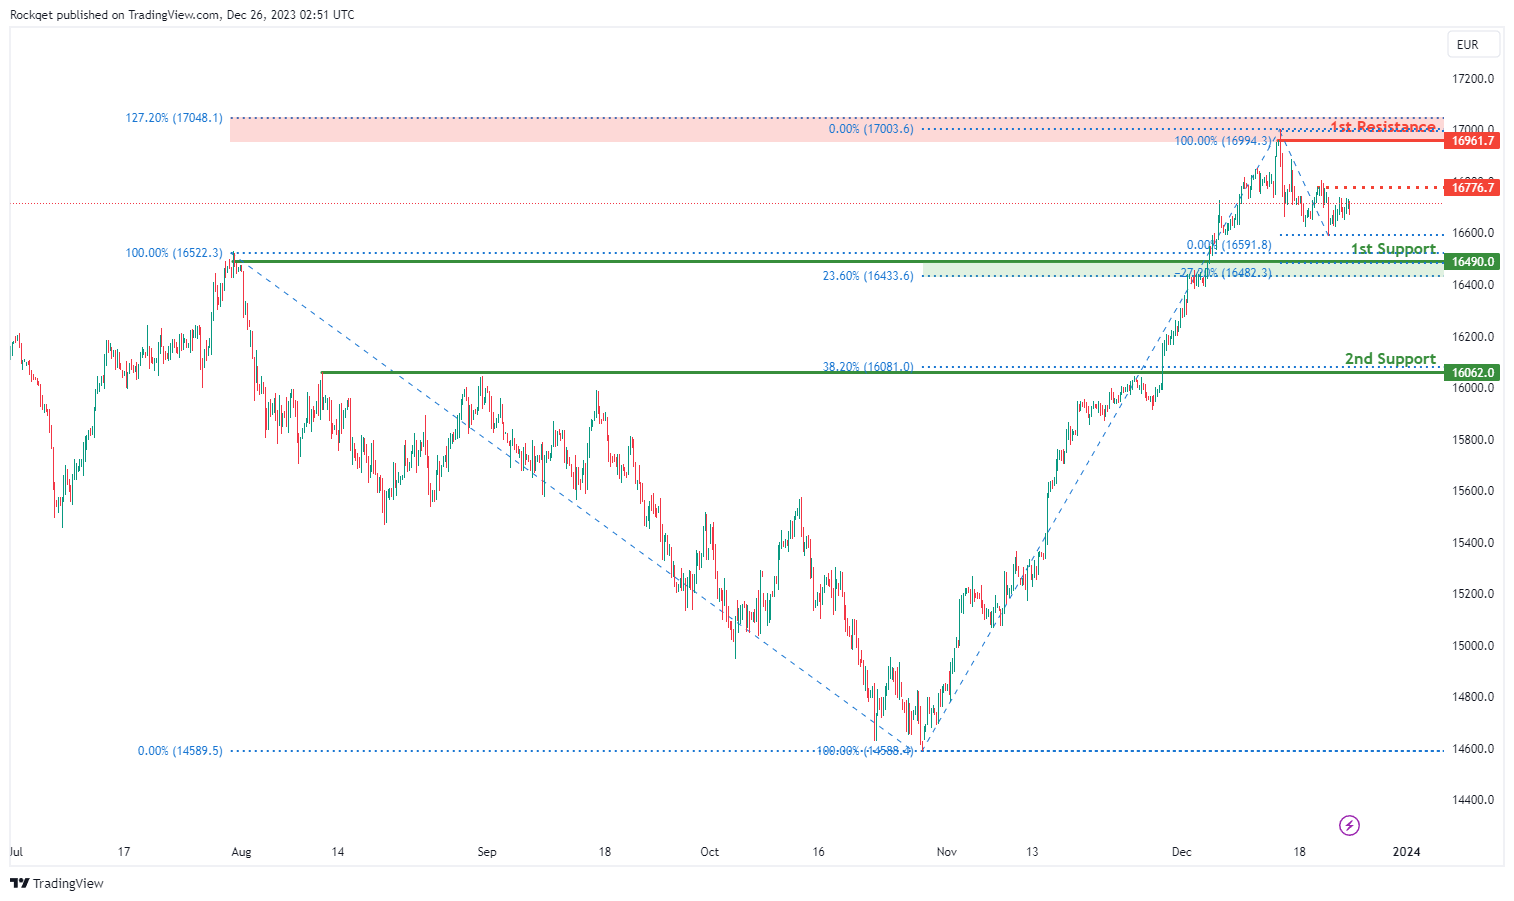
The GER40 chart currently exhibits a weak bearish momentum with low confidence, suggesting a potential scenario for a bearish continuation towards the 1st support.
The 1st support at 16490.00 is considered significant as it represents an overlap support, indicating a historical area where buying interest has been present.
Additionally, this support level coincides with the 23.60% Fibonacci Retracement and the -27% Fibonacci Expansion, providing multiple layers of potential support for the ongoing bearish trend.
The 2nd support at 16062.00 is identified as a pullback support and is associated with the 38.20% Fibonacci Retracement, adding an extra layer of potential support for the anticipated bearish movement.
On the resistance side, the 1st resistance at 16961.70 is linked to the swing high resistance and the 127.20% Fibonacci Extension, indicating a level where selling interest could intensify and potentially halt or reverse the bearish trend.
US500:
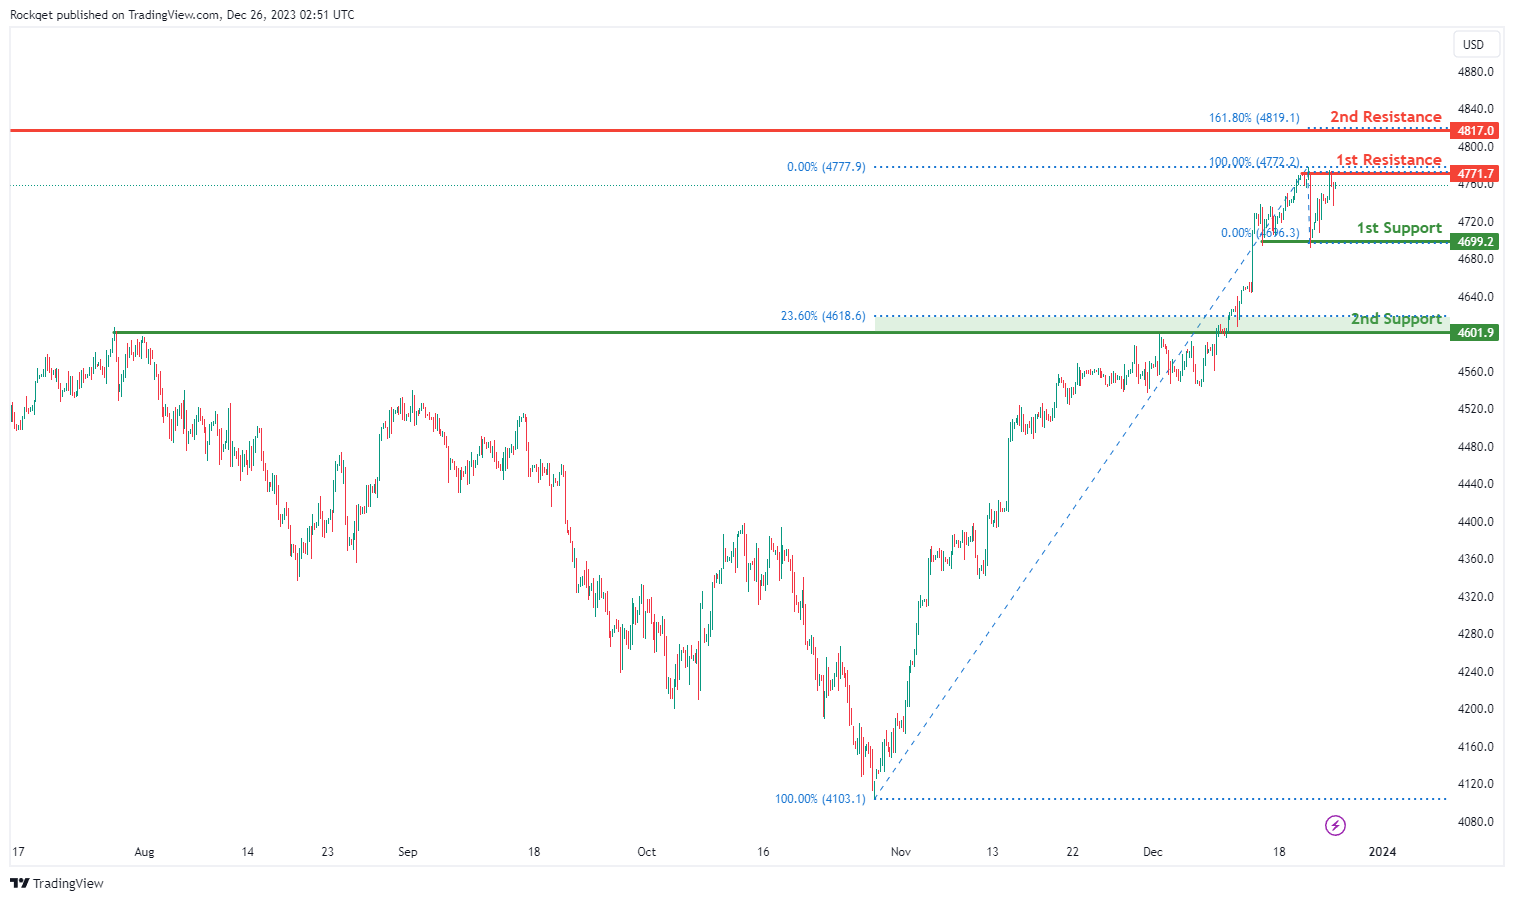
The US500 chart currently demonstrates a bullish overall momentum, supported by various factors contributing to the upward movement.The price could potentially continue its bullish trend towards the 1st resistance.
The 1st support at 4699.2 is considered strong, representing a multi-swing low support level.
Additionally, the 2nd support at 4601.9 is identified as an overlap support, coinciding with the 23.60% Fibonacci Retracement, providing a solid foundation for potential price bounces.
On the resistance side, the 1st resistance at 4771.7 is associated with a swing high resistance, indicating a level where selling interest might increase, potentially causing a temporary pause or reversal in the bullish trend.
Furthermore, the 2nd resistance at 4817.0 is linked to a swing high resistance and the 161.80% Fibonacci Extension, highlighting a potential challenge for the price to surpass these levels.
BTC/USD:
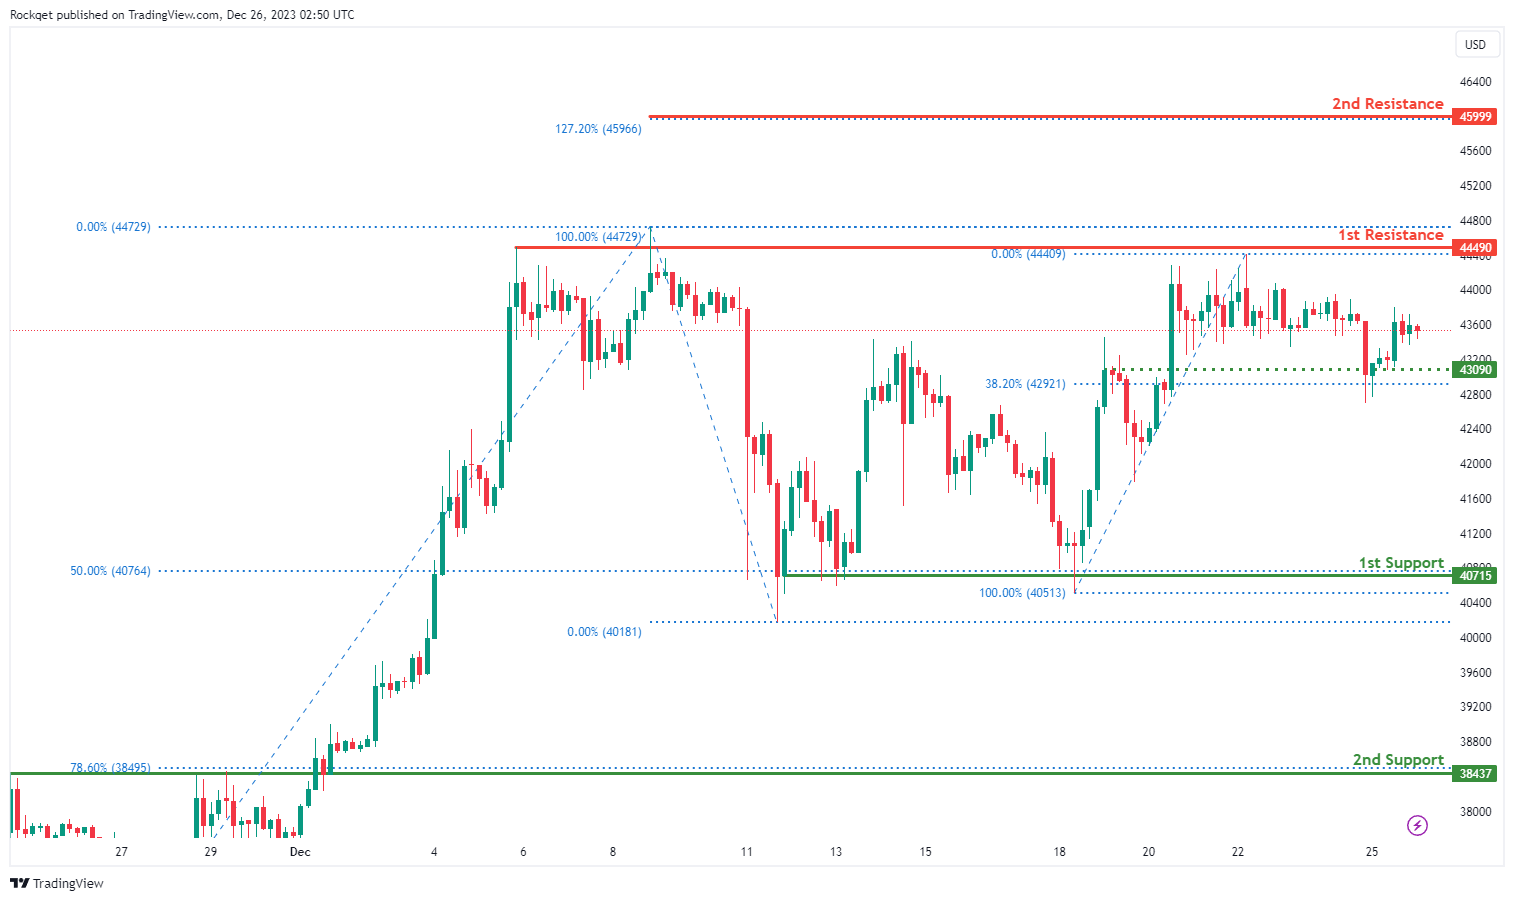
The BTC/USD chart currently reflects a neutral overall momentum, suggesting a potential scenario for price fluctuation between the 1st resistance and 1st support levels.
The 1st support at 40715 is identified as a swing low support and coincides with the 50% Fibonacci Retracement, making it a significant level where historical buying interest has been present.
Additionally, the 2nd support at 38437 is considered an overlap support, providing an extra layer of potential support for the cryptocurrency. This level aligns with the 78.60% Fibonacci Retracement, adding further significance to this support zone.
In terms of intermediate support, the level at 43090 is identified as an overlap support and coincides with the 38.20% Fibonacci Retracement, providing an additional layer of potential support during price fluctuations.
On the resistance side, the 1st resistance at 44490 is associated with a swing high resistance and marks a level where selling interest may intensify, potentially causing a temporary halt or reversal in price.
Furthermore, the 2nd resistance at 45999 is linked to the 127.20% Fibonacci Extension, presenting a formidable challenge for the price to surpass.
ETH/USD:
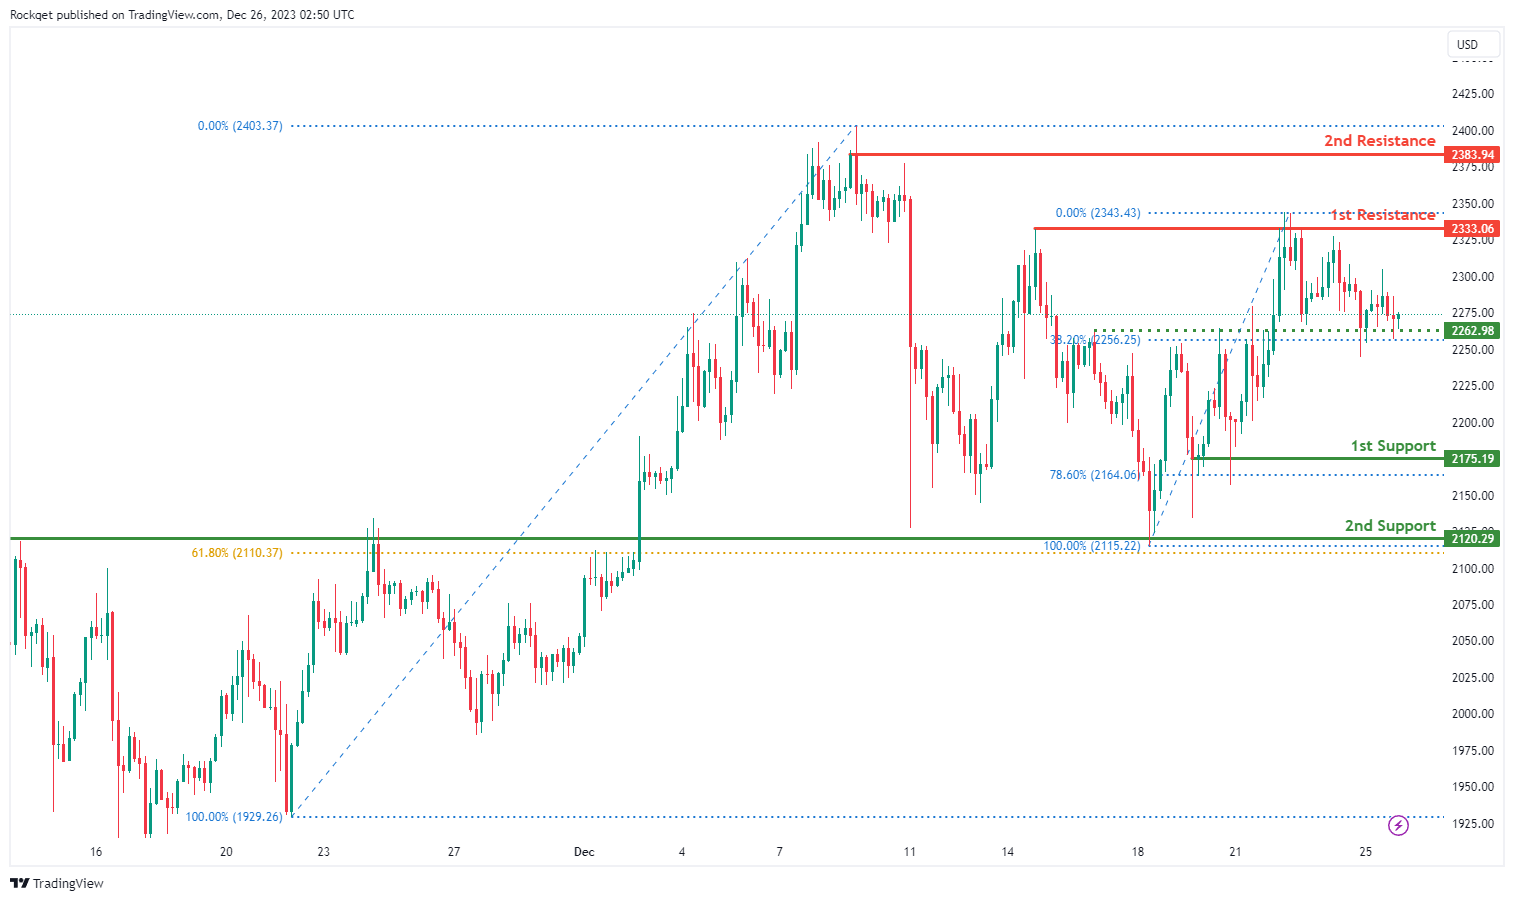
The ETH/USD chart currently demonstrates a bullish overall momentum, suggesting a potential scenario for a bullish continuation towards the 1st resistance.
The 1st support at 2175.19 is identified as a pullback support, representing a historical area where buying interest has been present. This level also coincides with the 78.60% Fibonacci Retracement, adding significance to the support zone.
Additionally, the 2nd support at 2120.29 is recognized as a swing low support and is associated with the 61.80% Fibonacci Retracement, providing an extra layer of potential support for the cryptocurrency.
In terms of intermediate support, the level at 2262.98 is considered an overlap support and aligns with the 38.20% Fibonacci Retracement, providing an additional layer of potential support during price fluctuations.
On the resistance side, the 1st resistance at 2333.06 is linked to a swing high resistance, indicating a level where selling interest may intensify, potentially causing a temporary pause or reversal in the bullish trend.
Furthermore, the 2nd resistance at 2383.94 is another swing high resistance, presenting a formidable challenge for the price to overcome.
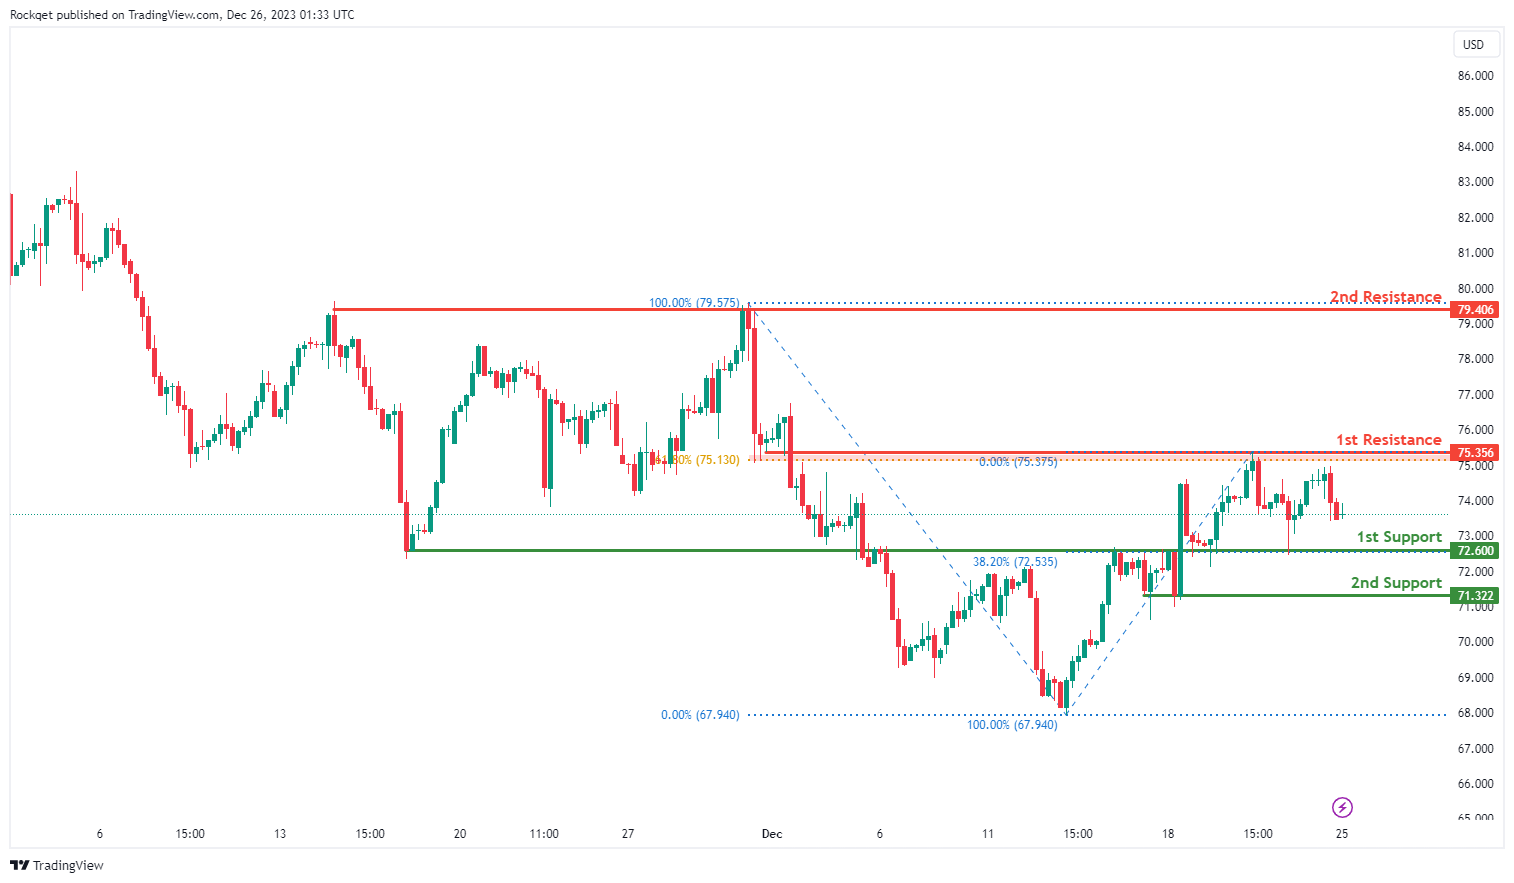
WTI/USD:
The WTI chart currently exhibits an overall bullish momentum, suggesting a prevailing uptrend. However, there is a potential scenario for price to fall towards the 1st support.
The 1st support level at 72.60 is identified as an overlap support that aligns with the 38.20% Fibonacci retracement level. Further below, the 2nd support level at 71.32 is marked as a pullback support, reinforcing its importance as a key support level.
To the upside, the 1st resistance level at 75.35 is identified as an overlap resistance that aligns close to the 61.80% Fibonacci retracement level. Higher up, the 2nd resistance level at 79.40 is noted as a multi-swing-high resistance, further indicating its potential significance as a barrier for further upward movement.
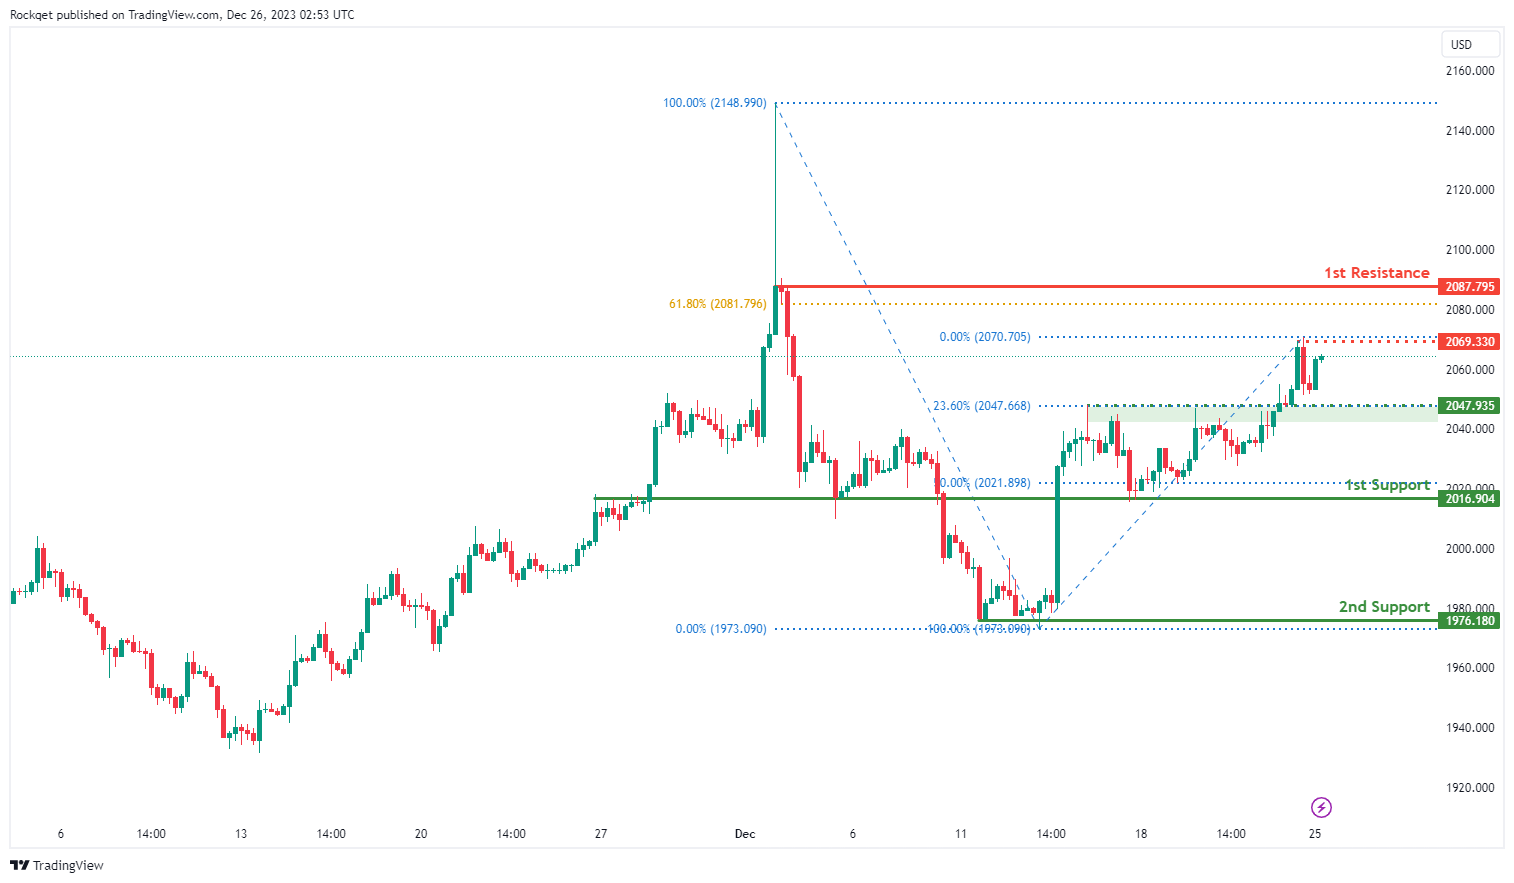
XAU/USD (GOLD):
The XAU/USD chart currently demonstrates a bullish momentum, indicating a potential for price to break above the intermediate resistance and make a bullish continuation towards the 1st resistance.
The intermediate resistance level at 2,069.33 is identified as a pullback resistance. Higher up, the 1st resistance level at 2,087.79 is also marked as a pullback resistance that aligns close to the 61.80% Fibonacci retracement level, further indicating its potential significance as a barrier for further upward movement.
To the downside, the intermediate support level at 2,047.93 is identified as a pullback support that aligns with the 23.60% Fibonacci retracement level while the 1st support level at 2,016.90 is marked as an overlap support that aligns close to the 50.00% Fibonacci retracement level. Further below, the 2nd support level at 1,976.18 is noted as a pullback support, reinforcing its importance as a key support level.


