
DXY:
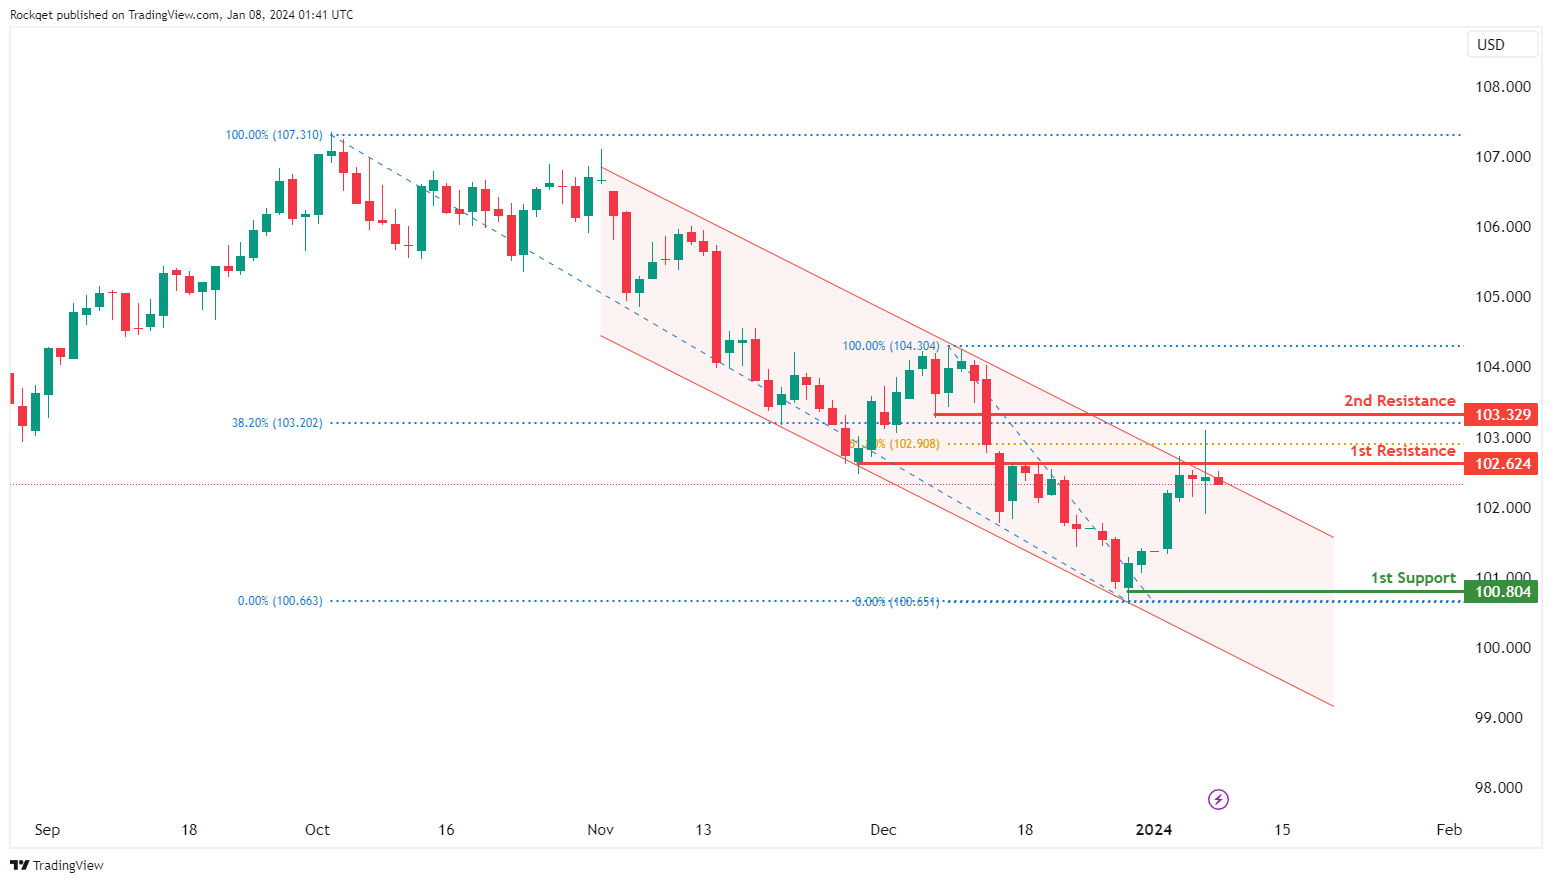
The DXY (US Dollar Index) chart currently exhibits a bearish overall momentum, and this is supported by the fact that the price is contained within a bearish descending channel. This suggests weakness in the US Dollar. In the short term, there’s a potential for a bearish continuation towards the 1st support level.
The 1st support at 100.80 is categorized as a swing low support. This level is significant as it has previously acted as a point where buying interest emerged, potentially providing temporary support for the DXY.
On the resistance side, the 1st resistance at 102.62 is identified as an overlap resistance. This level may serve as a substantial barrier where selling interest could intensify, potentially causing a bearish reversal or a pause in the downtrend.
The 2nd resistance at 103.32 is noted as a pullback resistance. It signifies a point where sellers may re-enter the market after a pullback, adding to its significance as a potential resistance zone.
EUR/USD:
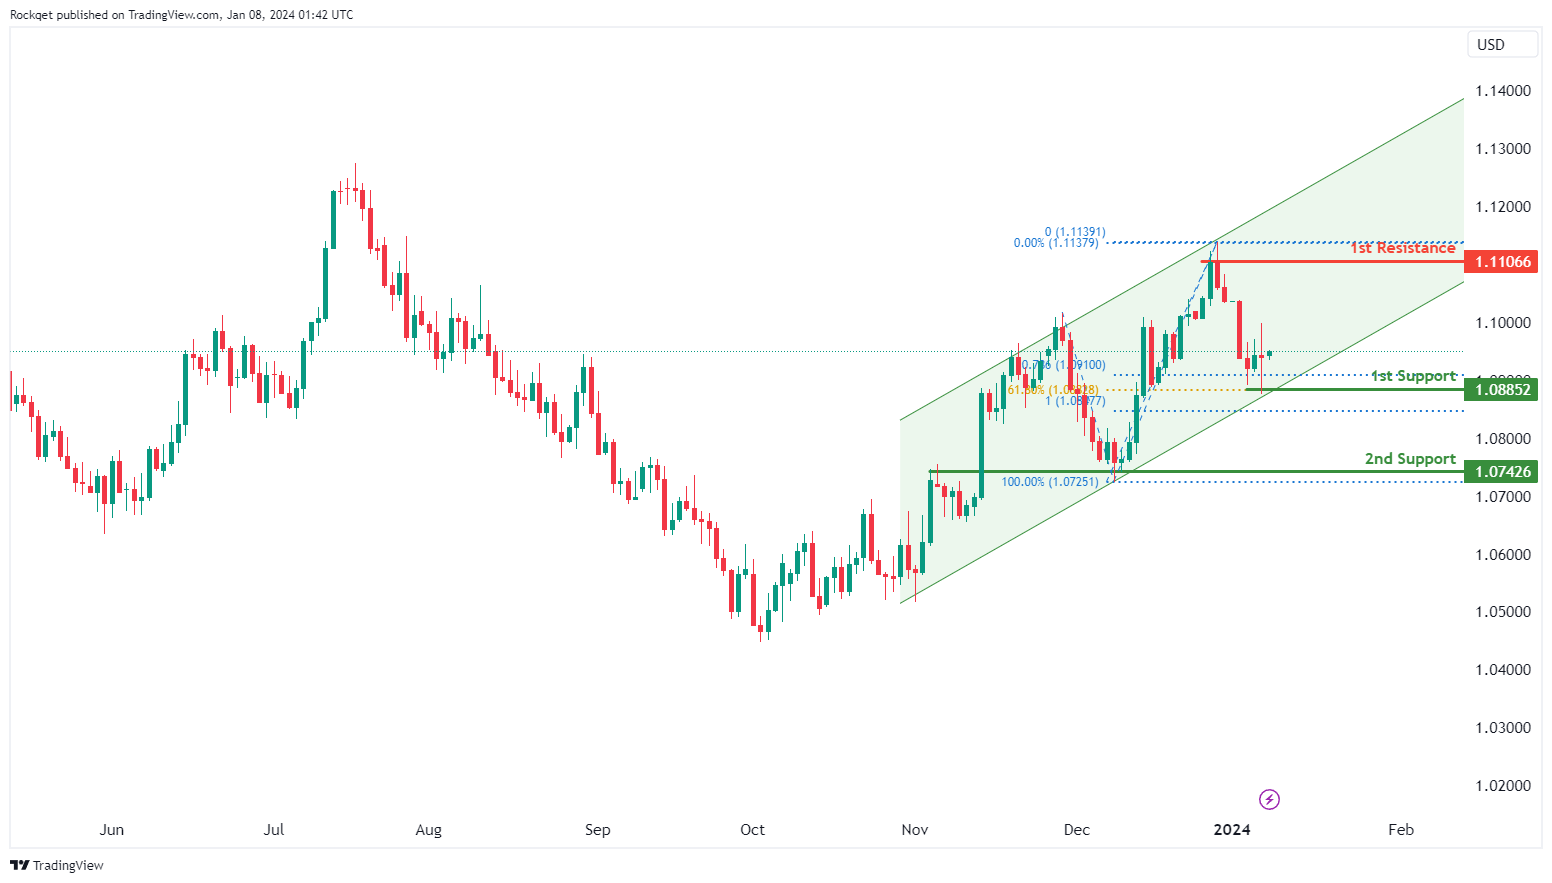
The EUR/USD chart currently exhibits a bullish overall momentum, suggesting strength in the Euro against the US Dollar.
Price could potentially continue its bullish movement towards the 1st resistance level.
The 1st support at 1.0879 is categorized as an overlap support and is associated with the 61.80% Fibonacci Retracement level. This level may act as a significant area where buying interest could emerge, providing temporary support for the EUR/USD.
The 2nd support at 1.0747 is identified as an overlap support, further reinforcing its significance as a potential support zone.
On the resistance side, the 1st resistance at 1.1006 is categorized as a pullback resistance. This level may act as a substantial barrier where selling interest could intensify, potentially slowing down the bullish movement in the short term.
The 2nd resistance at 1.1130 is noted as a swing high resistance. Swing highs often mark points of reversal or resistance in price movement and could pose a significant obstacle to further upward movement in the EUR/USD.
EUR/JPY:
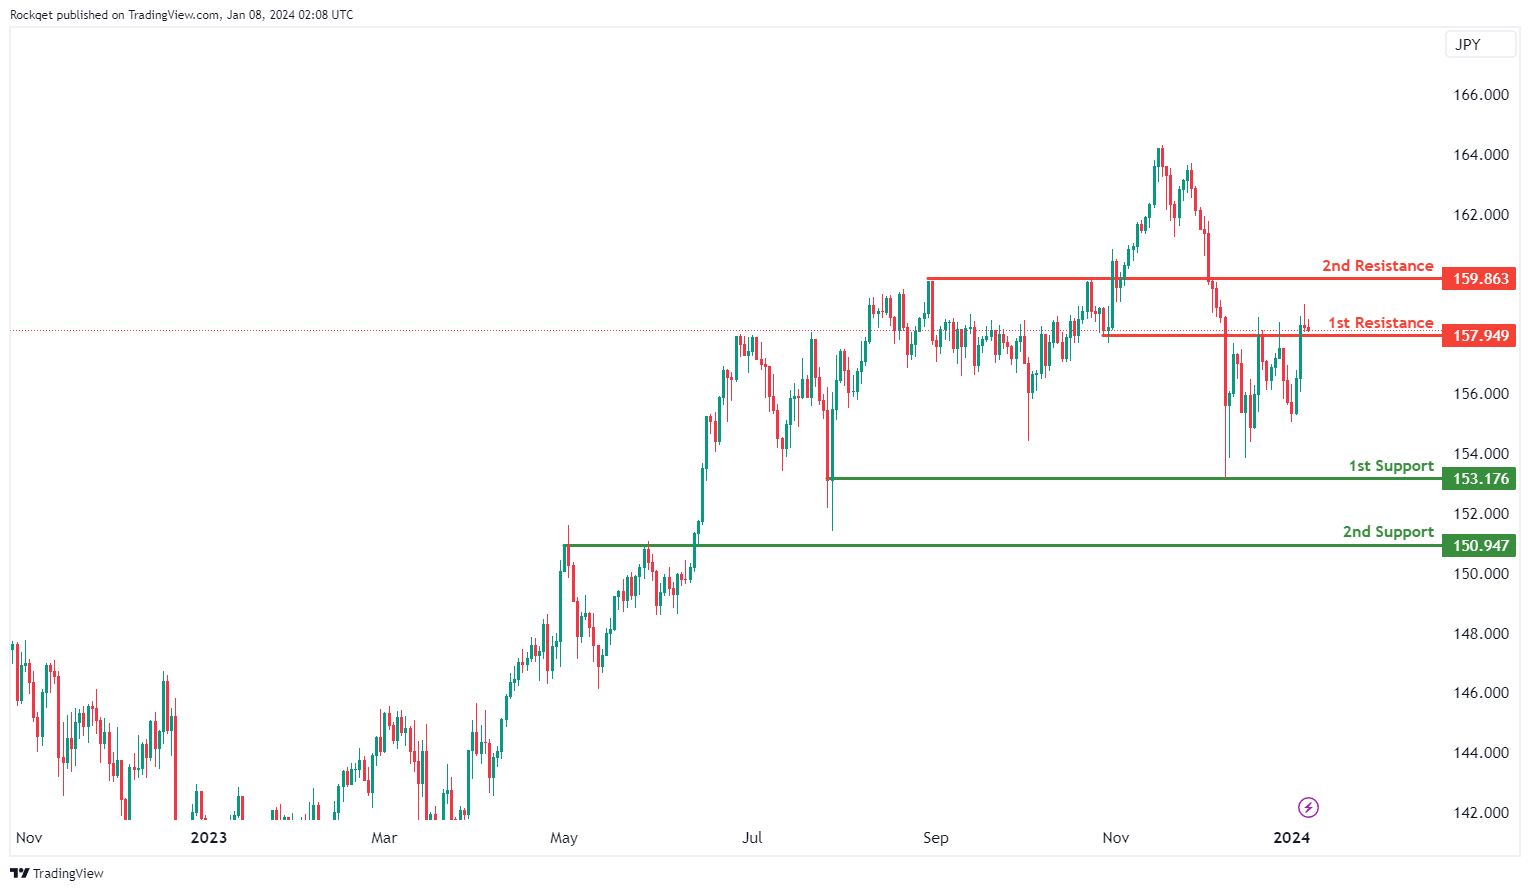
The EUR/JPY chart currently exhibits a bullish overall momentum, indicating an upward trend. There is a potential scenario for a bullish bounce off the 1st support, heading towards the 1st resistance.
The 1st support at 153.18 is considered favourable due to its identification as a multi-swing low support, indicating a historical level where buying interest has previously emerged.
The 2nd support at 150.95 is recognized as an overlap support, adding confluence to its potential as a support level.
On the resistance side, the 1st resistance at 157.95 is identified as an overlap resistance, suggesting historical significance as a level where selling interest may materialise.
The 2nd resistance at 159.86 is also noted as an overlap resistance, adding further significance to this potential barrier for upward movement.
EUR/GBP:
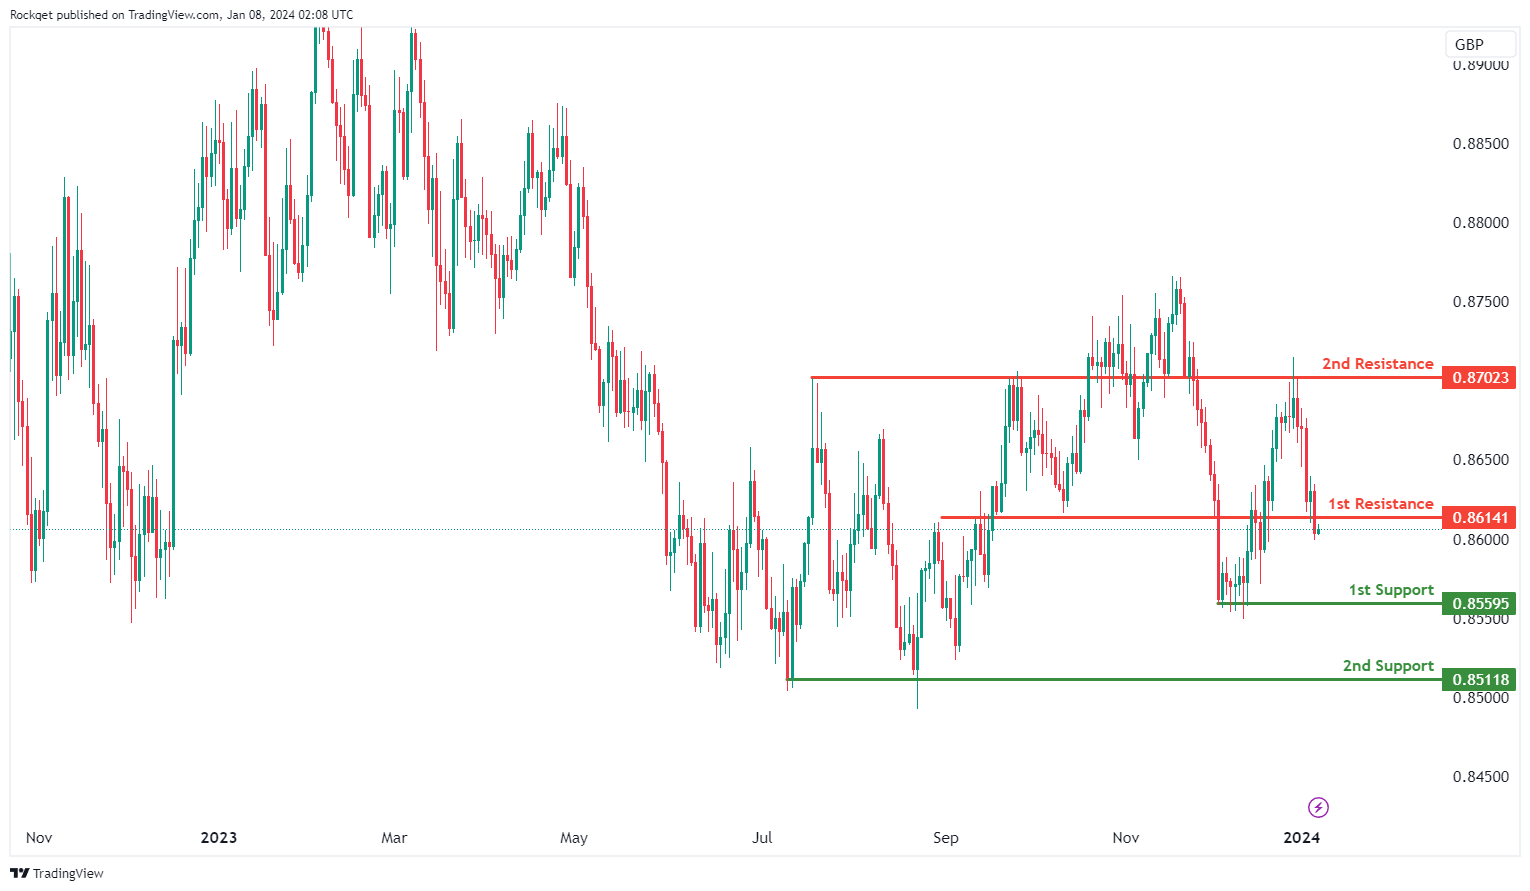
The EUR/GBP chart currently reflects a bearish overall momentum, indicating a downward trend. There is a potential scenario for a bearish reaction off the 1st resistance, leading to a drop towards the 1st support.
The 1st support at 0.8560 is considered favourable as it is identified as a multi-swing low support, indicating historical significance as a level where buying interest has previously emerged.
The 2nd support at 0.8512 is also recognized as a multi-swing low support, adding confluence to its potential as a support level.
On the resistance side, the 1st resistance at 0.8614 is identified as an overlap resistance, suggesting historical significance as a level where selling interest may materialise.
The 2nd resistance at 0.8702 is also noted as an overlap resistance, adding further significance to this potential barrier for upward movement.
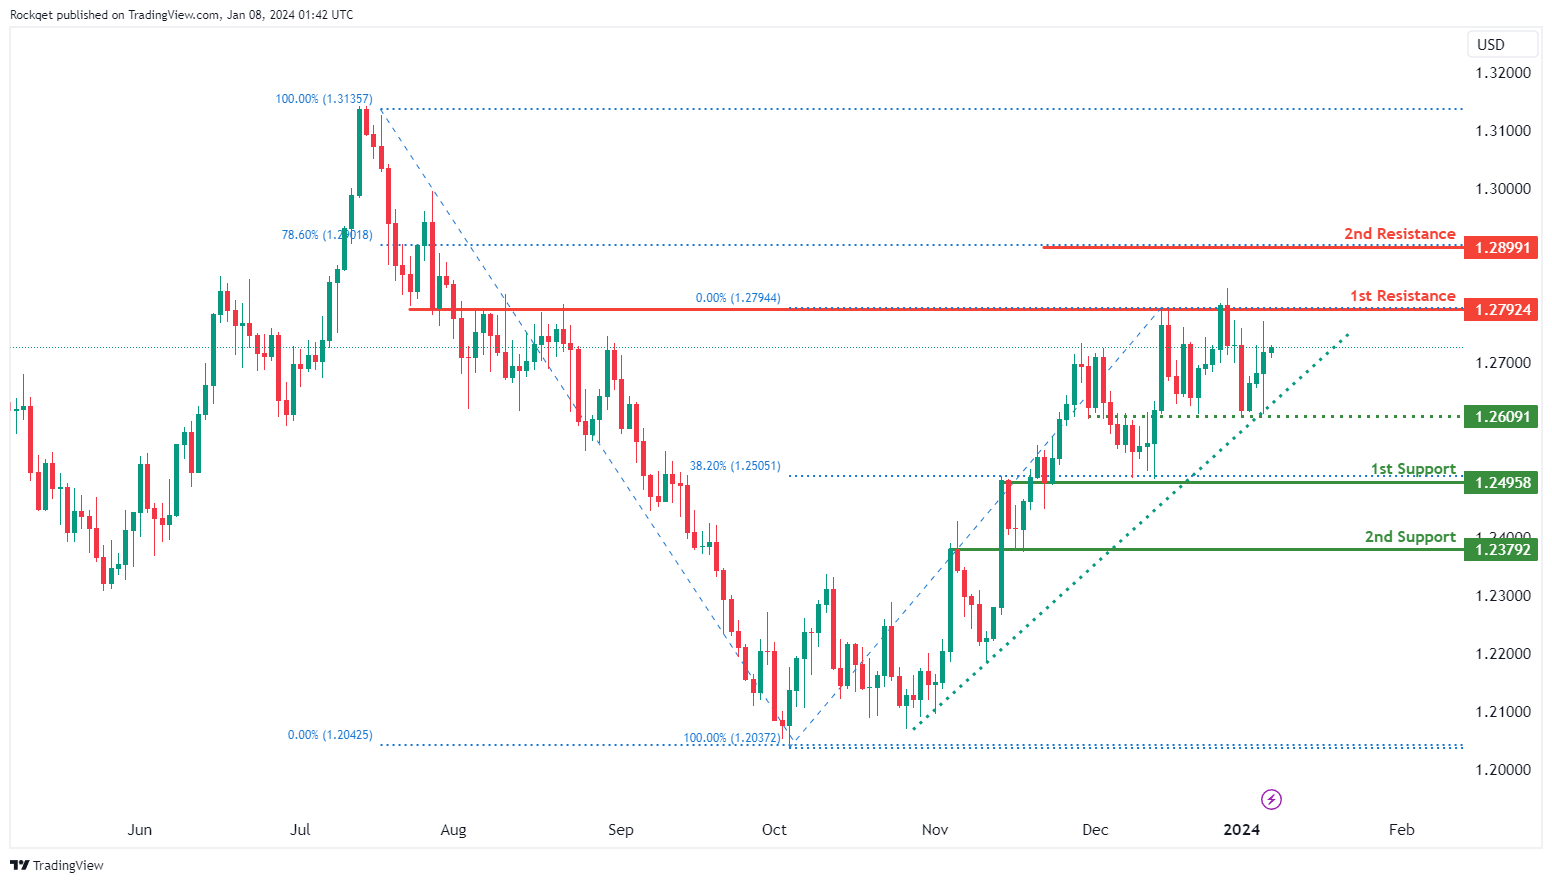
GBP/USD:
The GBP/USD chart currently demonstrates a bullish overall momentum, indicating strength in the British Pound relative to the US Dollar. This bullish momentum is further supported by the presence of a major ascending trendline, suggesting the potential for continued upward movement.
The 1st support level at 1.2495 is significant for several reasons. Firstly, it is identified as an overlap support and it aligns with the 38.20% Fibonacci Retracement level,
The 2nd support at 1.2379 is categorized as an overlap support, further reinforcing its significance as a potential area where buying interest may emerge.
On the resistance side, the 1st resistance at 1.2792 is classified as an overlap resistance, and it could act as a notable barrier where selling interest may intensify.
The 2nd resistance at 1.2899 stands out for aligning with the 78.60% Fibonacci Retracement level, indicating a strong potential resistance zone within the prevailing bullish trend.
Intermediate support at 1.2609 is identified as an overlap support, contributing to the potential support regions within the ascending trend.
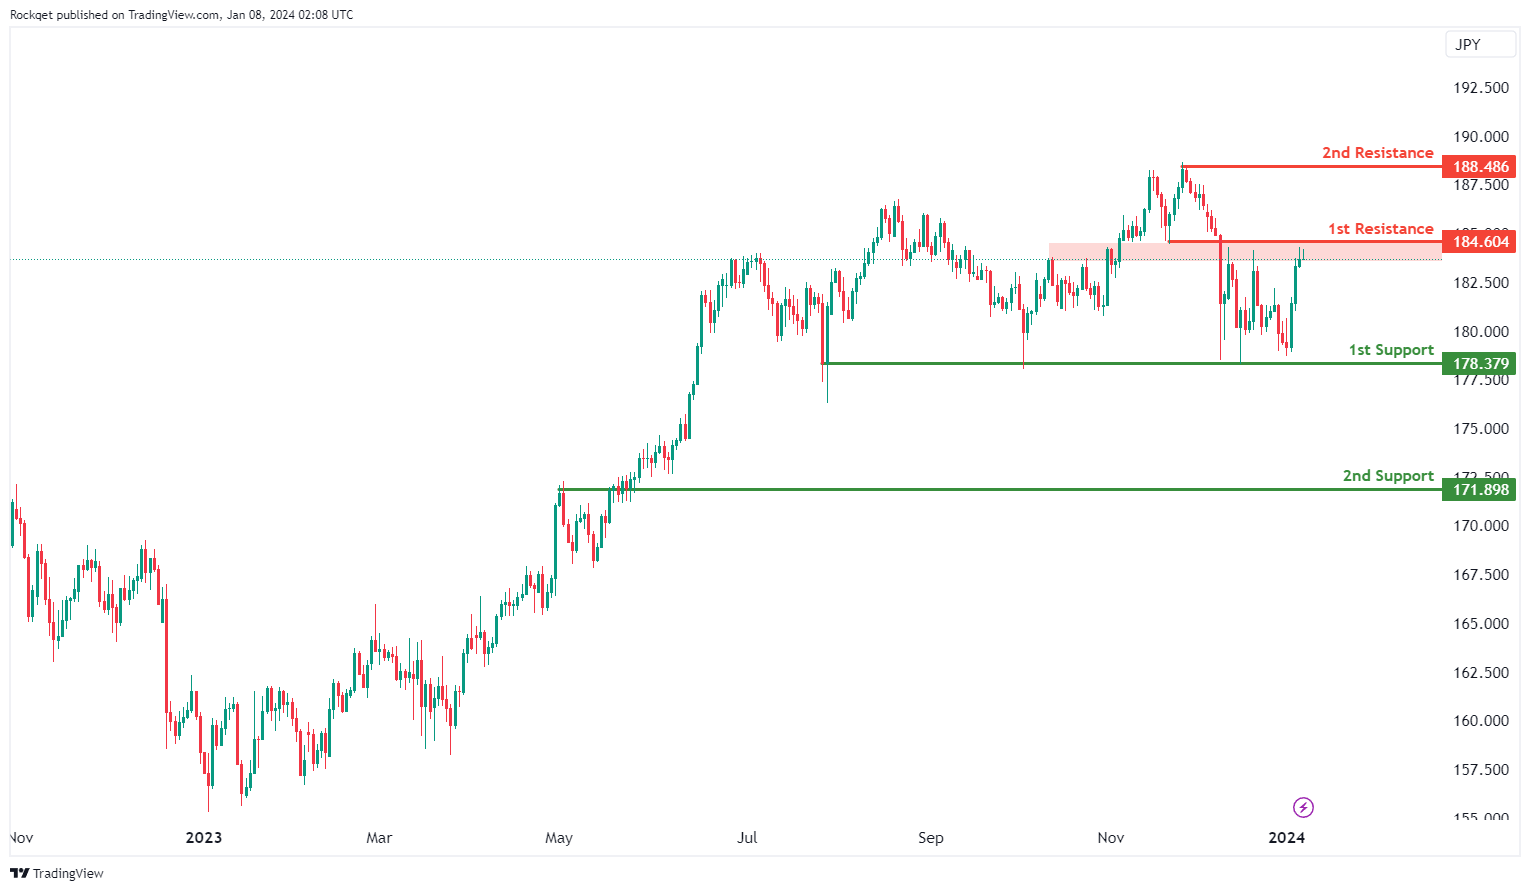
GBP/JPY:
The GBP/JPY chart currently exhibits a bullish overall momentum, suggesting an upward trend. There is a potential scenario for a bullish continuation towards the 1st resistance.
The 1st support at 178.38 is considered favourable as it is identified as a multi-swing low support, indicating historical significance as a level where buying interest has previously emerged.
The 2nd support at 171.90 is recognized as an overlap support, adding confluence to its potential as a support level.
On the resistance side, the 1st resistance at 184.60 is identified as an overlap resistance, suggesting historical significance as a level where selling interest may materialise.
The 2nd resistance at 188.49 is noted as a swing high resistance, adding further significance to this potential barrier for upward movement.
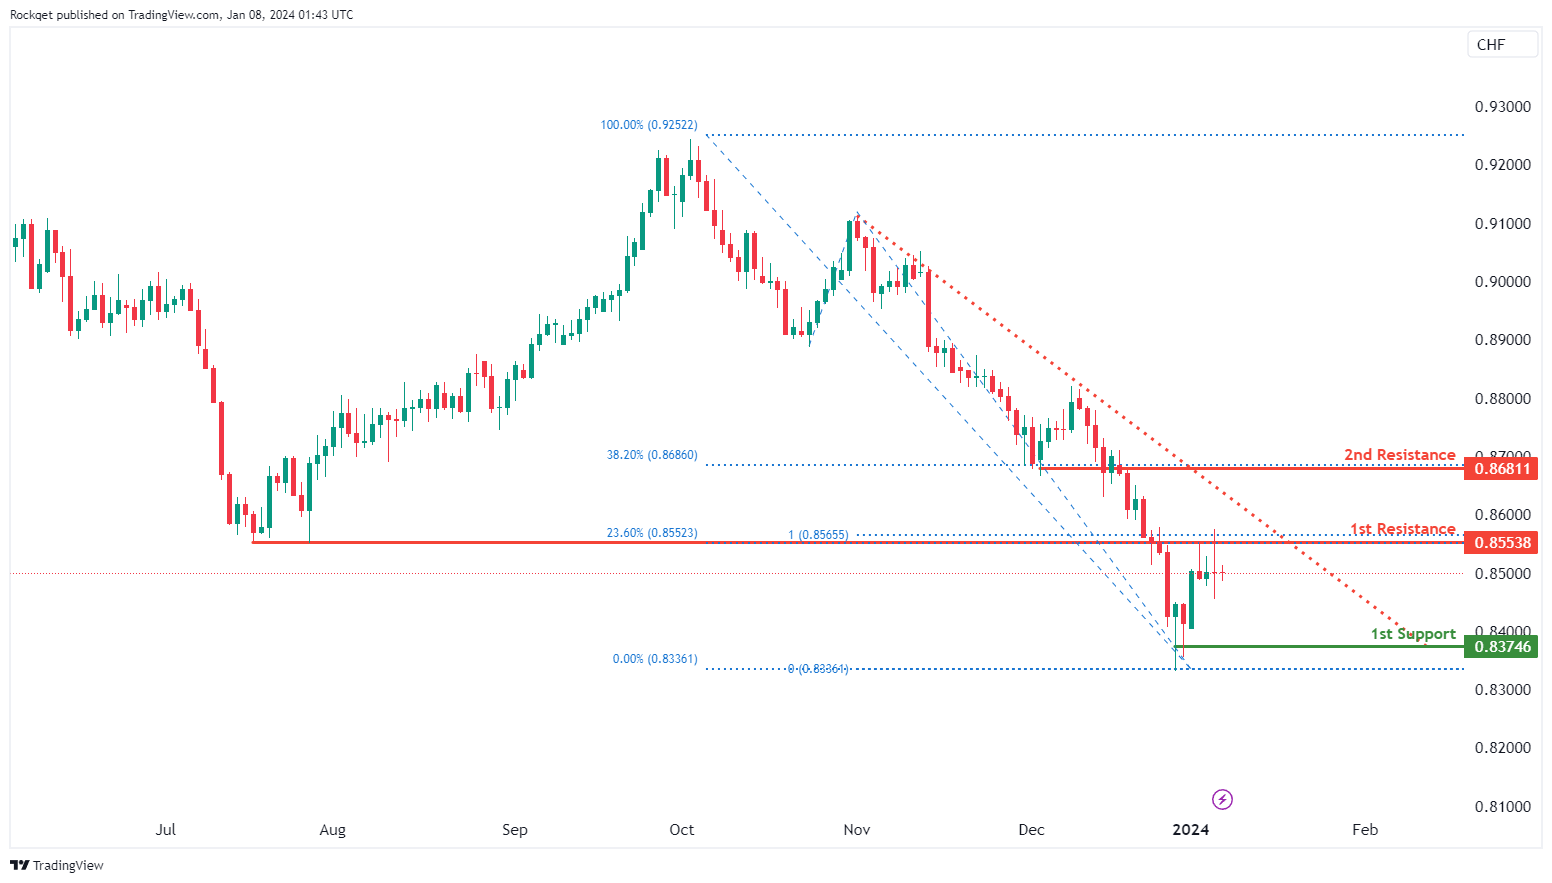
USD/CHF:
The USD/CHF chart currently exhibits a bearish overall momentum, signifying the relative weakness of the US Dollar against the Swiss Franc. This bearish momentum is reinforced by the presence of a major descending trendline, indicating a predisposition for continued downward movement.
The potential scenario suggests a bearish continuation towards the 1st support level at 0.8374. This level holds significance as it aligns with a swing low support, indicating a historical price level where buying interest may arise, providing temporary support for the USD/CHF pair.
On the resistance side, the 1st resistance at 0.8553 stands out for several reasons. Firstly, it is categorized as an overlap resistance, signifying a convergence of technical factors. Additionally, it aligns with the 23.60% Fibonacci Retracement level and the 100% Fibonacci Projection, creating a notable confluence of Fibonacci levels. This confluence reinforces the importance of 0.8553 as a robust potential resistance zone, suggesting that selling interest may intensify at this level.
The 2nd resistance at 0.8681 is identified as an overlap resistance and is further supported by the presence of the 38.20% Fibonacci Retracement level.
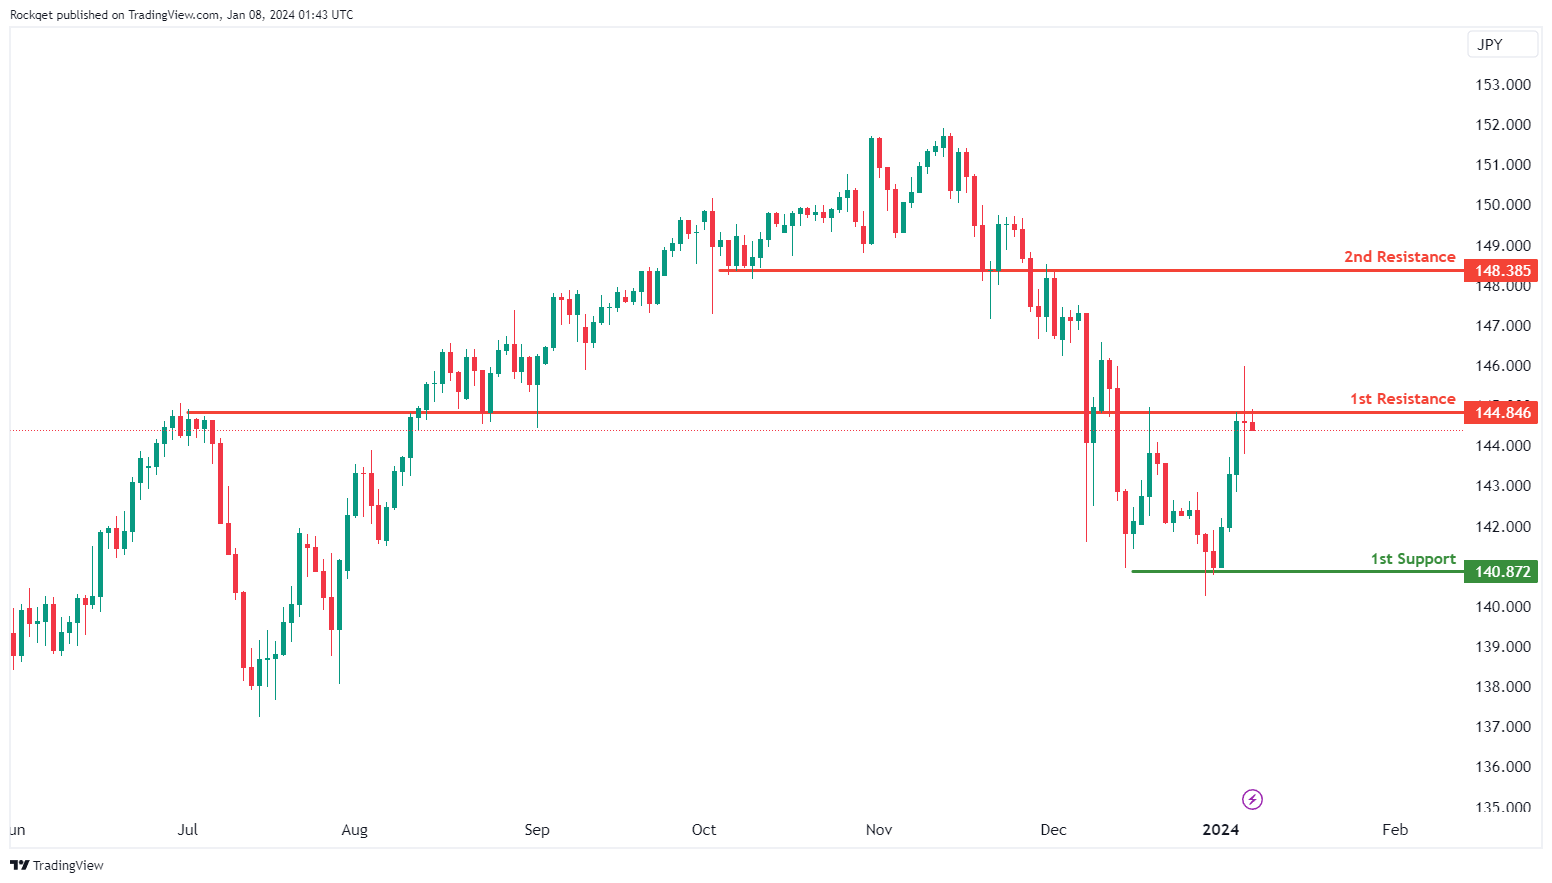
USD/JPY:
The USD/JPY chart currently displays a bearish overall momentum, indicating that the US Dollar is weaker relative to the Japanese Yen. In this scenario, there is a potential for a bearish reaction off the 1st resistance level followed by a drop towards the 1st support.
The 1st support at 140.87 is significant as it represents a multi-swing low support, suggesting that this level has historically attracted buying interest and could potentially act as a support zone in the event of a price decline.
On the resistance side, the 1st resistance at 144.84 is categorized as an overlap resistance, indicating its potential significance as a barrier where selling interest may intensify.
Additionally, the 2nd resistance at 148.38 is also identified as an overlap resistance, further reinforcing its importance as a potential price ceiling.
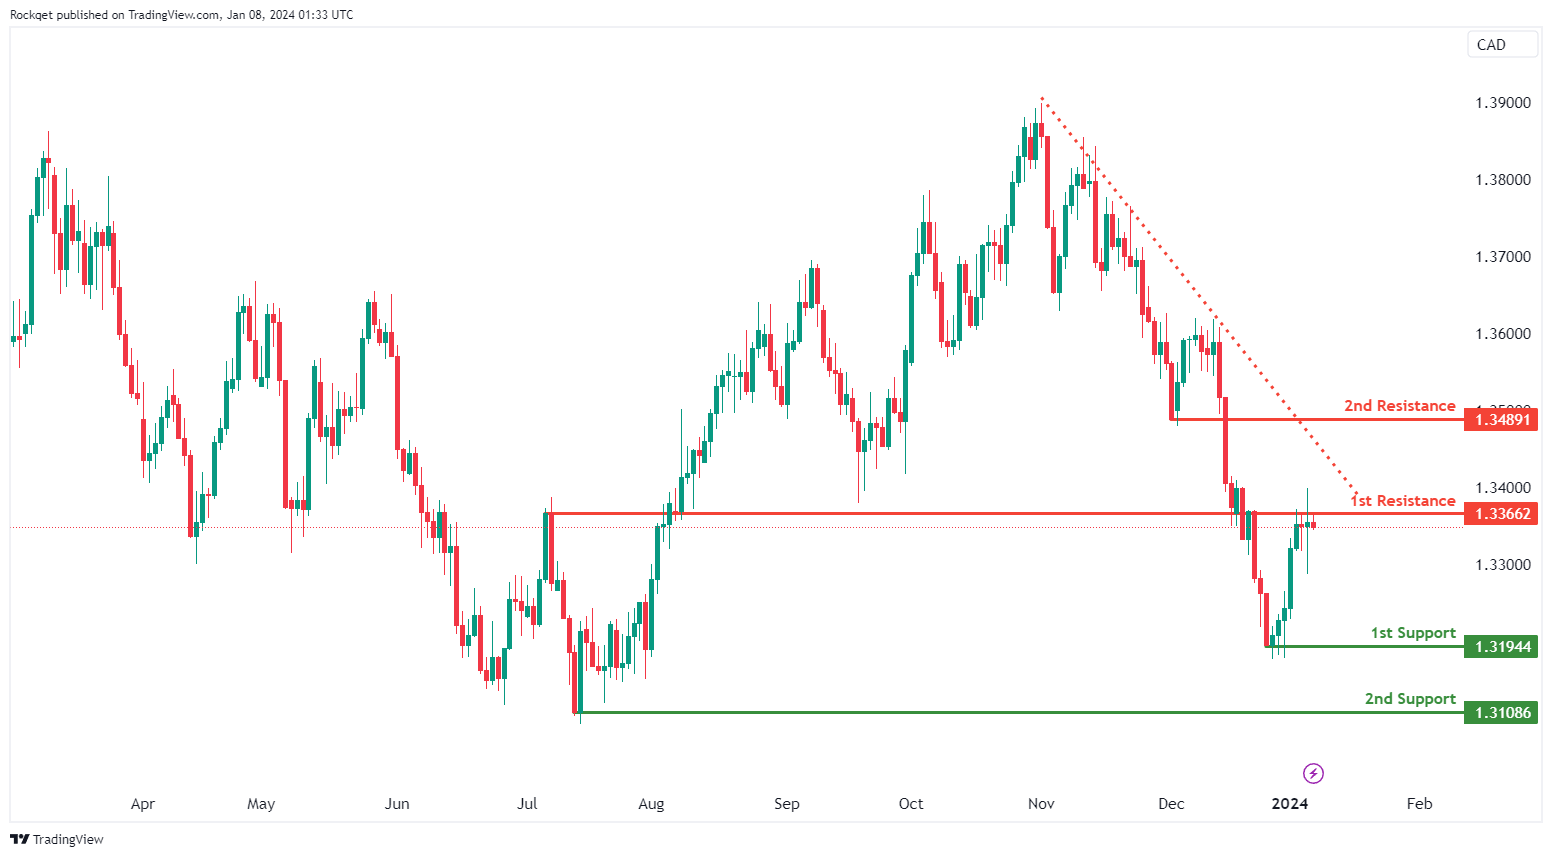
USD/CAD:
The USD/CAD chart currently exhibits an overall bearish momentum, with price trading under the descending trendline. In this context, there is a potential scenario for price to make a bearish reaction off the 1st resistance and drop towards the 1st support.
The 1st resistance level at 1.3366 is identified as an overlap resistance. Higher up, the 2nd resistance level at 1.3489 is noted as a pullback resistance, further reinforcing its significance as a potential resistance zone.
To the downside, the 1st support level at 1.3194 is identified as a swing-low support. Further below, the 2nd support level at 1.3108 is also marked as a swing-low support, further reinforcing its importance as a key support level.
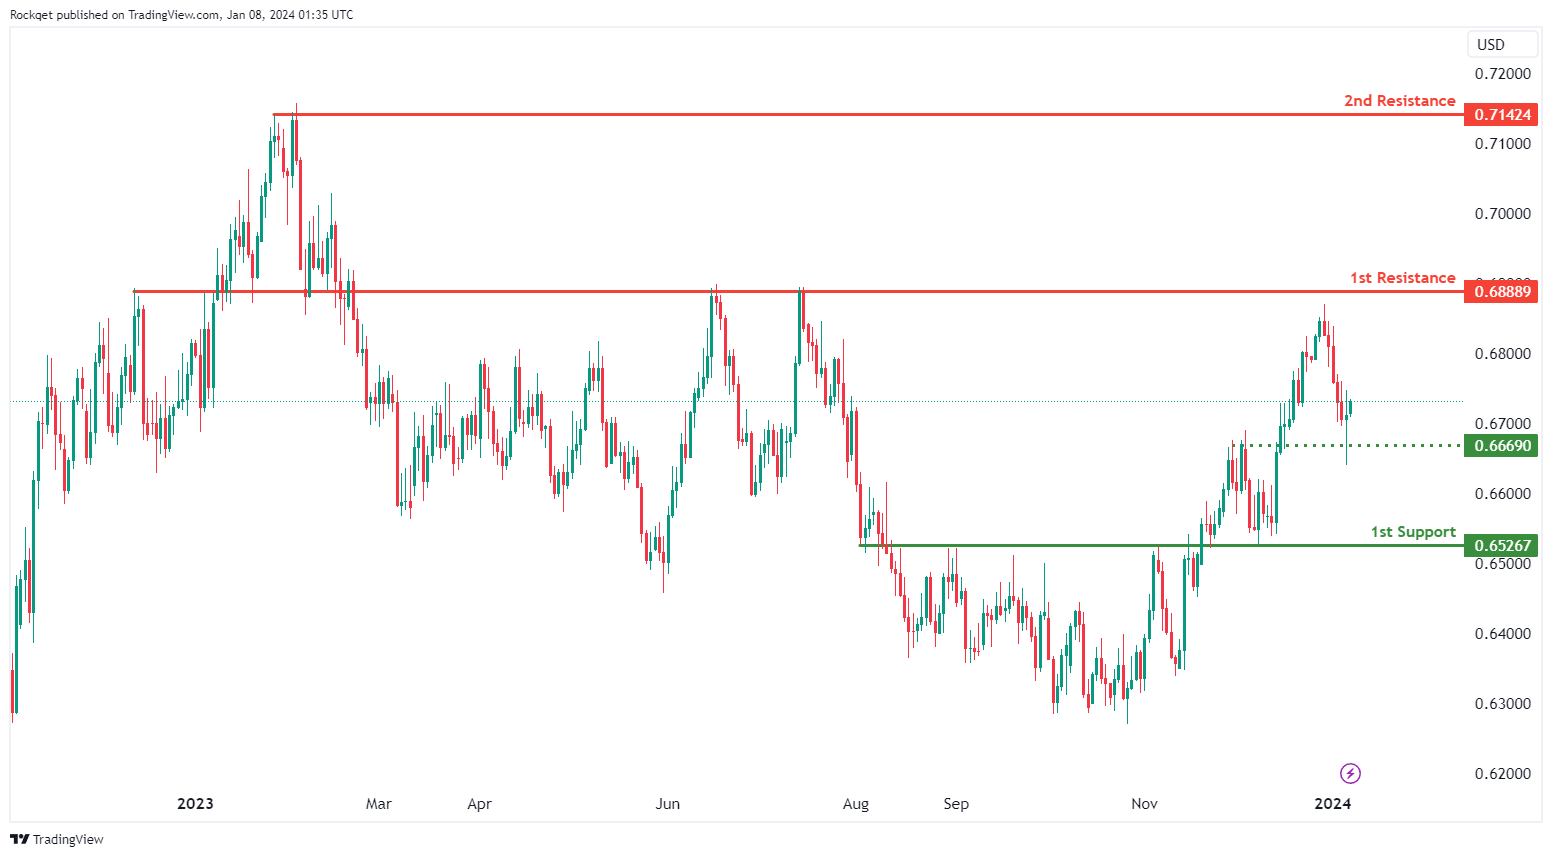
AUD/USD:
The AUD/USD chart currently exhibits an overall bullish momentum. In this context, there is a potential scenario for price to make a bullish continuation towards the 1st resistance.
The 1st resistance level at 0.6888 is identified as an overlap resistance. Higher up, the 2nd resistance level at 0.7142 is noted as a swing-high resistance, suggesting a potential barrier for further upside movement.
To the downside, the intermediate support level at 0.6669 is identified as an overlap support. Further below, the 1st support level at 0.6526 is also marked as an overlap support, further reinforcing its importance as a key support level.
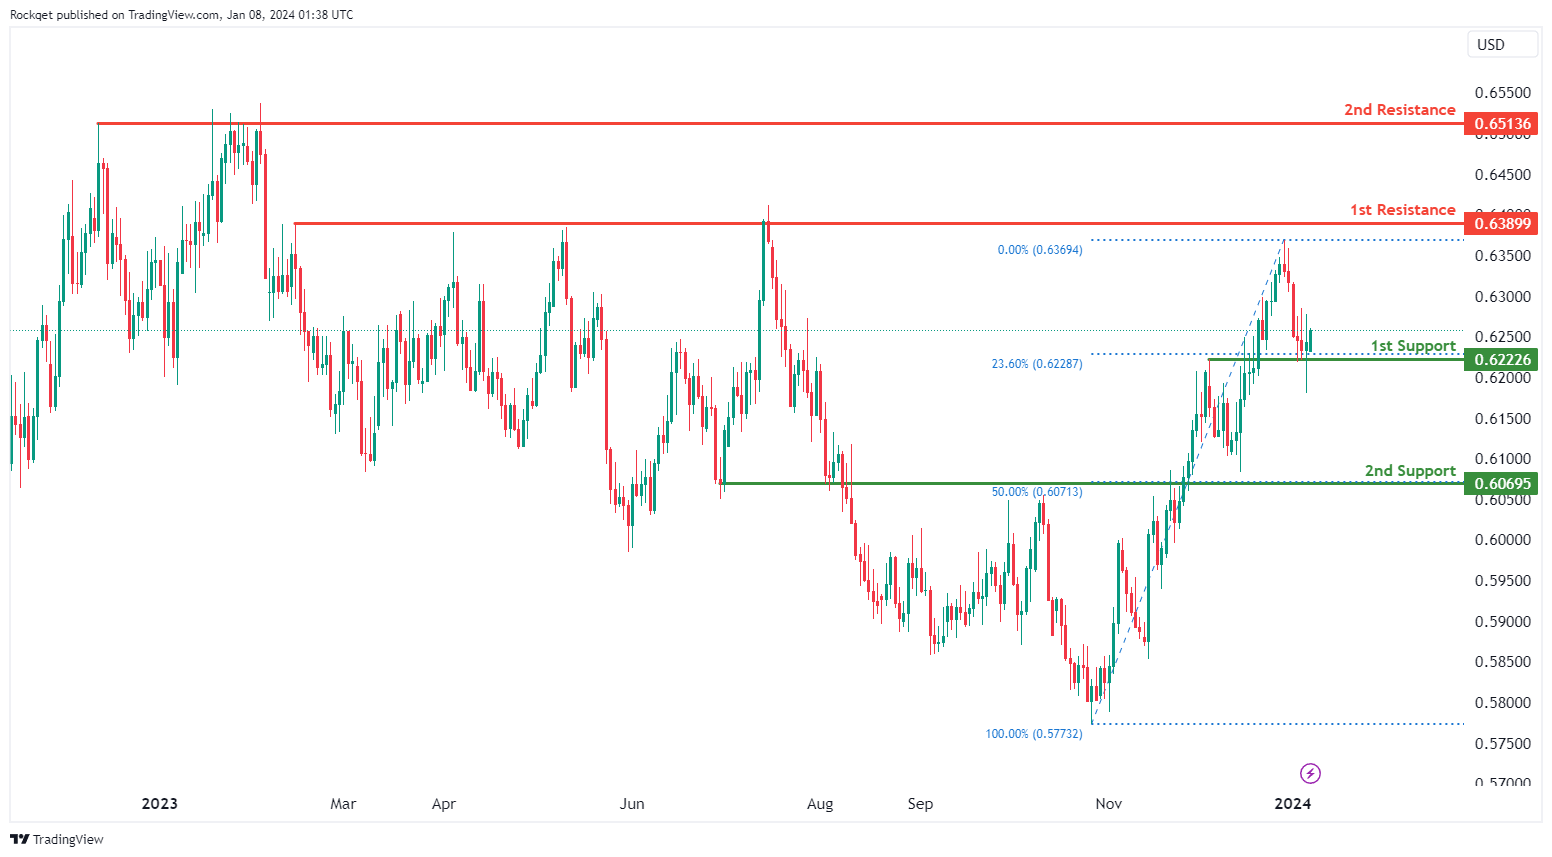
NZD/USD
The NZD/USD chart currently exhibits an overall bullish momentum. In this context, there is a potential scenario for price to make a bullish continuation towards the 1st resistance.
The 1st resistance level at 0.6389 is identified as a multi-swing-high resistance. Higher up, the 2nd resistance level at 0.6513 is also noted as a multi-swing-high resistance, suggesting a potential barrier for further upside movement.
To the downside, the 1st support level at 0.6222 is identified as an overlap support that aligns with the 23.60% Fibonacci retracement level. Further below, the 2nd support level at 0.6069 is also marked as an overlap support that aligns with the 50.00% Fibonacci retracement level, further reinforcing its importance as a key support level.
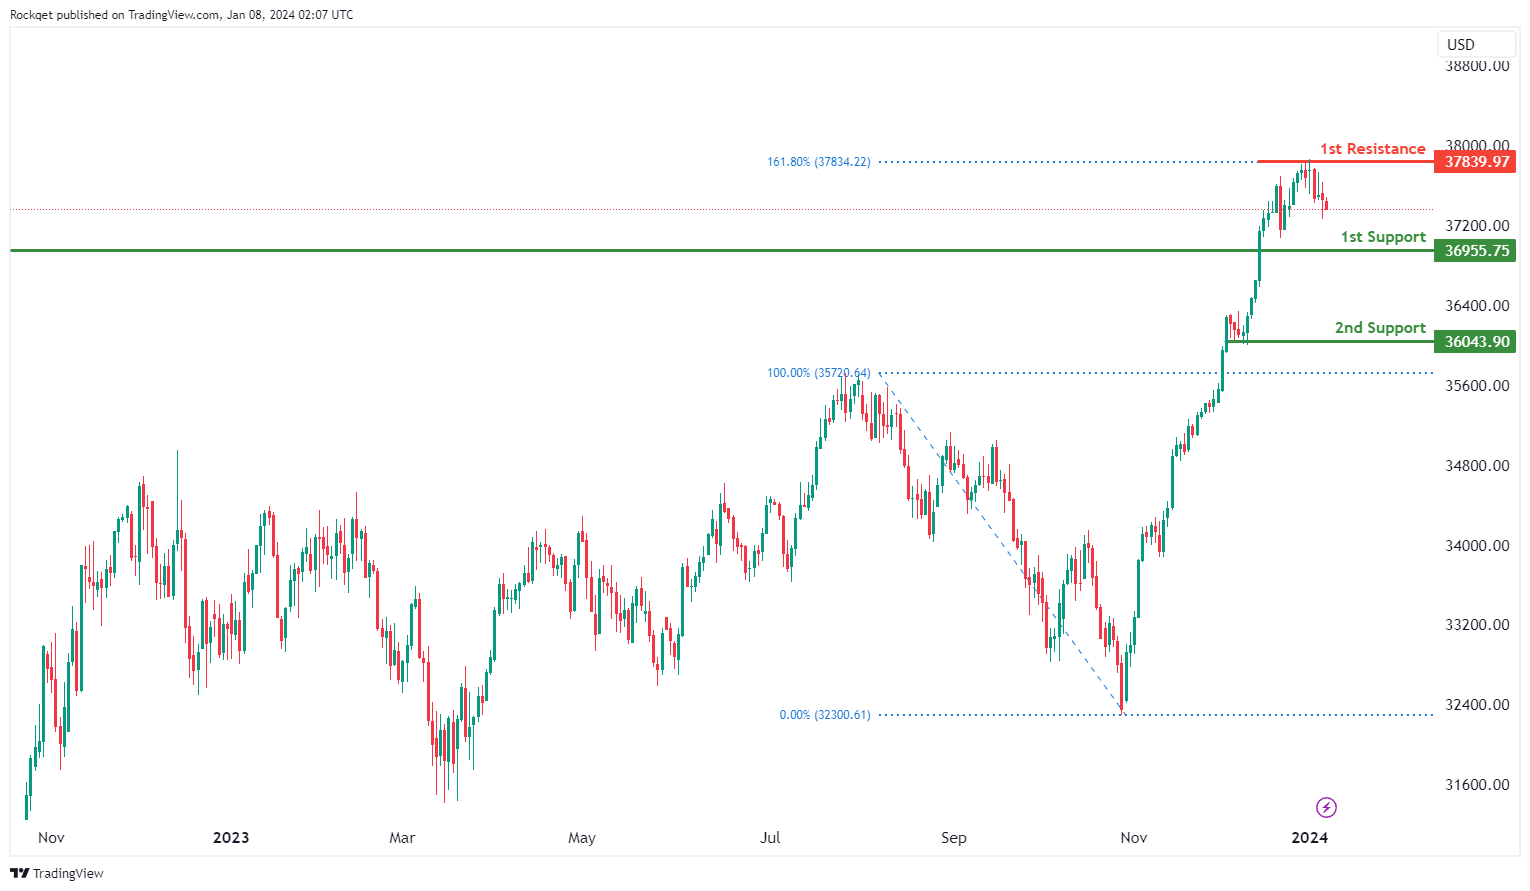
DJ30:
The DJ30 chart currently exhibits a bearish overall momentum, indicating a downward trend. There is a potential scenario for a bearish continuation towards the 1st support.
The 1st support at 36955.75 is considered favourable as it is identified as a pullback support, indicating a level where buying interest has previously emerged.
The 2nd support at 36043.90 is also recognized as a pullback support, adding confluence to its potential as a support level.
On the resistance side, the 1st resistance at 37839.97 is identified as a swing high resistance and coincides with the 161.80% Fibonacci Extension, suggesting historical significance as a level where selling interest may materialise.
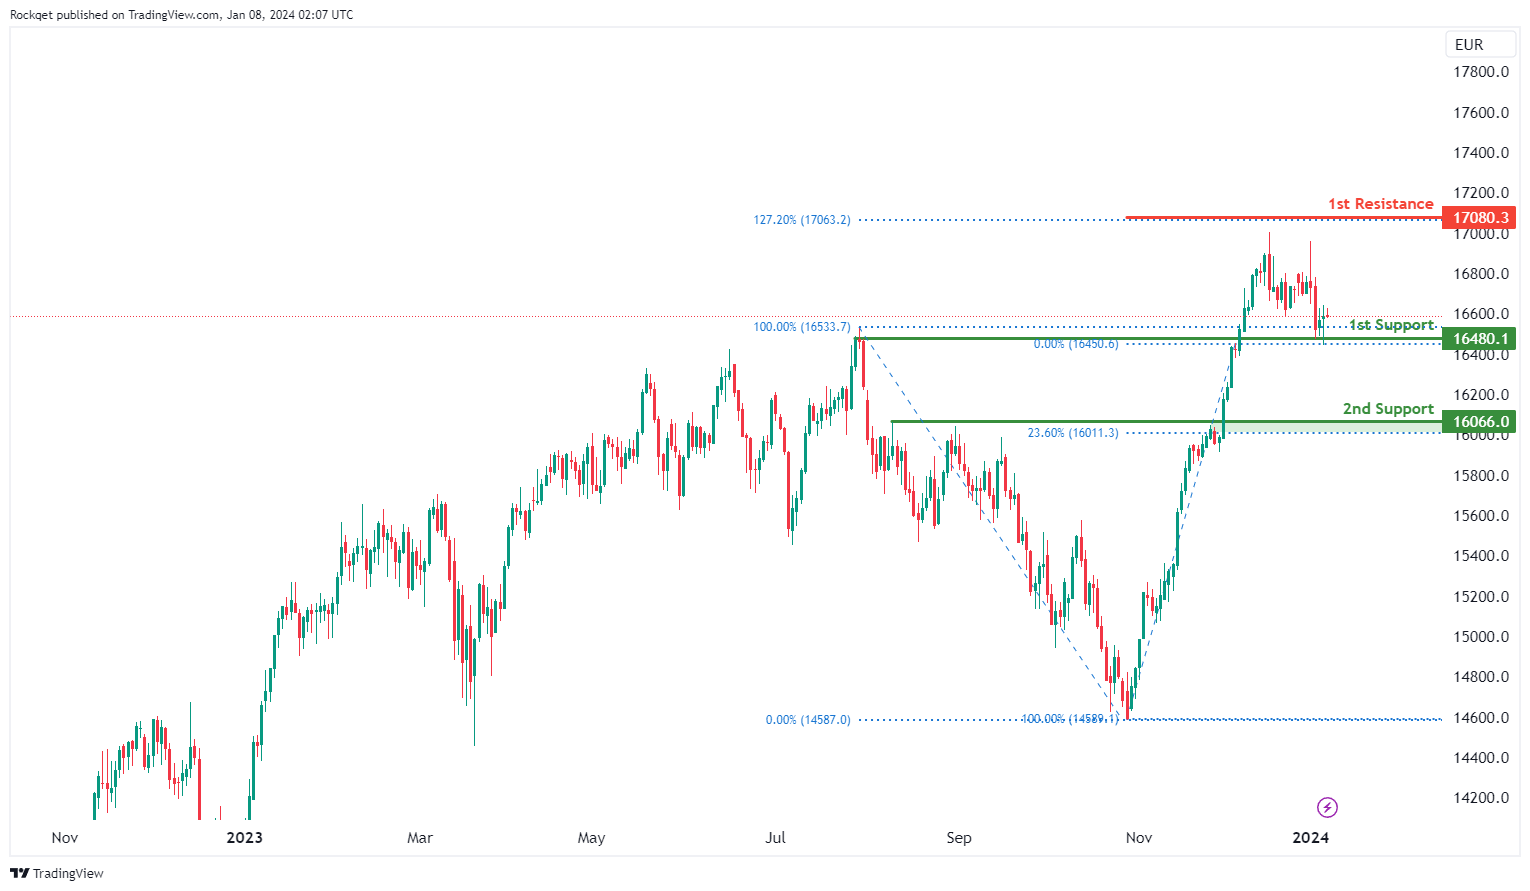
GER40:
The GER40 chart currently displays a bullish overall momentum, indicating an upward trend. There is a potential scenario for a bullish bounce off the 1st support towards the 1st resistance.
The 1st support at 16480.10 is considered favourable due to its identification as an overlap support, suggesting historical significance as a level where buying interest has previously emerged.
The 2nd support at 16066.00 is recognized as a pullback support and coincides with the 23.60% Fibonacci Retracement, adding confluence to its potential as a support level.
On the resistance side, the 1st resistance at 17080.30 is noteworthy for being associated with the 127.20% Fibonacci Expansion, indicating a level where selling interest could materialise.
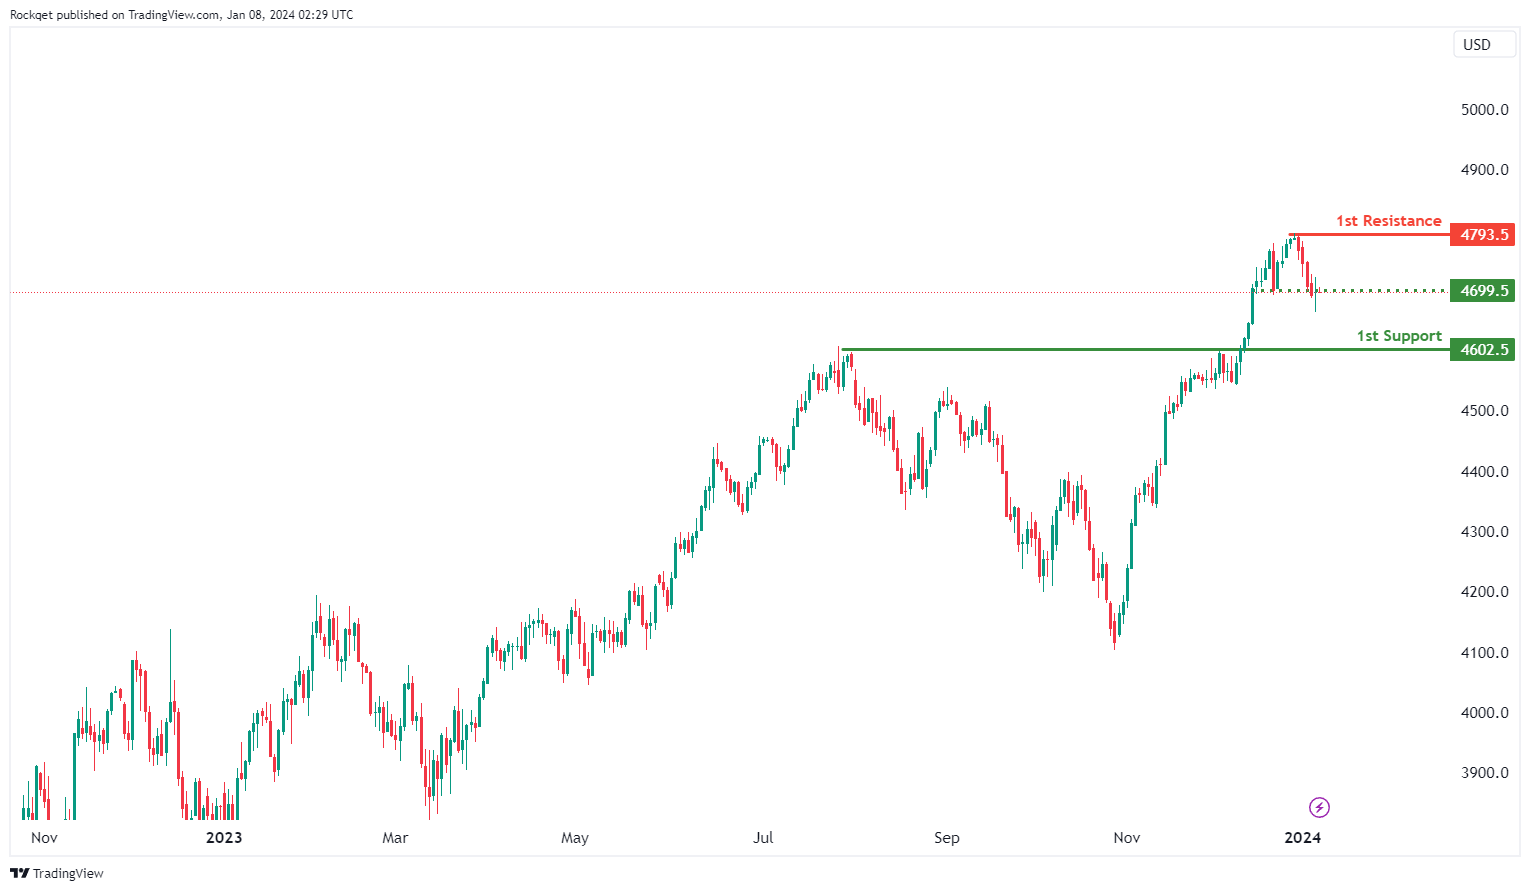
US500:
The US500 chart currently exhibits a bearish overall momentum, indicating a downward trend. Contributing factors to this momentum suggest the potential for a bearish continuation towards the 1st support.
The intermediate support at 4699.5 is considered significant as it represents a pullback support, implying a level where buying interest has previously emerged during pullback phases.
The 2nd support at 4602.5 is identified as an overlap support, adding to its potential significance as a level where historical price action suggests increased buying interest.
On the resistance side, the 1st resistance at 4793.5 is noted for being associated with swing high resistance, indicating a level where selling interest could materialise.
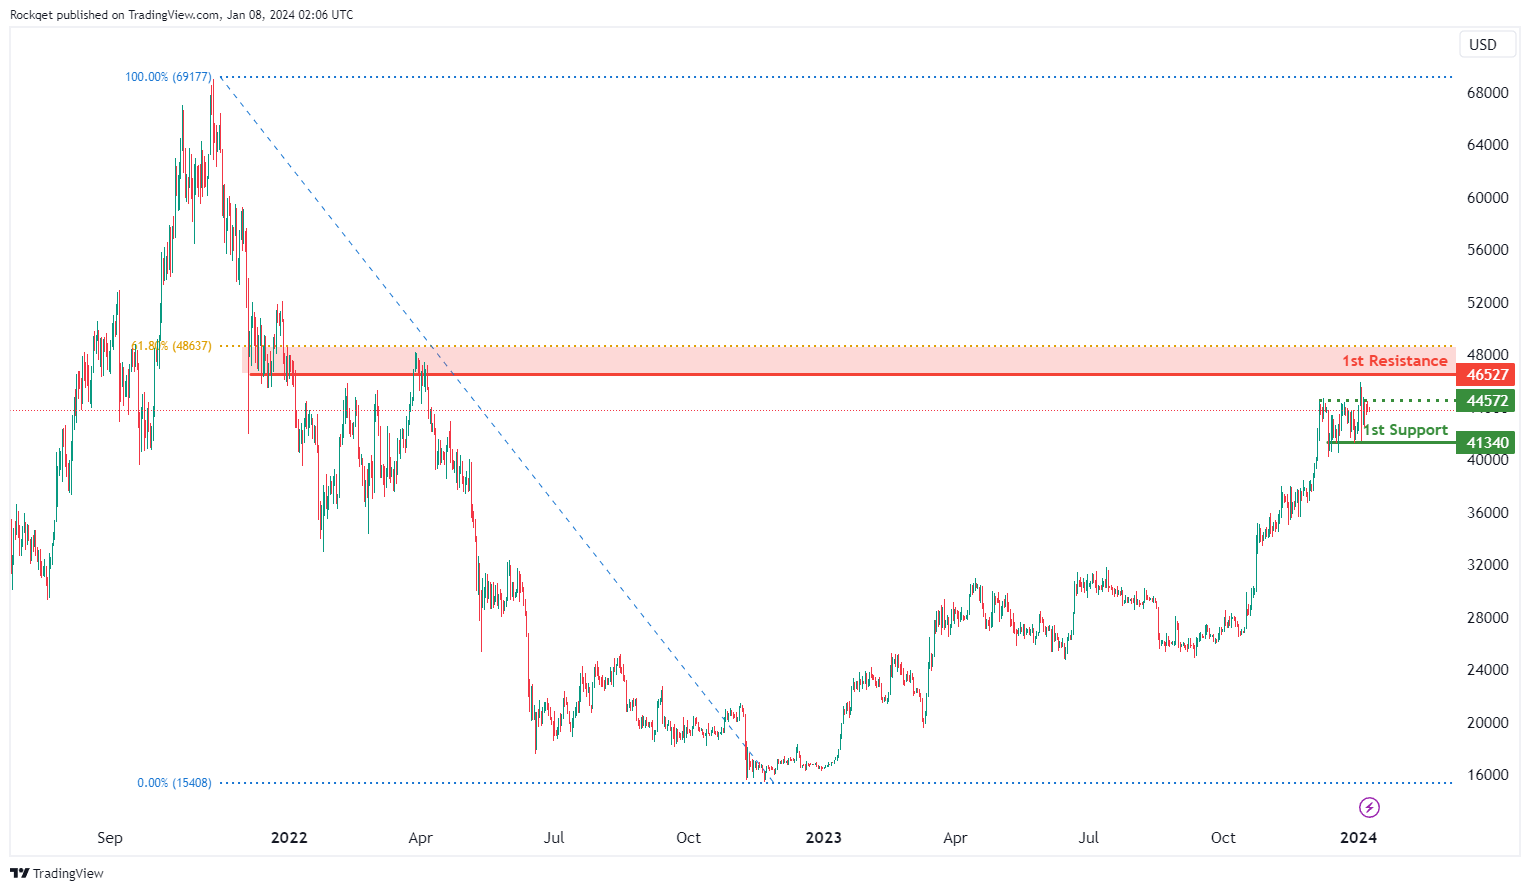
BTC/USD:
The BTC/USD chart currently reflects a neutral overall momentum, suggesting a lack of a clear trend direction. There is a potential scenario for price to fluctuate between the 1st resistance and 1st support levels.
The intermediate support at 44572 is considered significant as it represents a pullback support, indicating a level where buying interest has previously emerged during pullback phases.
The 1st support at 41340 is identified as a multi-swing low support, further emphasising its potential as a key level where historical buying interest has been observed.
On the resistance side, the 1st resistance at 46527 is noted for being associated with an overlap resistance and the 61.80% Fibonacci Retracement level. This suggests a level where historical selling interest and potential price reversal could occur.
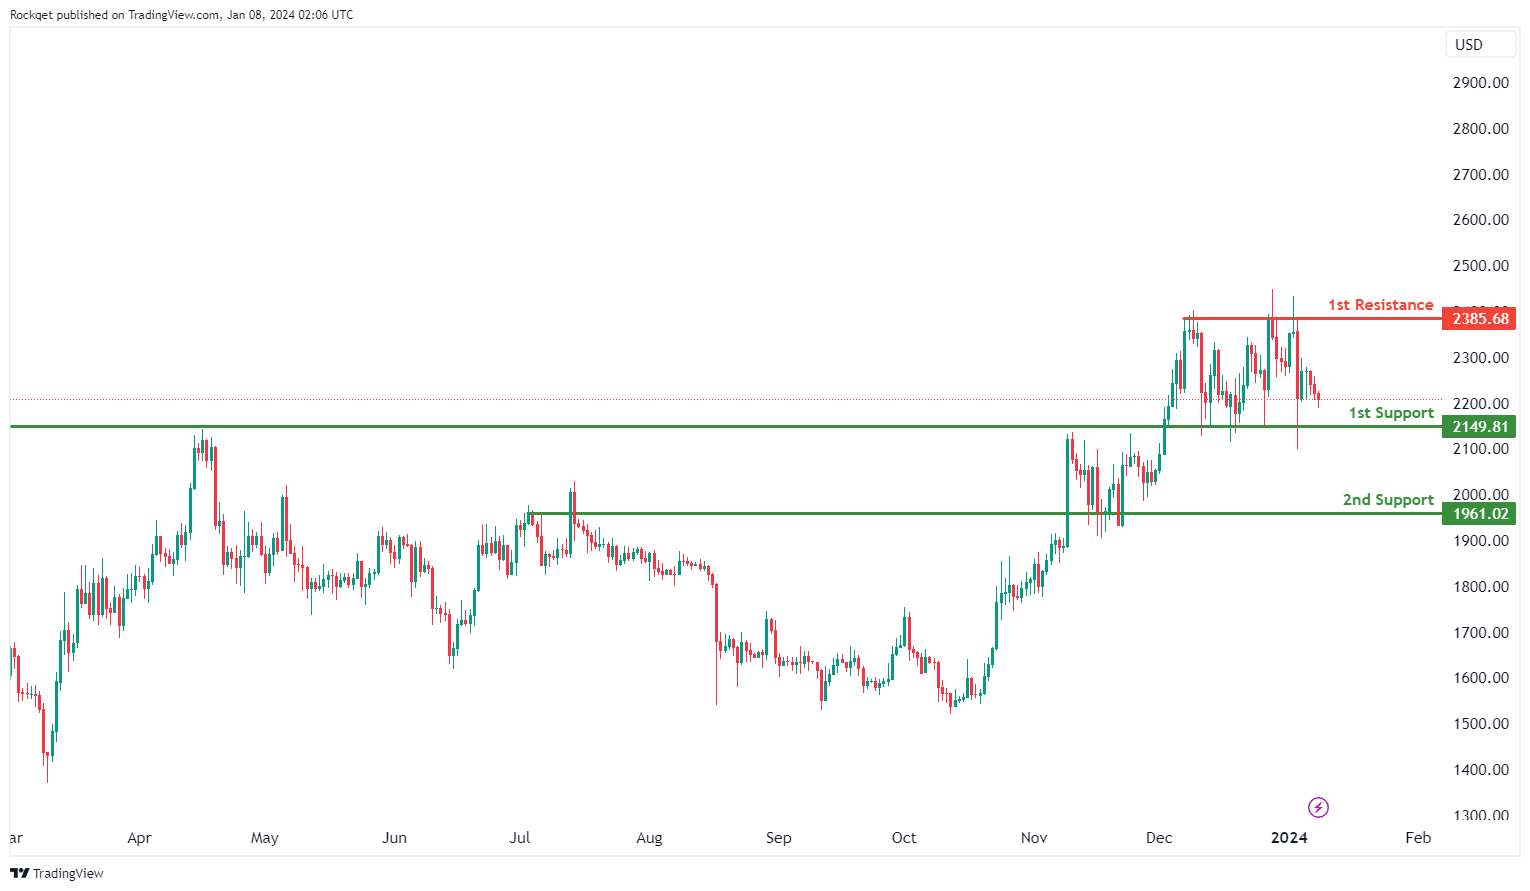
ETH/USD:
The ETH/USD chart currently exhibits a bearish overall momentum, indicating a downward trend. There is a potential scenario for a bearish continuation towards the 1st support.
The 1st support at 2149.81 is considered significant as it is associated with an overlap support, suggesting a historical level where buying interest has previously emerged.
Additionally, the 2nd support at 1961.02 is identified as another overlap support, adding further significance to this level as a potential area for buying interest.
On the resistance side, the 1st resistance at 2385.68 is noted for being a multi-swing high resistance. This level may act as a barrier where historical selling interest and potential price reversal could occur.
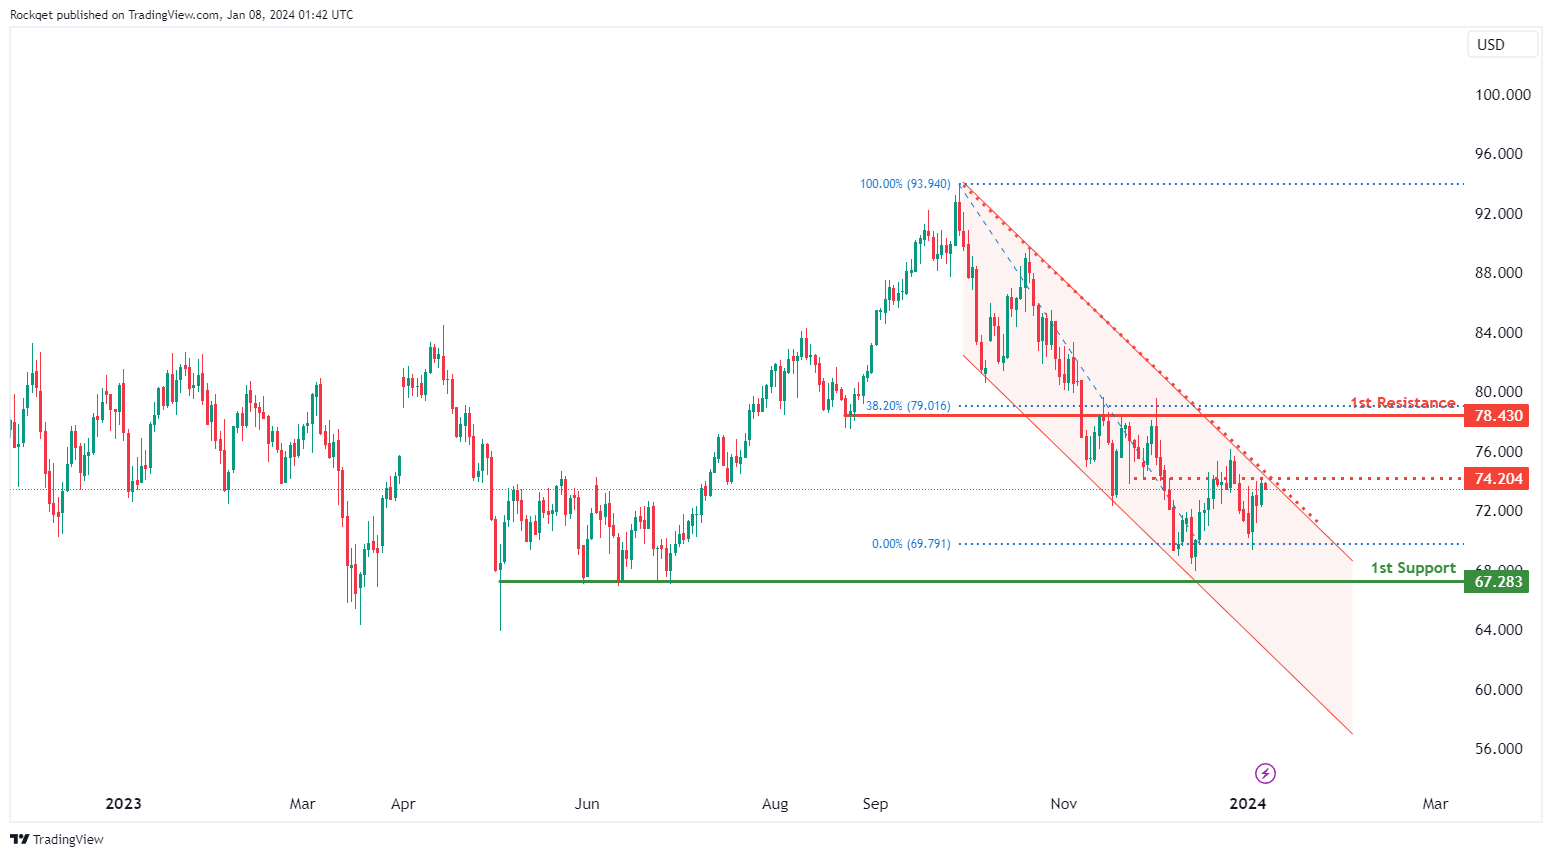
WTI/USD:
The WTI (West Texas Intermediate) chart currently exhibits an overall bearish momentum, with price trading within a bearish channel. In this context, there is a potential scenario for price to make a bearish reaction off the intermediate resistance and drop towards the 1st support.
The intermediate resistance level at 74.20 is identified as an overlap resistance. Higher up, the 2nd resistance level at 78.43 is also noted as an overlap resistance that aligns close to the 38.20% Fibonacci retracement level, suggesting a potential barrier for further upside movement.
On the downside, the 1st support level at 67.28 is identified as a multi-swing-low support, further reinforcing its importance as a key support level.
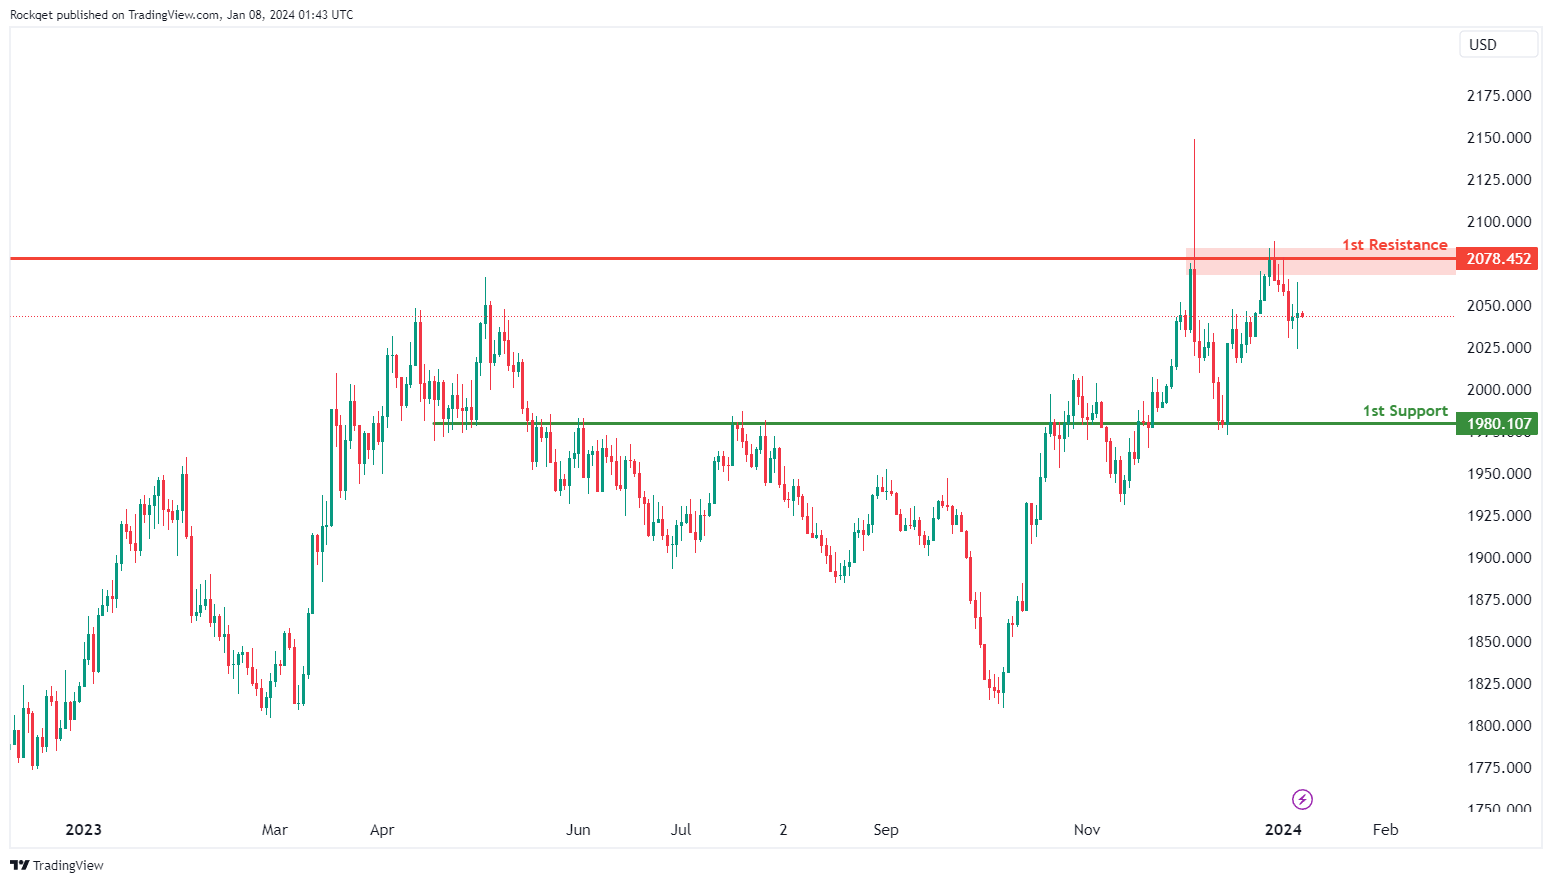
XAU/USD (GOLD):
The XAU/USD chart currently exhibits a bearish overall momentum, indicating weakness in the price of gold relative to the US Dollar. In this context, there is a potential for a bearish continuation towards the 1st support level.
The 1st support at 1980.10 is considered significant as it aligns with an overlap support level. This suggests that it is a price point where buying interest has historically emerged, potentially offering temporary support to the XAU/USD pair.
On the resistance side, the 1st resistance at 2078.45 is identified as an overlap resistance. This level may act as a substantial barrier where selling interest could intensify.


