
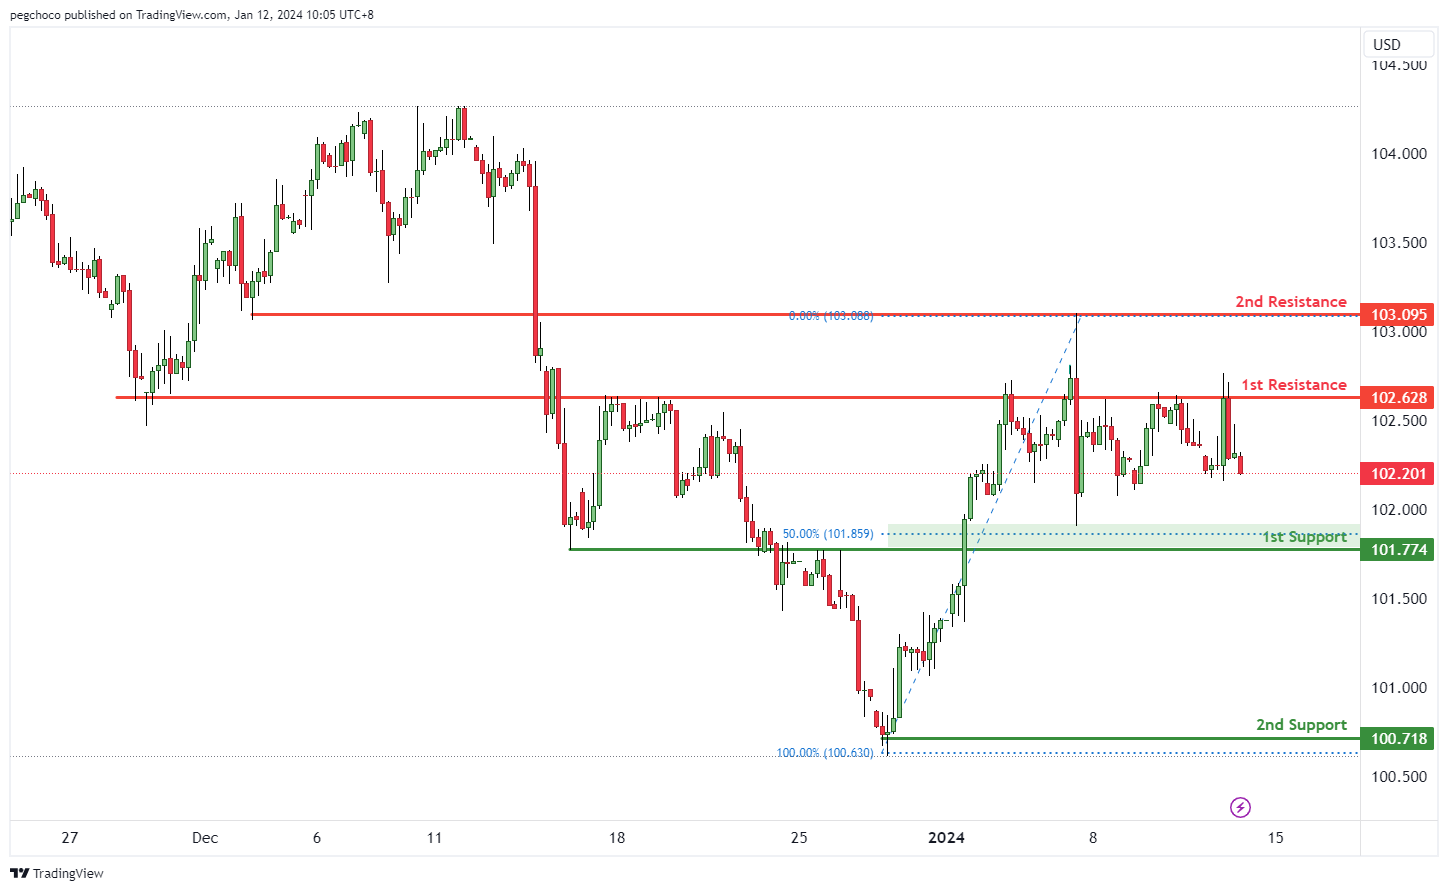
DXY:
The DXY (US Dollar Index) chart currently demonstrates a bearish overall momentum, indicating a weaker stance for the US Dollar. This momentum suggests the potential for a bearish continuation towards the 1st support level.
The 1st support at 101.77 is recognized as an overlap support and coincides with the 50% Fibonacci Retracement level. This confluence of factors makes it a significant potential support zone, indicating a level where buyers may step in, temporarily supporting the DXY.
The 2nd support at 100.71 is identified as a swing low support, further reinforcing its importance as a potential support area.
On the resistance side, the 1st resistance at 102.62 is categorized as an overlap resistance, suggesting a level where selling pressure or a potential reversal may occur.
The 2nd resistance at 103.09 is also considered an overlap resistance, adding to its significance as a potential barrier to the price’s upward movement in the context of the bearish momentum.
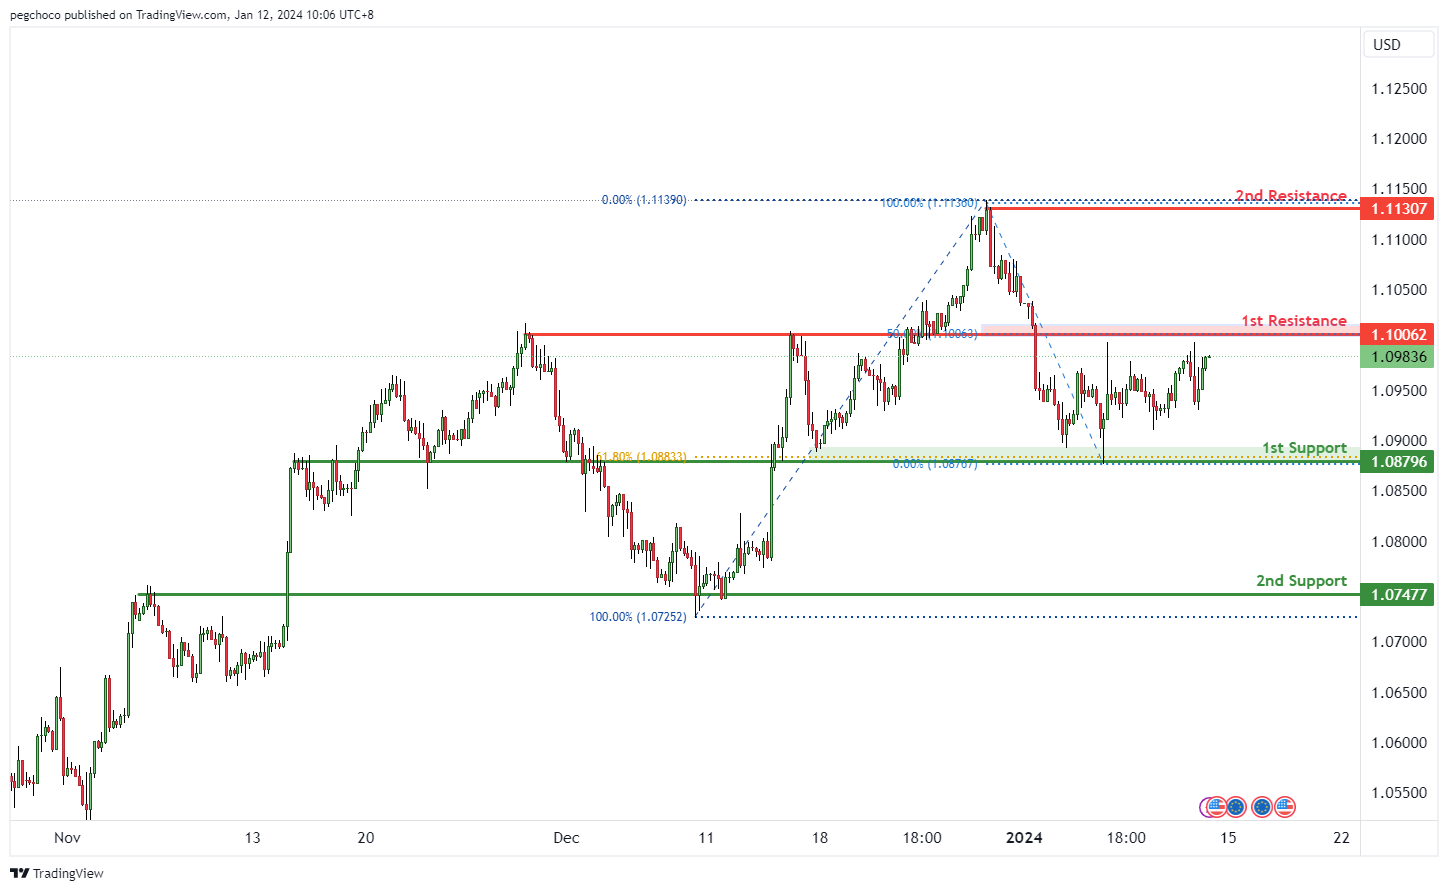
EUR/USD:
The EUR/USD chart currently exhibits a neutral overall momentum, suggesting a lack of strong directional bias in the near term. Given this neutral stance, there’s a potential scenario where the price may fluctuate between the 1st resistance and 1st support levels.
The 1st support at 1.0879 is identified as an overlap support and aligns with the 61.80% Fibonacci Retracement level. This confluence of factors makes it a significant potential support zone, indicating a level where buyers may show interest in the EUR/USD pair, potentially providing temporary support.
The 2nd support at 1.0747 is categorized as an overlap support, further reinforcing its significance as a potential support area.
On the resistance side, the 1st resistance at 1.1006 is marked as an overlap resistance, suggesting a level where selling pressure or a potential reversal may occur.
The 2nd resistance at 1.1130 is categorized as a swing high resistance, indicating a point where price has previously encountered resistance or reversal.
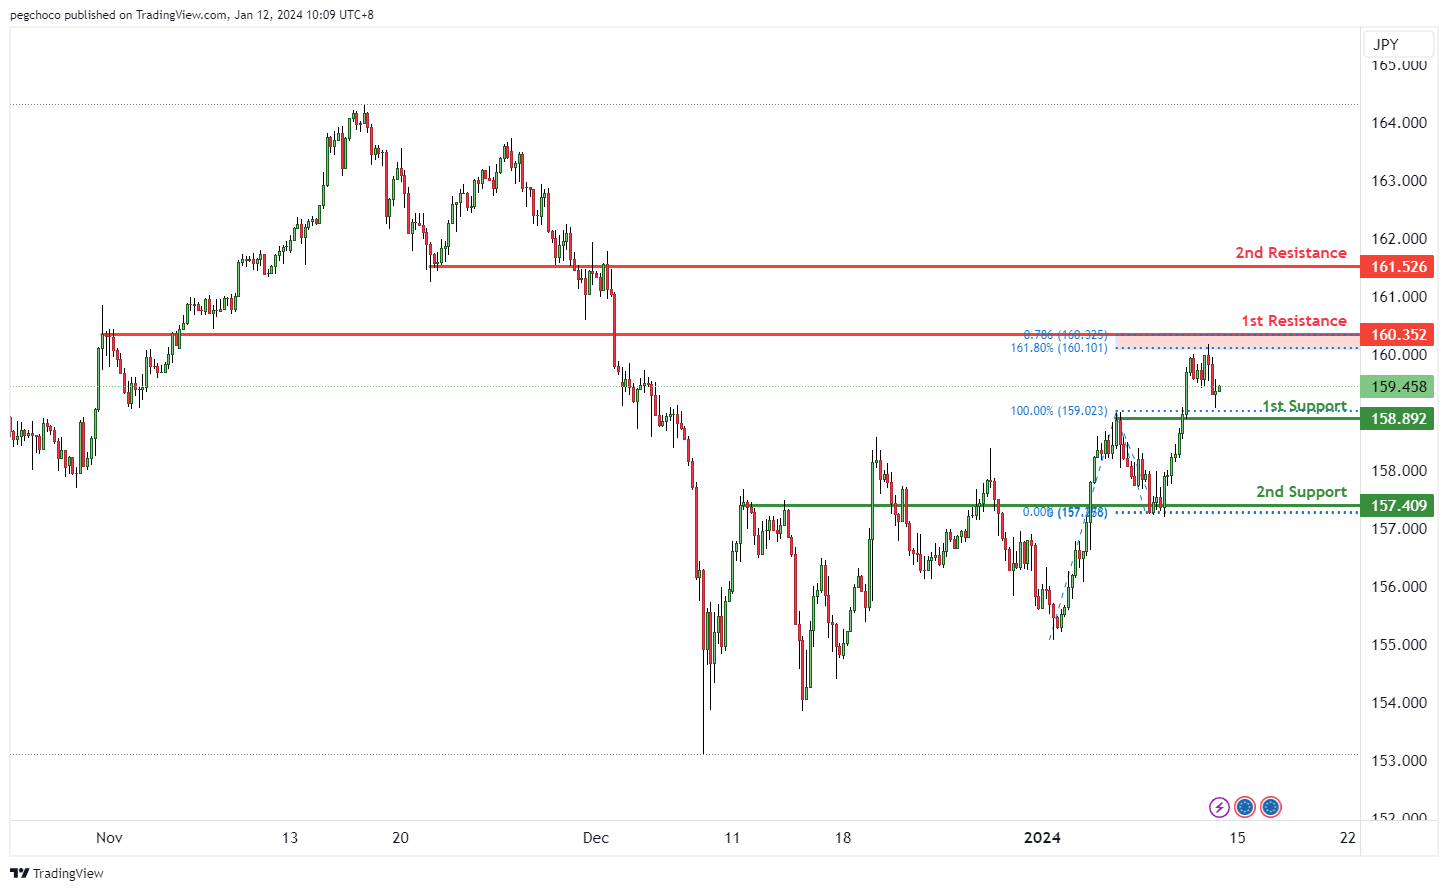
EUR/JPY:
The EUR/JPY chart currently maintains a bullish overall momentum, indicating strength in the Euro relative to the Japanese Yen. This momentum suggests the potential for a bullish bounce off the 1st support level with a subsequent move towards the 1st resistance level.
The 1st support at 158.89 is identified as a pullback support, making it a significant level where buyers may step in, providing temporary support for EUR/JPY. Additionally, this level aligns with the 161.80% Fibonacci Extension and the 78.60% Fibonacci Projection, indicating a confluence of Fibonacci levels, further reinforcing its importance as a potential support zone.
Furthermore, there is a 2nd support at 157.40, categorized as an overlap support, which adds to its significance as a potential support area.
On the resistance side, the 1st resistance at 169.35 is marked as a pullback resistance, where selling interest may emerge, and it also aligns with the 161.80% Fibonacci Extension and the 78.60% Fibonacci Projection, indicating Fibonacci confluence.
The 2nd resistance at 161.52 is categorized as an overlap resistance, which may act as a barrier to any further upward price movement.
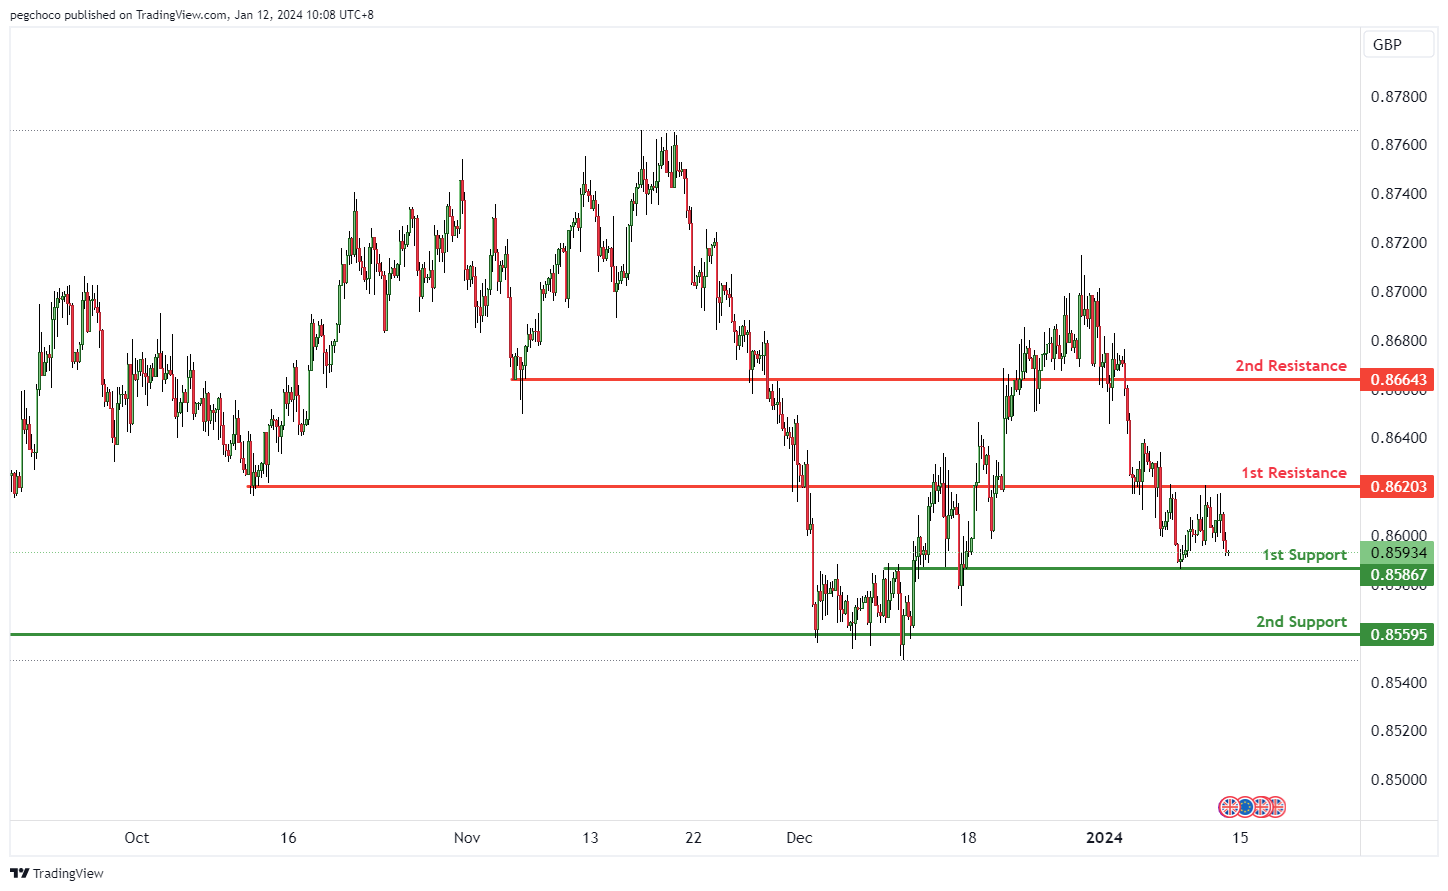
EUR/GBP:
The EUR/GBP chart currently exhibits a bearish overall momentum, indicating weakness in the Euro relative to the British Pound. This momentum suggests the potential for a bearish continuation towards the 1st support level.
The 1st support at 0.8586 is marked as an overlap support, indicating a level where buyers may find interest and temporarily halt the bearish momentum.
Additionally, there is a 2nd support at 0.8559, categorized as multi-swing low support, which further strengthens its significance as a potential support zone.
On the resistance side, the 1st resistance at 0.8620 is identified as an overlap resistance, indicating a potential area where selling interest may emerge, causing a bearish reaction.
The 2nd resistance at 0.8664 is categorized as pullback resistance, reinforcing its significance as a potential barrier for any upward price movement.
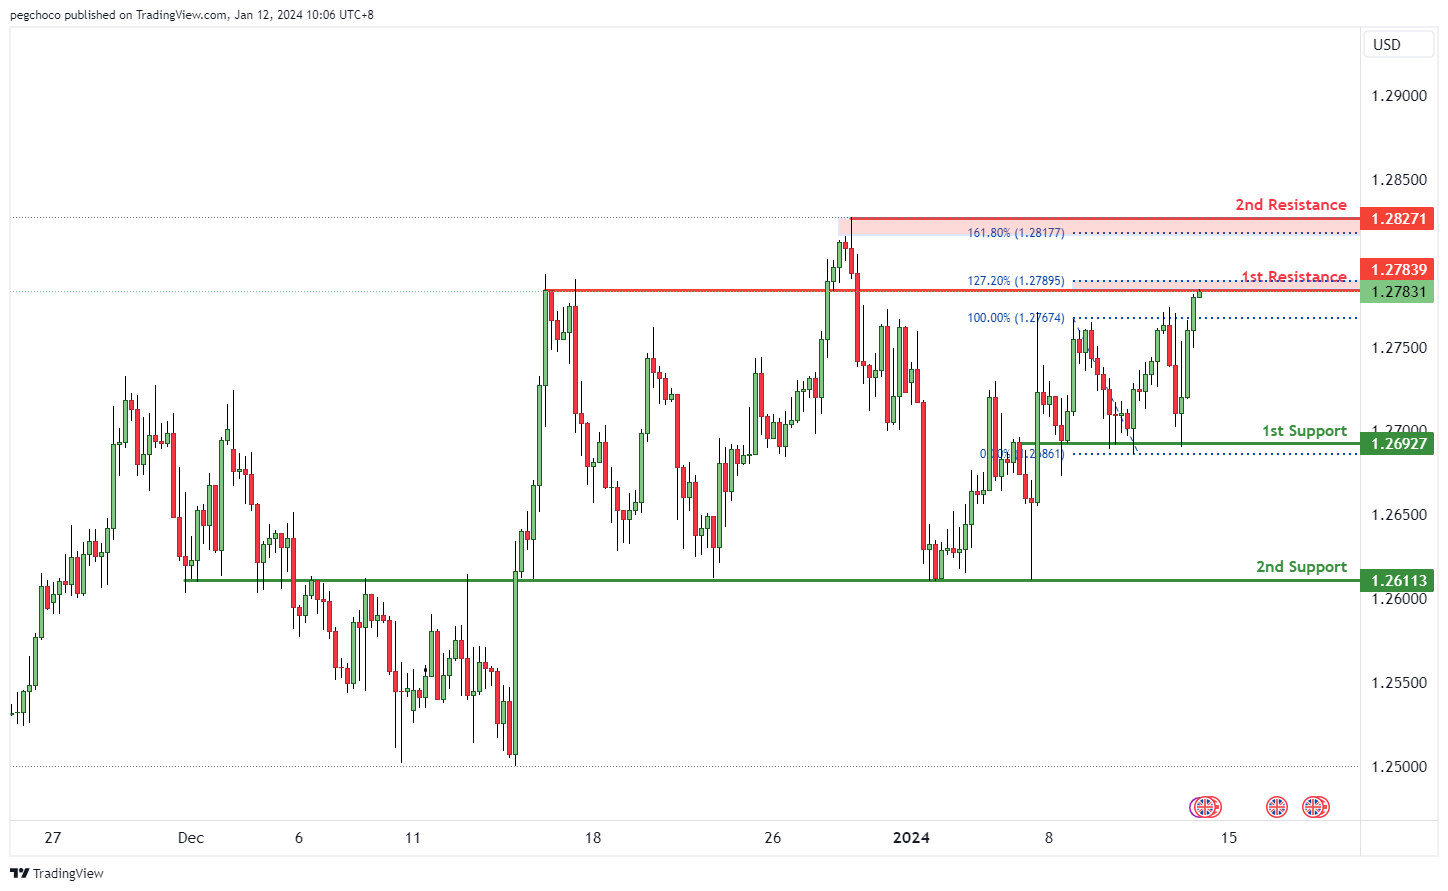
GBP/USD:
The GBP/USD chart currently shows a bearish overall momentum, indicating a stronger US Dollar relative to the British Pound. In the short term, there is a potential scenario where the price reacts bearishly off the 1st resistance level and drops towards the 1st support.
The 1st support at 1.2692 is identified as an overlap support, making it a significant potential support level where buyers may step in and provide temporary support for the GBP/USD pair.
The 2nd support at 1.2611 is also categorized as an overlap support, reinforcing its significance as a potential support area.
On the resistance side, the 1st resistance at 1.2783 is considered a pullback resistance and aligns with the 127.20% Fibonacci Extension level, making it a strong potential barrier for the price.
The 2nd resistance at 1.2827 is marked as a swing high resistance and aligns with the 161.80% Fibonacci Extension level, adding to its significance as a potential point of reversal or resistance.
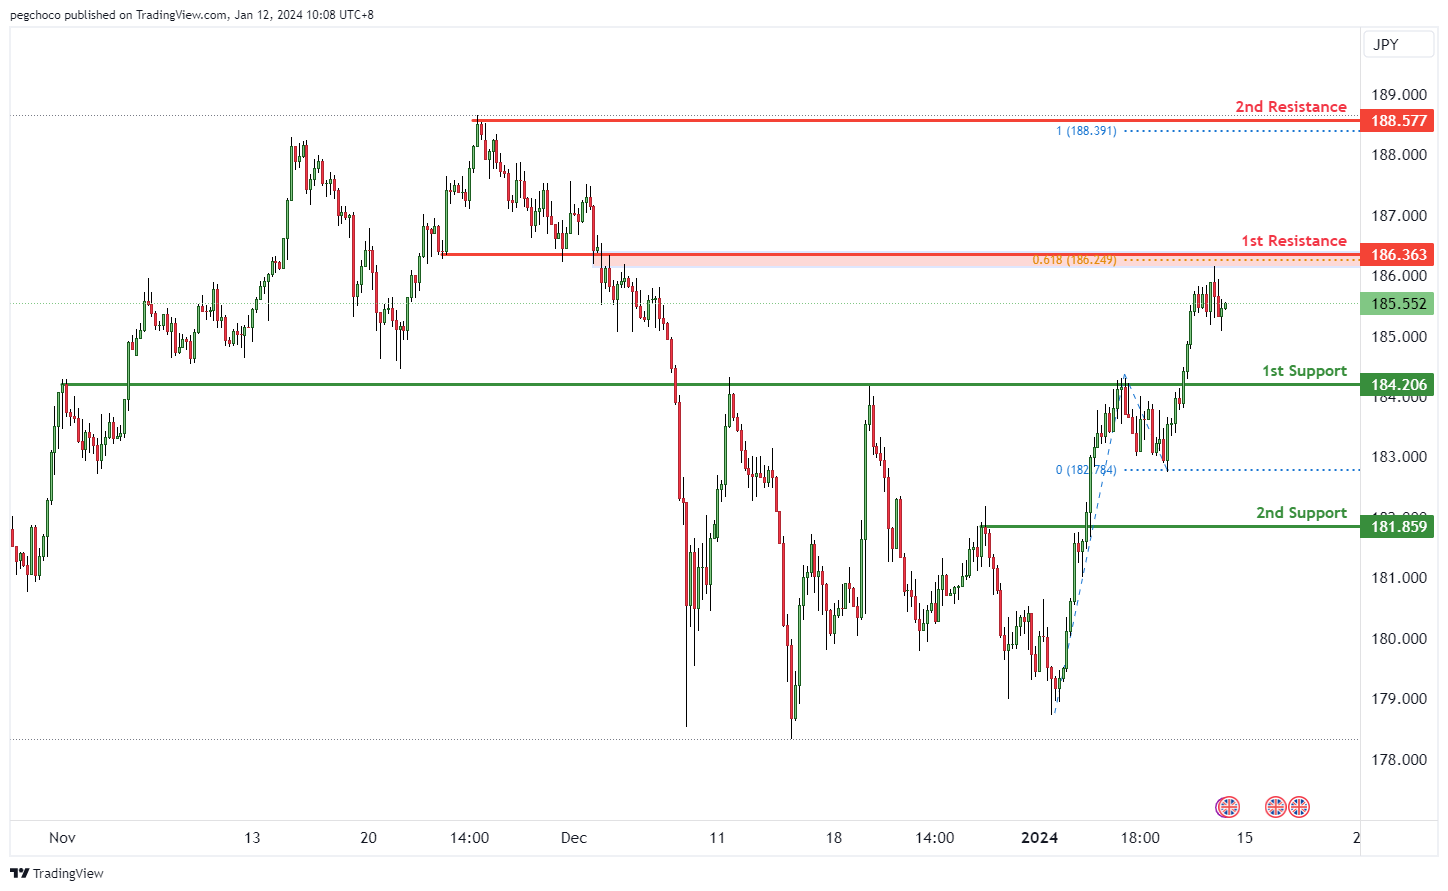
GBP/JPY:
The GBP/JPY chart currently has a bearish overall momentum, suggesting weakness in the British Pound relative to the Japanese Yen. This momentum indicates the potential for a bearish continuation towards the 1st support level.
The 1st support at 184.20 is identified as a pullback support, indicating a level where buyers might step in, providing temporary support for the GBP/JPY pair.
There is also a 2nd support at 181.85, categorized as pullback support as well, reinforcing its significance as a potential support area.
On the resistance side, the 1st resistance at 186.36 is marked as an overlap resistance, suggesting a potential area where selling interest may emerge, causing a bearish reaction.
The 2nd resistance at 188.57 is a swing high resistance and also aligns with the 100% Fibonacci Projection level, making it a strong potential barrier for further price advancement.
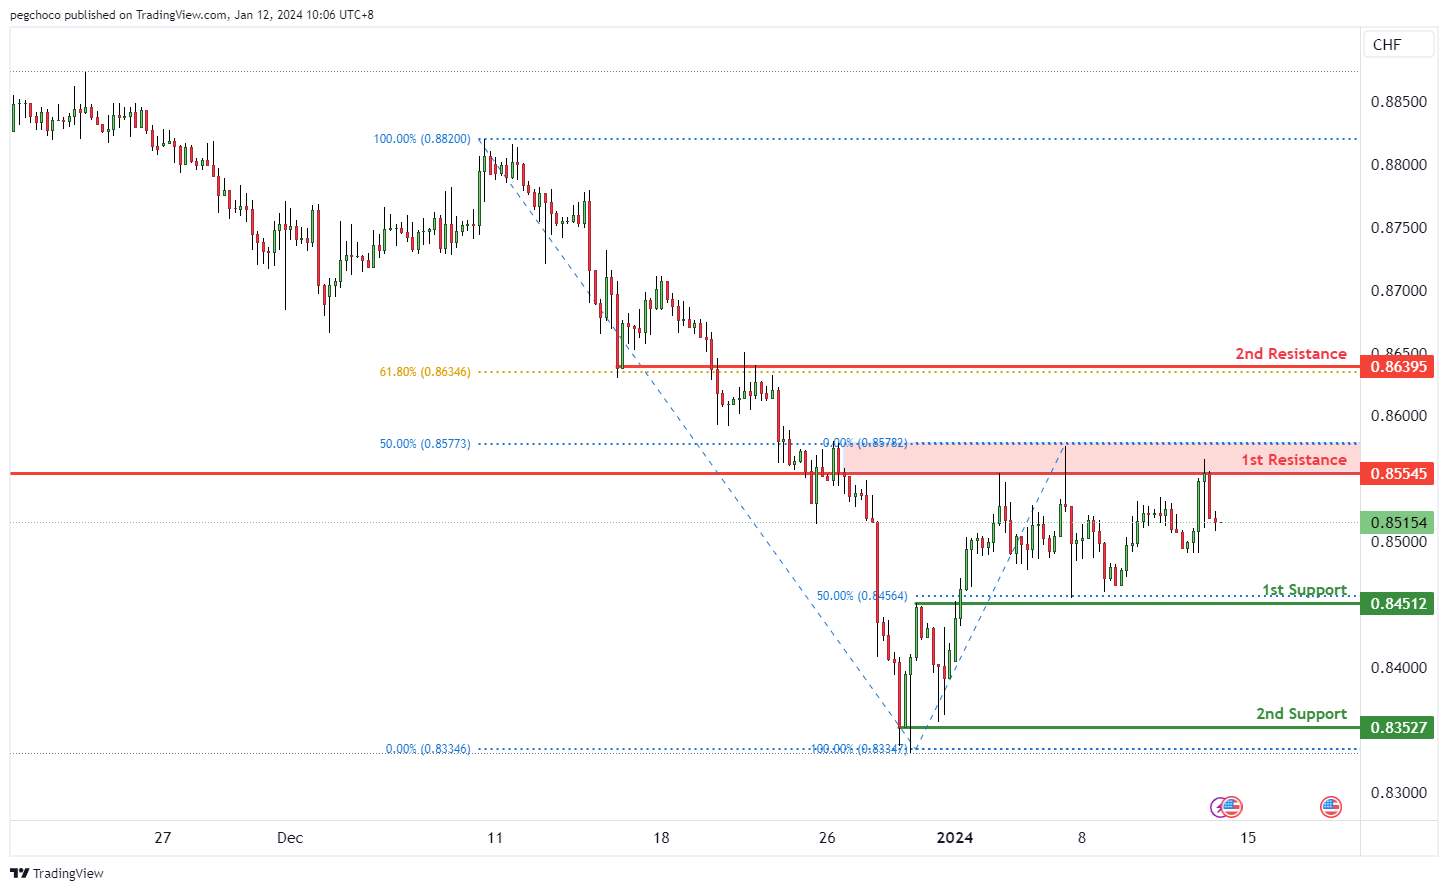
USD/CHF:
The USD/CHF chart currently exhibits a bearish overall momentum, suggesting a stronger Swiss Franc compared to the US Dollar. There is potential for a bearish continuation towards the 1st support level.
The 1st support at 0.8451 is considered an overlap support and aligns with the 50% Fibonacci Retracement level. This confluence of technical factors makes it a significant potential support zone, where selling pressure may temporarily abate, providing a potential bounce for USD/CHF.
The 2nd support at 0.8352 is categorized as multi-swing low support, further reinforcing its importance as a potential support area.
On the resistance side, the 1st resistance at 0.8554 is marked as an overlap resistance and coincides with the 50% Fibonacci Retracement level, making it a strong potential barrier for the price.
The 2nd resistance at 0.8639 is categorized as an overlap resistance and aligns with the 61.80% Fibonacci Retracement level, adding to its significance as a potential point of reversal or resistance.
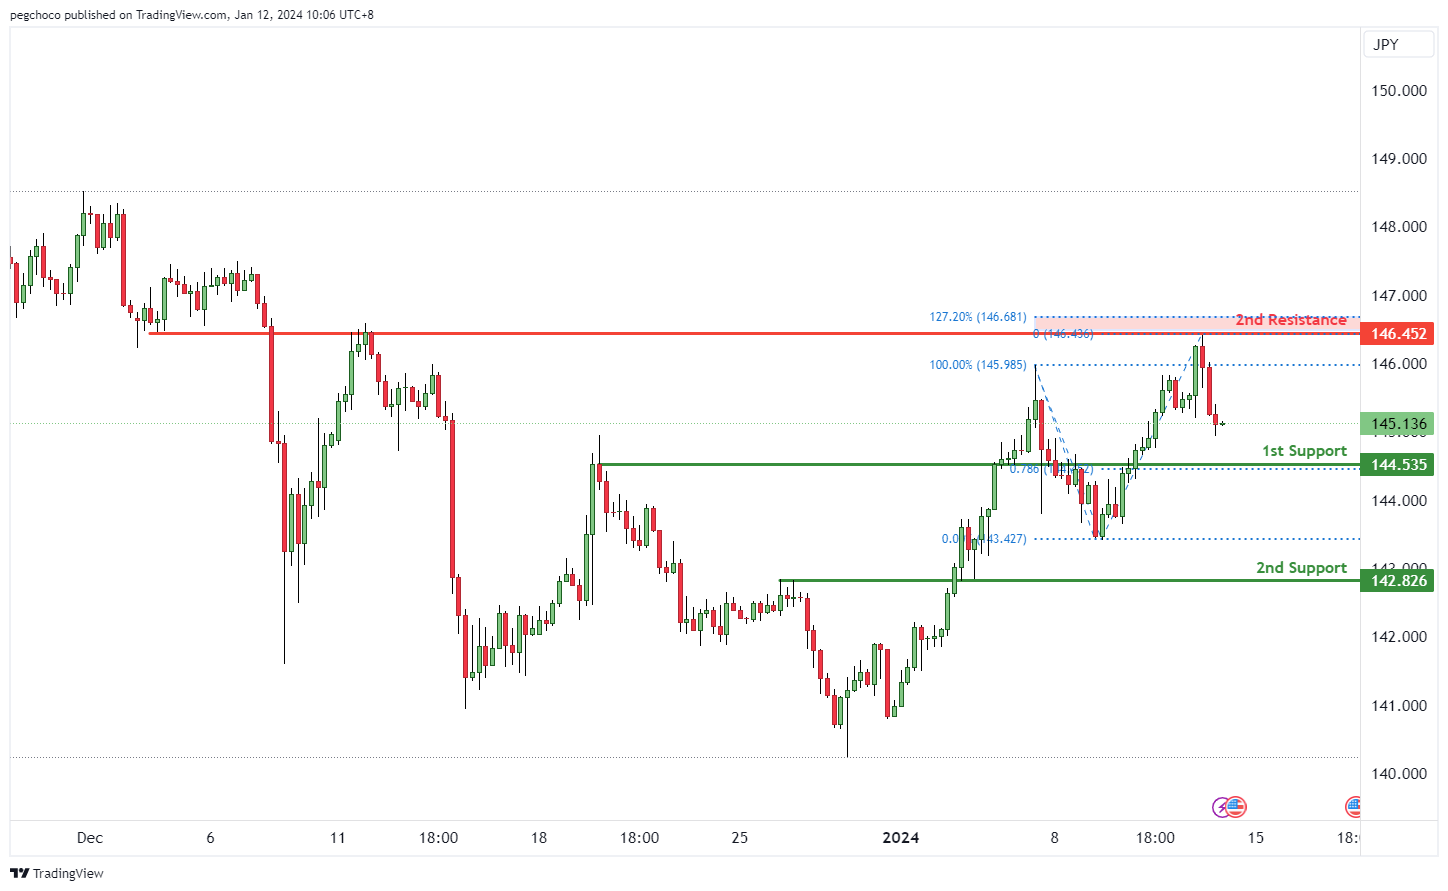
USD/JPY:
The USD/JPY chart currently displays a bearish overall momentum, indicating a weaker US Dollar compared to the Japanese Yen. This momentum suggests the potential for a bearish continuation towards the 1st support level.
The 1st support at 142.75 is identified as a pullback support and aligns with the 50% Fibonacci Retracement level. This level is significant as it suggests a potential area where buying interest may emerge, providing temporary support for USD/JPY.
The 2nd support at 140.73 is categorized as multi-swing low support, further reinforcing its significance as a potential support zone.
On the resistance side, the 1st resistance at 145.34 is marked as a swing high resistance. Swing highs often act as points of reversal or resistance in price movement.
The 2nd resistance at 146.56 is categorized as an overlap resistance, adding to its significance as a potential barrier for the price.’
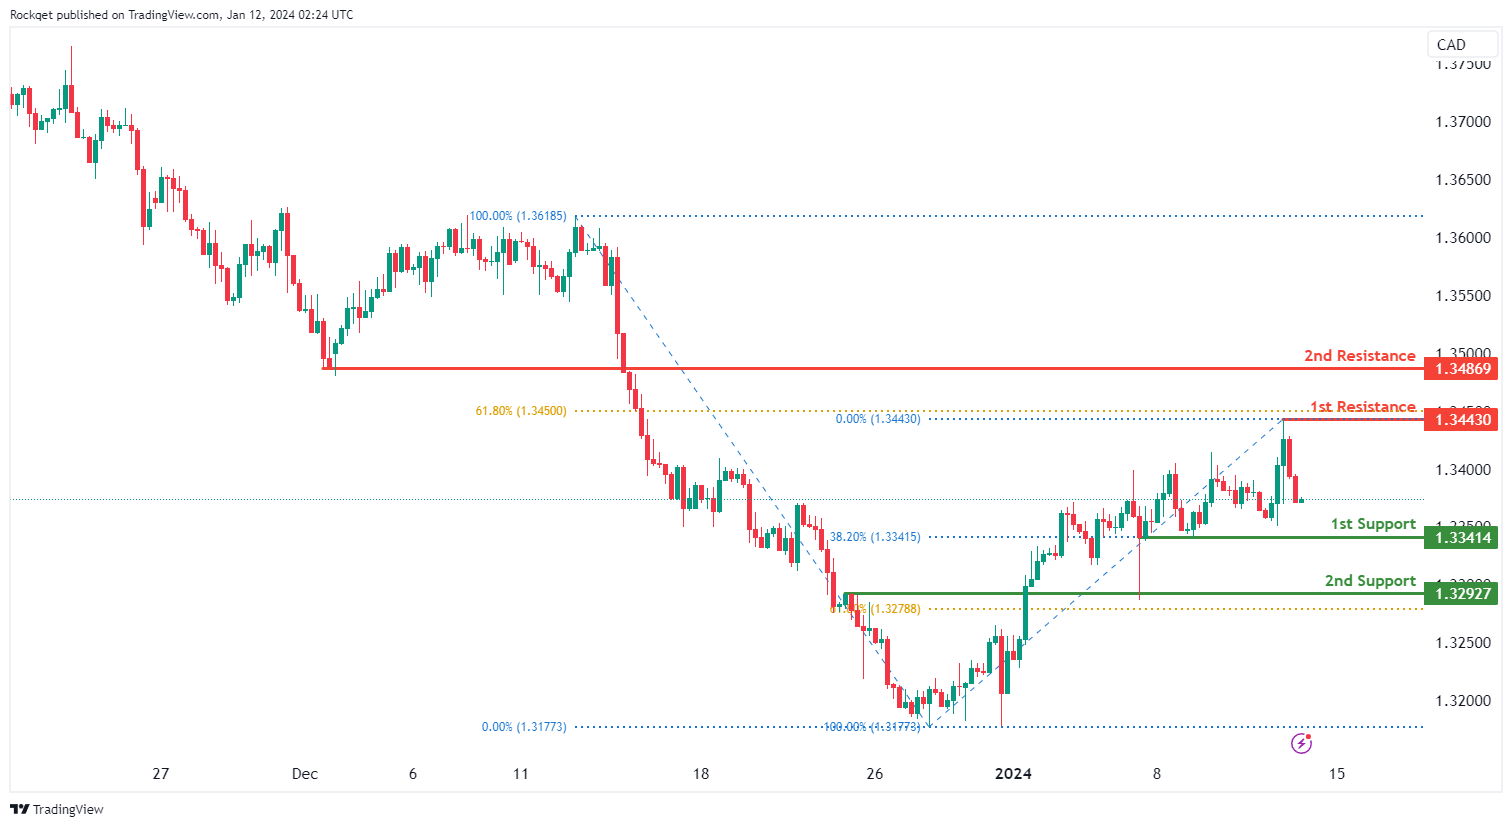
USD/CAD:
The USD/CAD chart currently exhibits an overall bullish momentum. However, there is a potential scenario for price to fall towards the 1st support before making a bullish bounce.
The 1st support level at 1.3341 is identified as a pullback support that aligns with the 38.20% Fibonacci retracement level. Further below, the 2nd support level at 1.3292 is marked as an overlap support that aligns close to the 61.80% Fibonacci retracement level, further reinforcing its importance as a key support level.
To the upside, the 1st resistance level at 1.3443 is identified as a pullback resistance that aligns close to the 61.80% Fibonacci retracement level. Higher up, the 2nd resistance level at 1.3486 is also noted as a pullback resistance, further reinforcing its significance as a potential resistance zone.
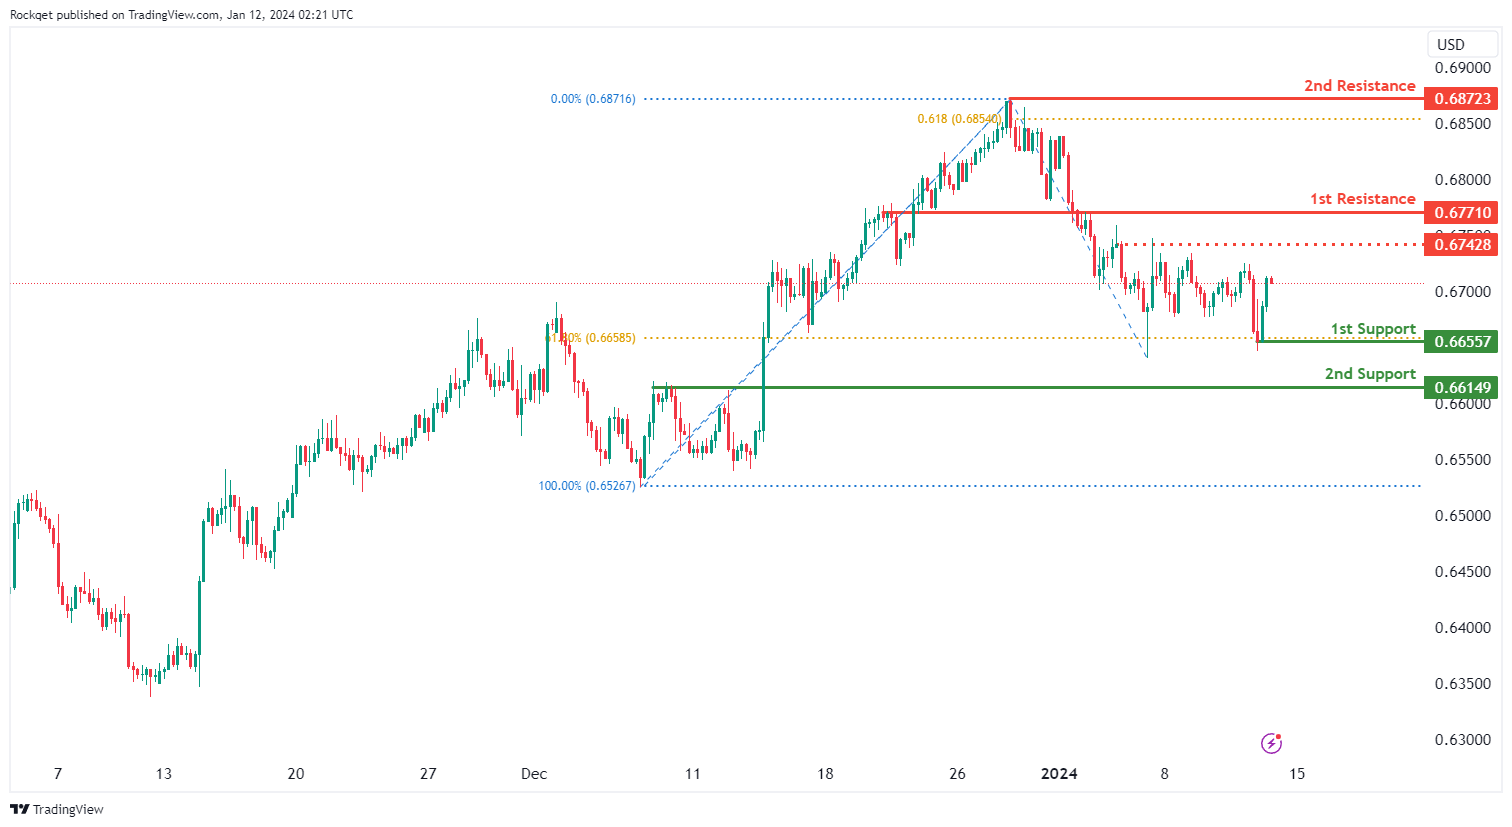
AUD/USD:
The AUD/USD chart currently exhibits a neutral bias. However, there is a potential scenario for price to make a bullish rise towards the 1st resistance should it break above the intermediate resistance.
The intermediate resistance level at 0.6742 is identified as a pullback resistance while the 1st resistance level at 0.6771 is identified as an overlap resistance. Higher up, the 2nd resistance level at 0.6872 is noted as a swing-high resistance that aligns close to the 61.80% Fibonacci projection level, suggesting a potential barrier for further upside movement.
To the downside, the 1st support level at 0.6655 is identified as a pullback support that aligns with the 61.80% Fibonacci retracement level. Further below, the 2nd support level at 0.6614 is also marked as an pullback support, further reinforcing its importance as a key support level.
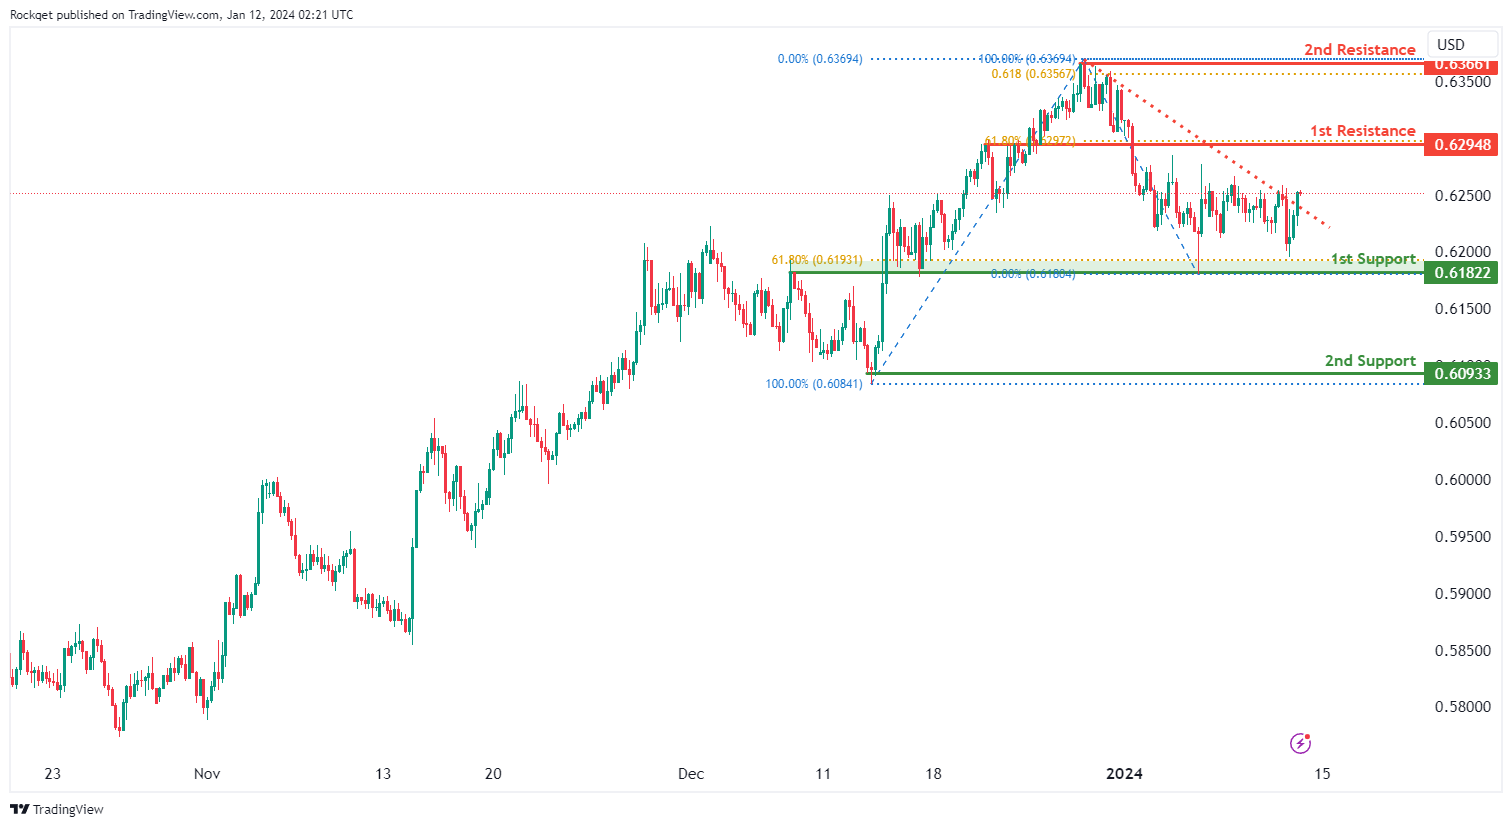
NZD/USD
The NZD/USD chart currently exhibits a neutral bias. However, there is a potential scenario for price to make a bullish rise towards the 1st resistance should it break above the descending trendline.
The 1st resistance level at 0.6294 is identified as an overlap resistance that aligns with the 61.80% Fibonacci retracement level. Higher up, the 2nd resistance level at 0.6366 is noted as a swing-high resistance that aligns close to the 61.80% Fibonacci projection level, suggesting a potential barrier for further upside movement.
To the downside, the 1st support level at 0.6182 is identified as an overlap support that aligns close to the 61.80% Fibonacci retracement level. Further below, the 2nd support level at 0.6093 is marked as a swing-low support, further reinforcing its importance as a key support level.
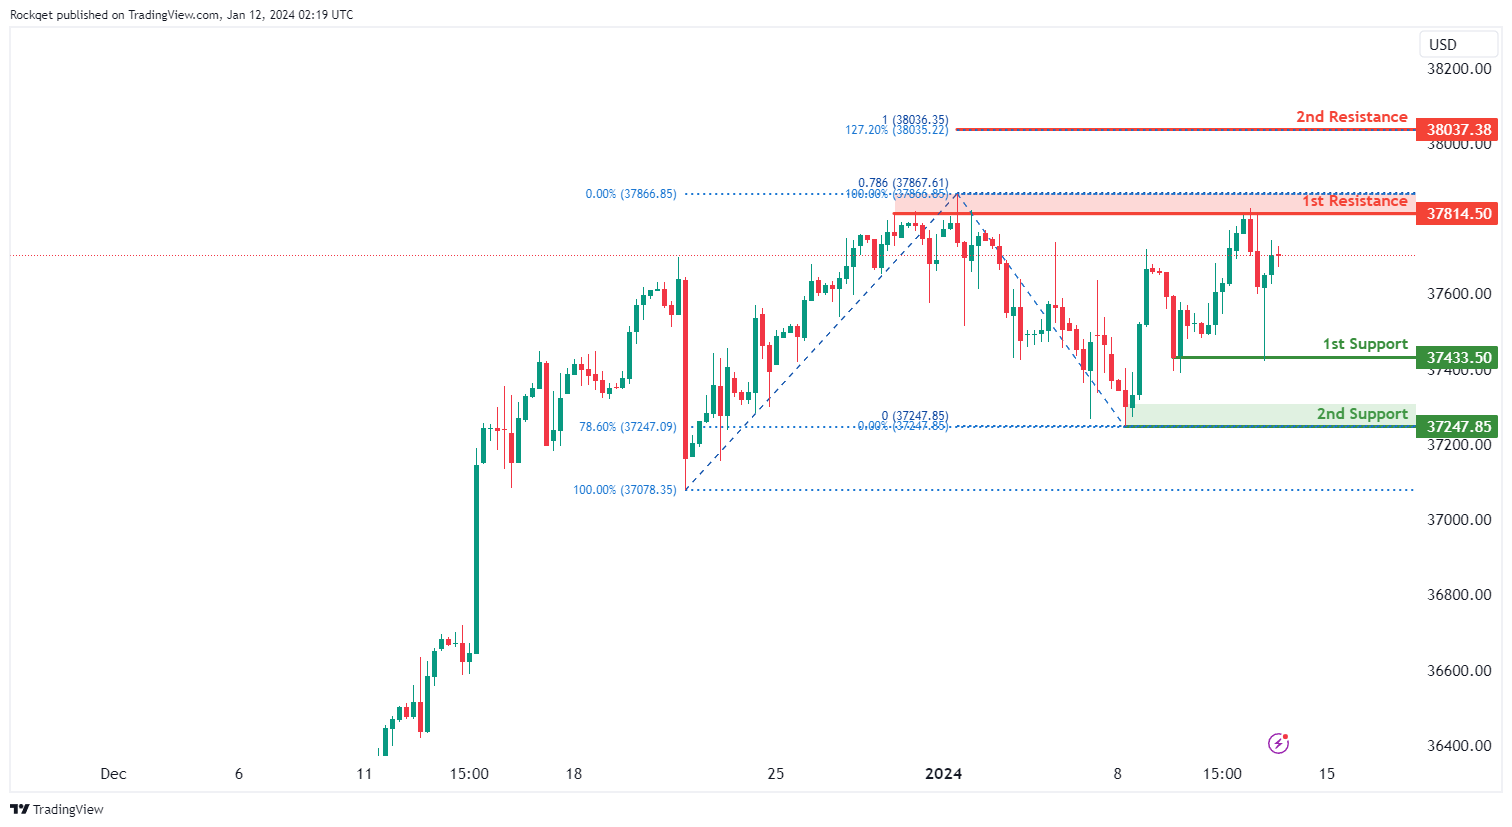
DJ30:
The DJ30 chart currently displays an overall bullish momentum. In this context, there is a potential scenario for price to make a bullish continuation towards the 1st resistance.
The 1st resistance level at 37,814.50 is identified as a pullback resistance that aligns close to the 78.60% Fibonacci projection level. Higher up, the 2nd resistance level at 38,037.38 is recognized as a resistance that aligns with a confluence of Fibonacci levels i.e. the 127.20% extension and the 100.00% projection, adding significance to this potential resistance level.
On the support side, the 1st support level at 37,433.50 is identified as a pullback support. Further below, the 2nd support level at 37,247.85 is also recognized as a pullback support that aligns with the 78.60% Fibonacci retracement level, further adding to its potential as a key support zone.
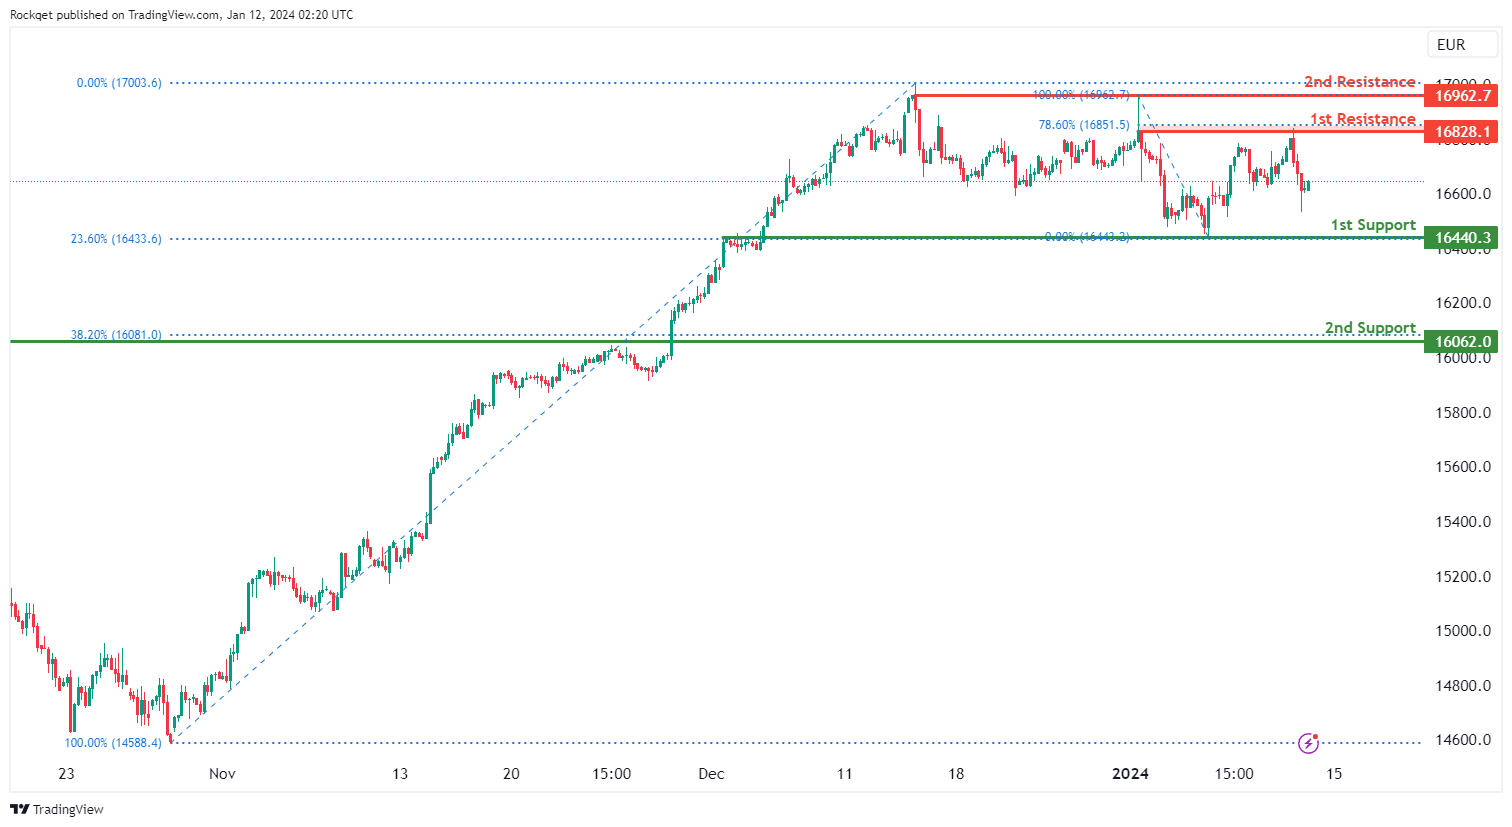
GER40:
The GER40 chart currently displays an overall bullish momentum. In this context, there is a potential scenario for price to make a bullish continuation towards the 1st resistance.
The 1st resistance level at 16,828.10 is identified as a pullback resistance that coincides with the 78.60% Fibonacci retracement level. Higher up, the 2nd resistance level at 16,962.70 is also noted as a pullback resistance, further reinforcing its potential as a barrier to upward movement.
On the support side, the 1st support level at 16,440.30 is identified as an overlap support that aligns with the 23.60% Fibonacci retracement level. The 2nd support level at 16,062.00 is recognized as a pullback support that aligns with the 38.20% Fibonacci retracement level, adding to its potential significance as a level of historical importance.
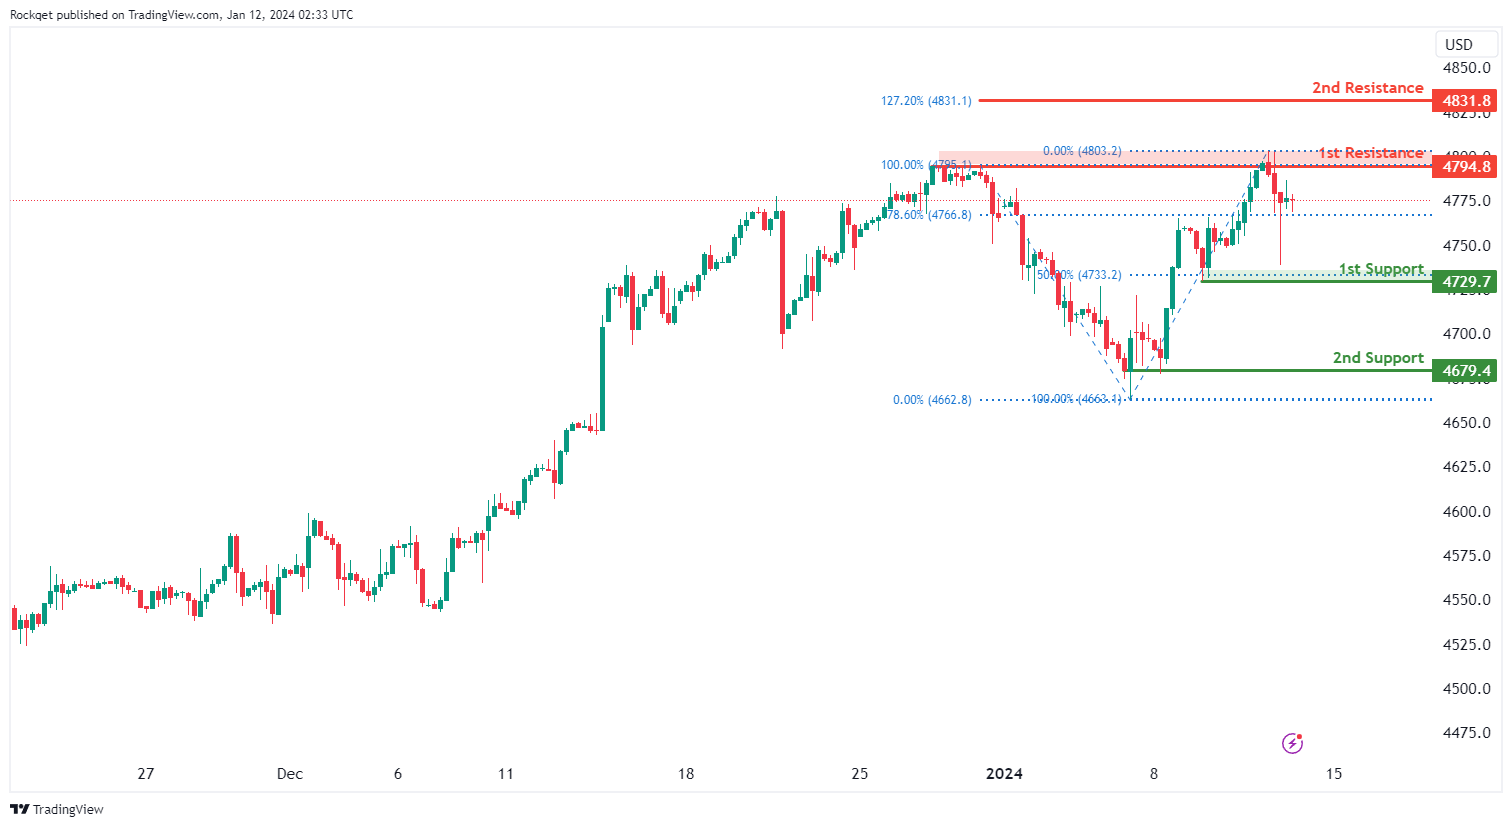
US500:
The US500 chart currently displays an overall bullish momentum. In this context, there is a potential for price to make a bullish continuation towards the 1st resistance.
The 1st resistance level at 4,794.80 is identified as a pullback resistance. Higher up, the 2nd resistance level at 4,831.80 is identified as a resistance that aligns with the 127.20% Fibonacci extension level.
On the support side, the 1st support level at 4,729.70 is identified as a pullback support that aligns with the 50.00% Fibonacci retracement level. Further below, the 2nd support level at 4,679.40 is recognized as a swing-low support, adding to its potential as a support level.’
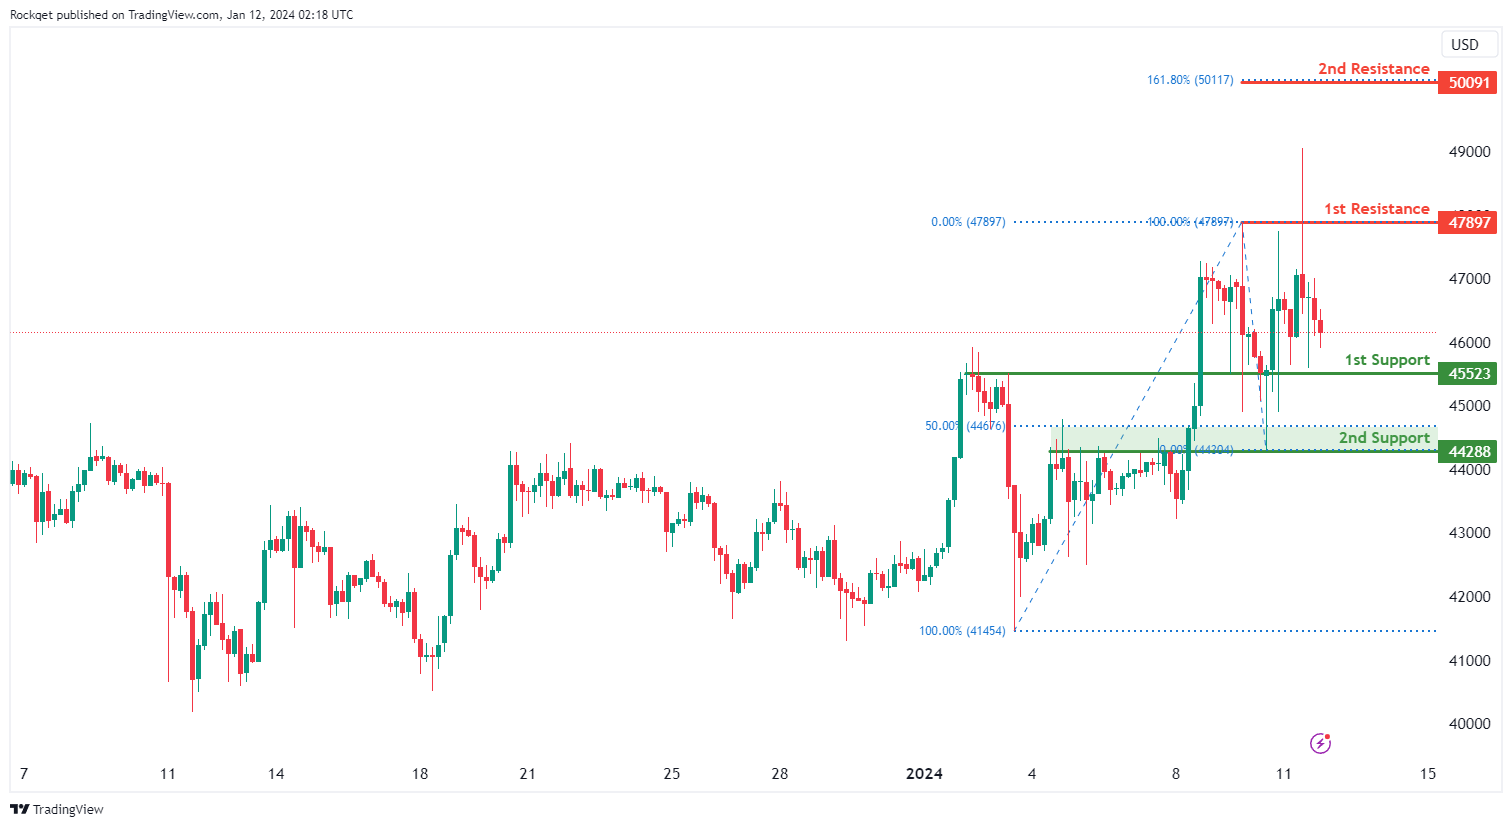
BTC/USD:
The BTC/USD chart currently exhibits a neutral bias, indicating a potential for price to fluctuate between the 1st resistance and the 1st support.
The 1st support level at 45,523 is identified as an overlap support. Further below, the 2nd support level at 44,288 is also recognized as an overlap support that aligns close to the 50.00% Fibonacci retracement level, adding to its potential as a key support.
On the resistance side, the 1st resistance level at 47,897 is identified as a pullback resistance. Higher up, the 2nd resistance level at 50,091 is recognized as a resistance that aligns with the 161.80% Fibonacci extension level, suggesting a level where selling interest could materialize.
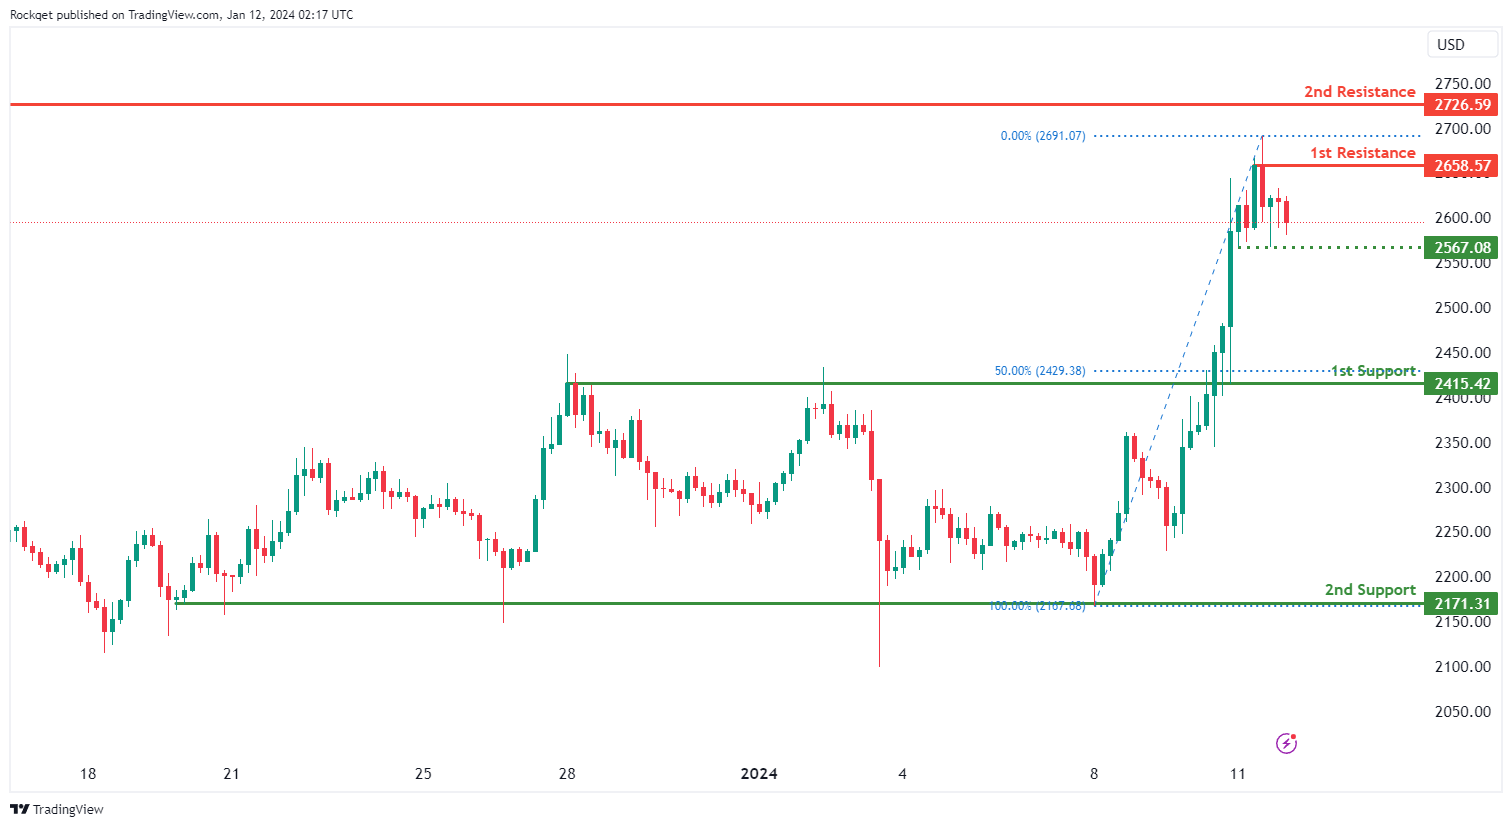
ETH/USD:
The ETH/USD chart currently exhibits an overall bullish momentum. However, there is a potential scenario for price to fall towards the intermediate support before making a bullish bounce.
The intermediate support level at 2,567.08 is identified as a pullback support while the 1st support level at 2,415.42 is also noted as a pullback support that aligns close to the 50.00% Fibonacci retracement level. Further below, the 2nd support level at 2,171.31 is recognized as a multi-swing-low support, adding to its potential as a key support.
On the resistance side, the 1st resistance level at 2,658.57 is identified as a pullback resistance. Higher up, the 2nd resistance level at 2,726.59 is also recognized as a pullback resistance, suggesting a potential barrier for further upside movement.
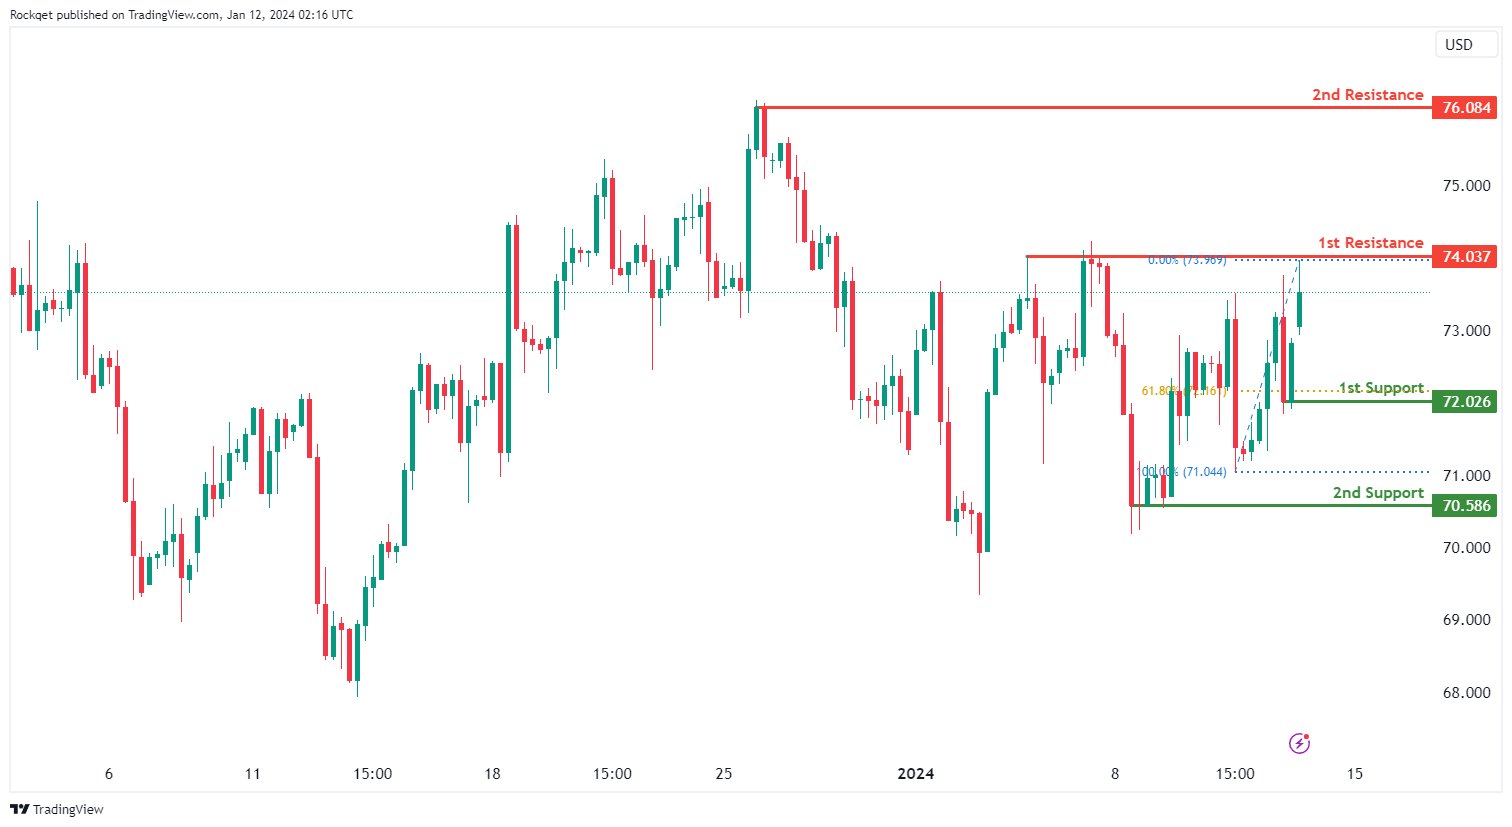
WTI/USD:
The WTI (West Texas Intermediate) chart currently exhibits a neutral bias, indicating a potential for price to fluctuate between the 1st resistance and the 1st support.
The 1st resistance level at 74.03 is identified as a pullback resistance. Higher up, the 2nd resistance level at 76.08 is noted as a swing-high resistance, suggesting a potential barrier for further upside movement.
To the downside, the 1st support level at 72.02 is identified as a pullback support that aligns close to the 61.80% Fibonacci retracement level. Further below, the 2nd support level at 70.58 is also marked as a pullback support, further reinforcing its importance as a key support level.
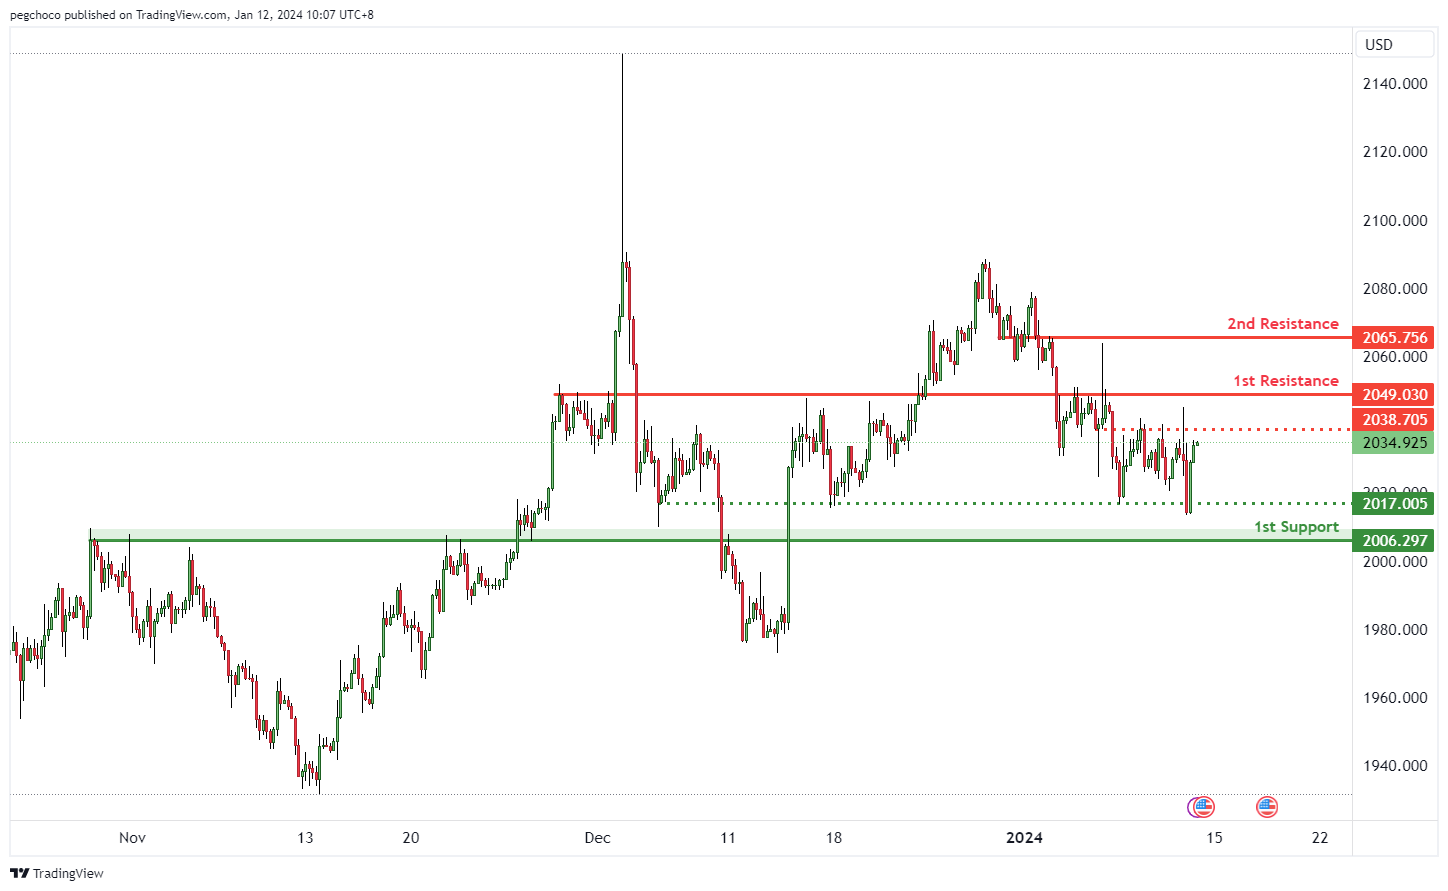
XAU/USD (GOLD):
The XAU/USD chart currently exhibits a bearish overall momentum, suggesting weakness in the price of Gold relative to the US Dollar. This momentum indicates the potential for a bearish reaction off the 1st resistance level, followed by a drop towards the 1st support level.
The 1st support at 2006.29 is identified as a pullback support, indicating a level where buyers might step in, providing temporary support for the XAU/USD pair.
There is also an intermediate support at 2017.00, which is categorized as a multi-swing low support, further reinforcing its significance as a potential support area.
On the resistance side, the 1st resistance at 2049.03 is considered an overlap resistance, suggesting a potential area where selling interest may emerge, leading to a bearish reaction.
The 2nd resistance at 2065.75 is another overlap resistance, indicating a potential barrier to further price advancement.
Additionally, there is an intermediate resistance at 2038.44, marked as an overlap resistance, further adding to the potential resistance levels for XAU/USD.


