
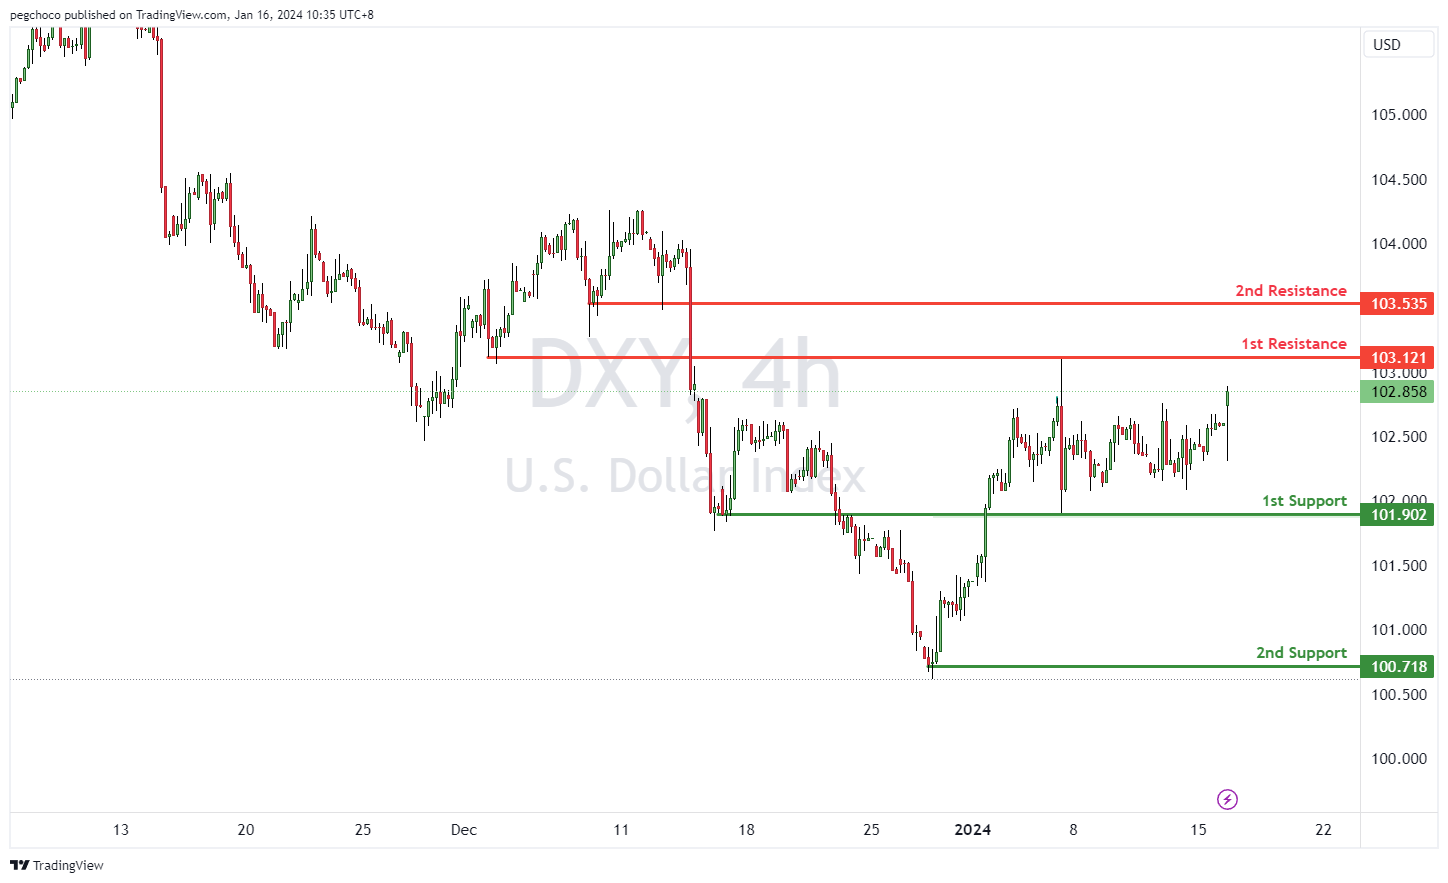
DXY:
The DXY (US Dollar Index) chart currently exhibits a neutral overall momentum, suggesting a lack of a clear directional bias in the US Dollar.
Price could potentially fluctuate between the 1st support and 1st resistance levels. Here are the identified support and resistance levels:
1st support at 101.90 is identified as an overlap support, and it may provide a potential area where buying interest could emerge, temporarily supporting the US Dollar.
2nd support at 100.71 is categorized as a swing low support, further reinforcing its significance as a potential support level.
On the resistance side, 1st resistance at 103.12 is marked as an overlap resistance, and it could act as a barrier for any potential upward price movement.
2nd resistance at 103.53 is categorized as pullback resistance, adding to its significance as a potential resistance level.
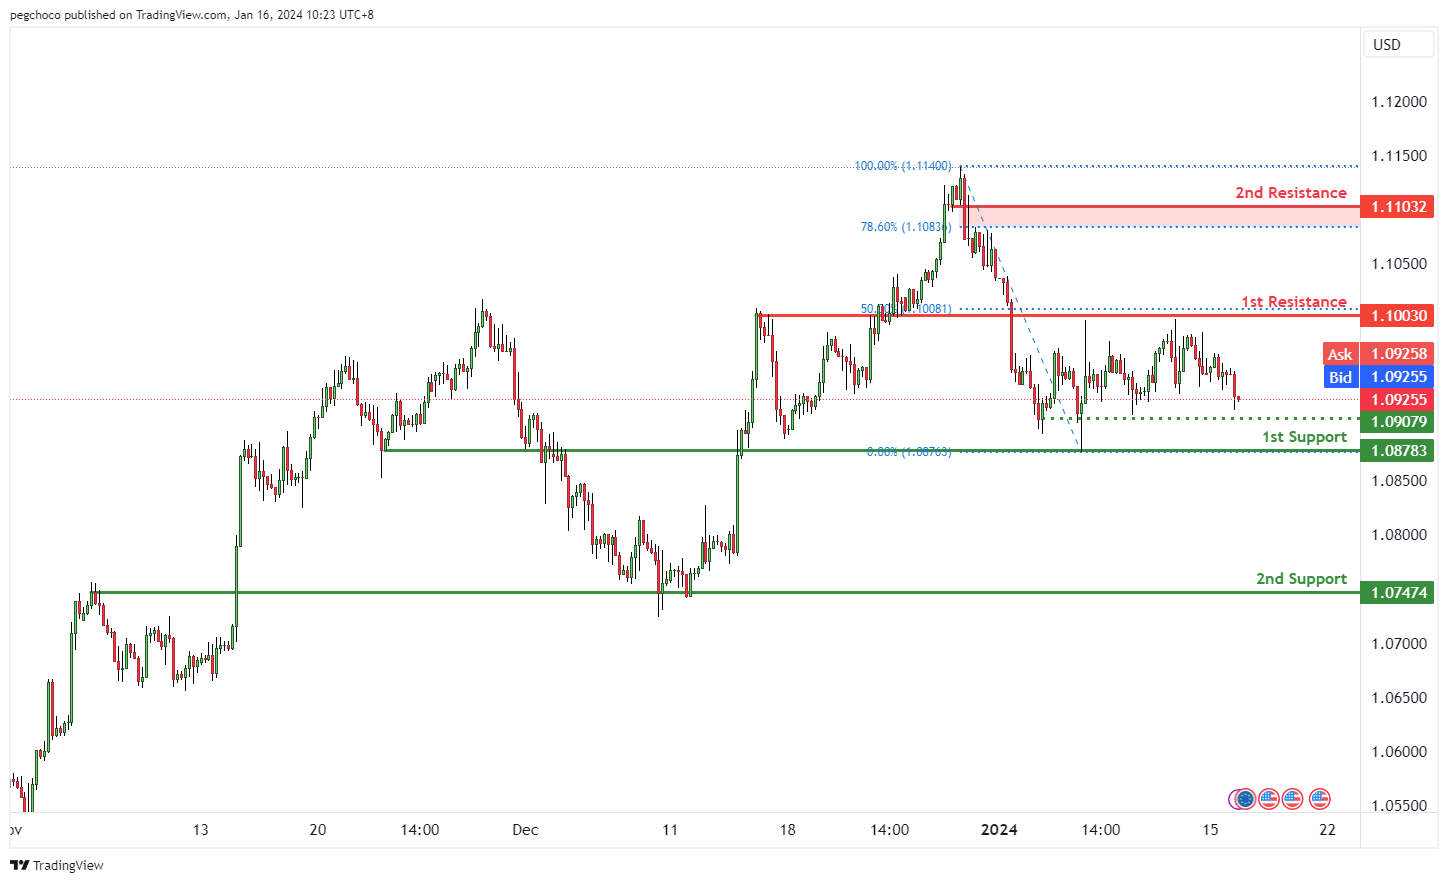
EUR/USD:
The EUR/USD chart currently exhibits a bearish overall momentum, suggesting weakness in the Euro relative to the US Dollar.
Price could potentially make a bearish continuation towards the 1st support level.
Here are the identified support and resistance levels:
1st support at 1.0878 is categorized as an overlap support, and it may serve as a potential area where buying interest could emerge, providing temporary support for EUR/USD.
2nd support at 1.0747 is also identified as an overlap support, reinforcing its significance as a potential support zone.
On the resistance side, 1st resistance at 1.1003 is marked as an overlap resistance and could act as a barrier for any potential upward price movement.
2nd resistance at 1.1103 is categorized as pullback resistance, adding to its significance as a potential resistance level.
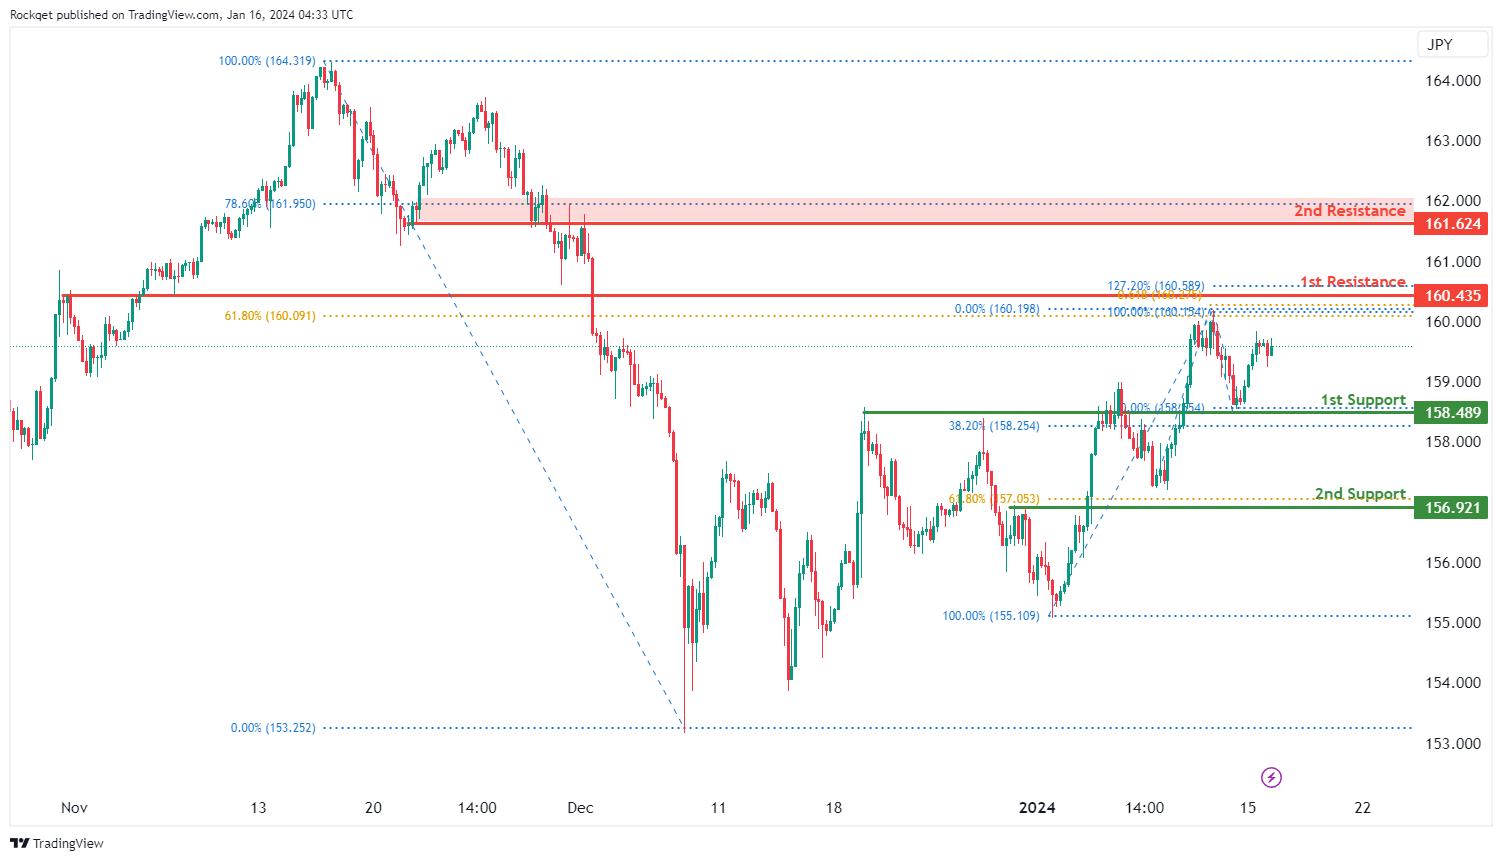
EUR/JPY:
The EUR/JPY chart currently displays a bullish overall momentum, indicating an upward trend. There is a potential scenario for a bullish continuation towards the 1st resistance.
The 1st support at 158.49 is considered favorable due to its identification as an overlap support and coincides with the 38.20% Fibonacci Retracement, suggesting historical significance as a level where buying interest has previously emerged.
The 2nd support at 156.92 is recognized as a pullback support and aligns with the 61.80% Fibonacci Retracement, adding confluence to its potential as a support level.
On the resistance side, the 1st resistance at 160.44 is identified as an overlap resistance and aligns with the 61.80% Fibonacci Retracement and the 61.80% Fibonacci Projection, adding significance to this potential resistance level.
The 2nd resistance at 161.62 is noteworthy for the presence of an overlap resistance and the 78.60% Fibonacci level, reinforcing its importance as a potential resistance.
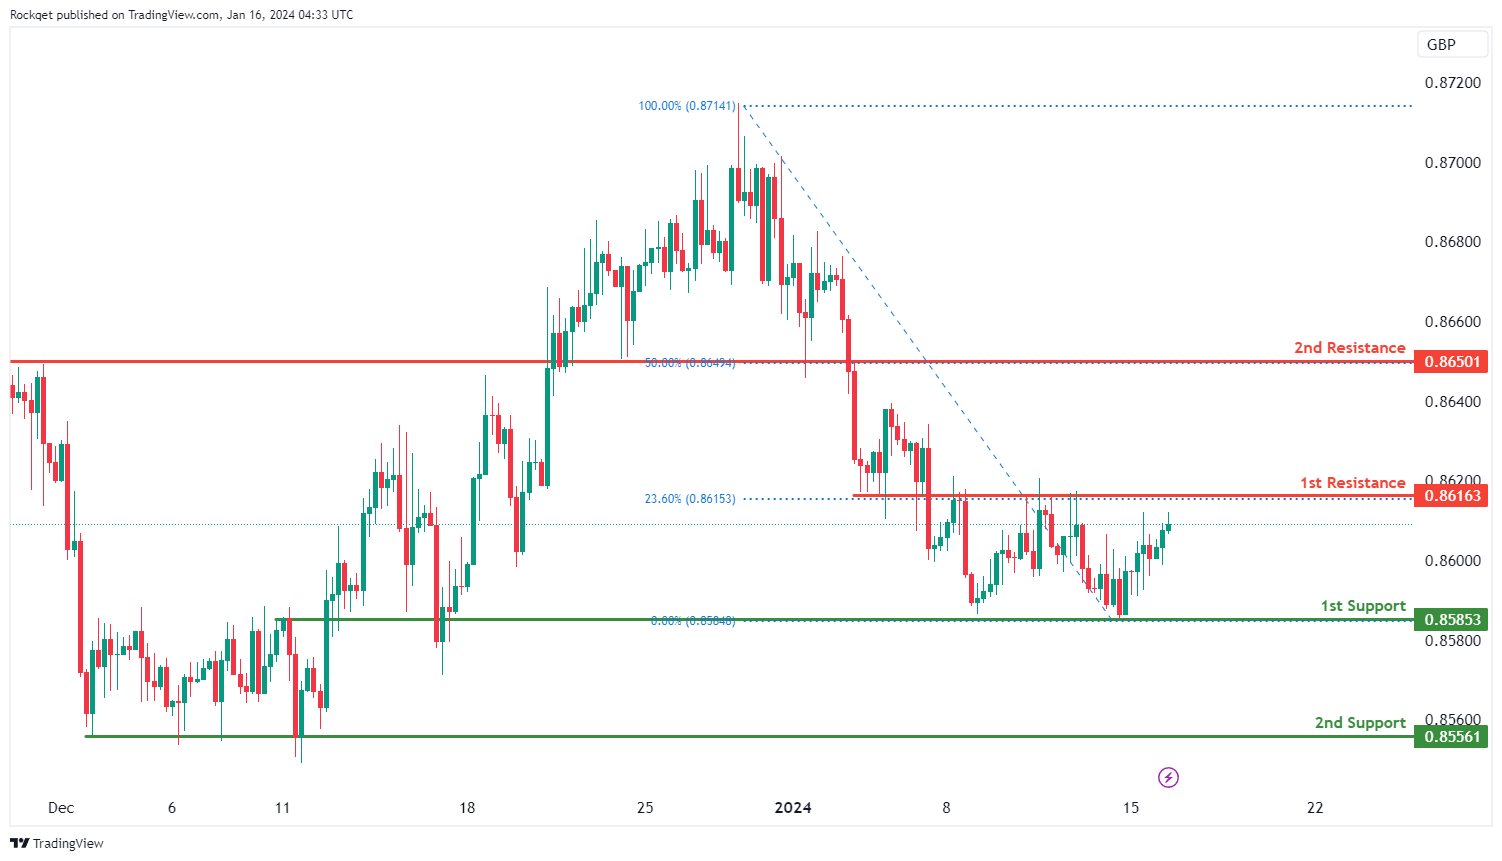
EUR/GBP:
The EUR/GBP chart currently exhibits a bullish overall momentum, indicating an upward trend. Price has the potential to make a bullish continuation towards the 1st resistance.
The 1st support at 0.8585 is considered favorable as it is identified as an overlap support, suggesting historical significance as a level where buying interest has previously emerged.
The 2nd support at 0.8556 is recognized as a multi-swing low support, adding additional strength to its potential as a support level.
On the resistance side, the 1st resistance at 0.8618 is identified as an overlap resistance and aligns with the 23.60% Fibonacci Retracement, adding significance to this potential resistance level.
The 2nd resistance at 0.8650 is also an overlap resistance, further supporting its importance as a potential barrier.
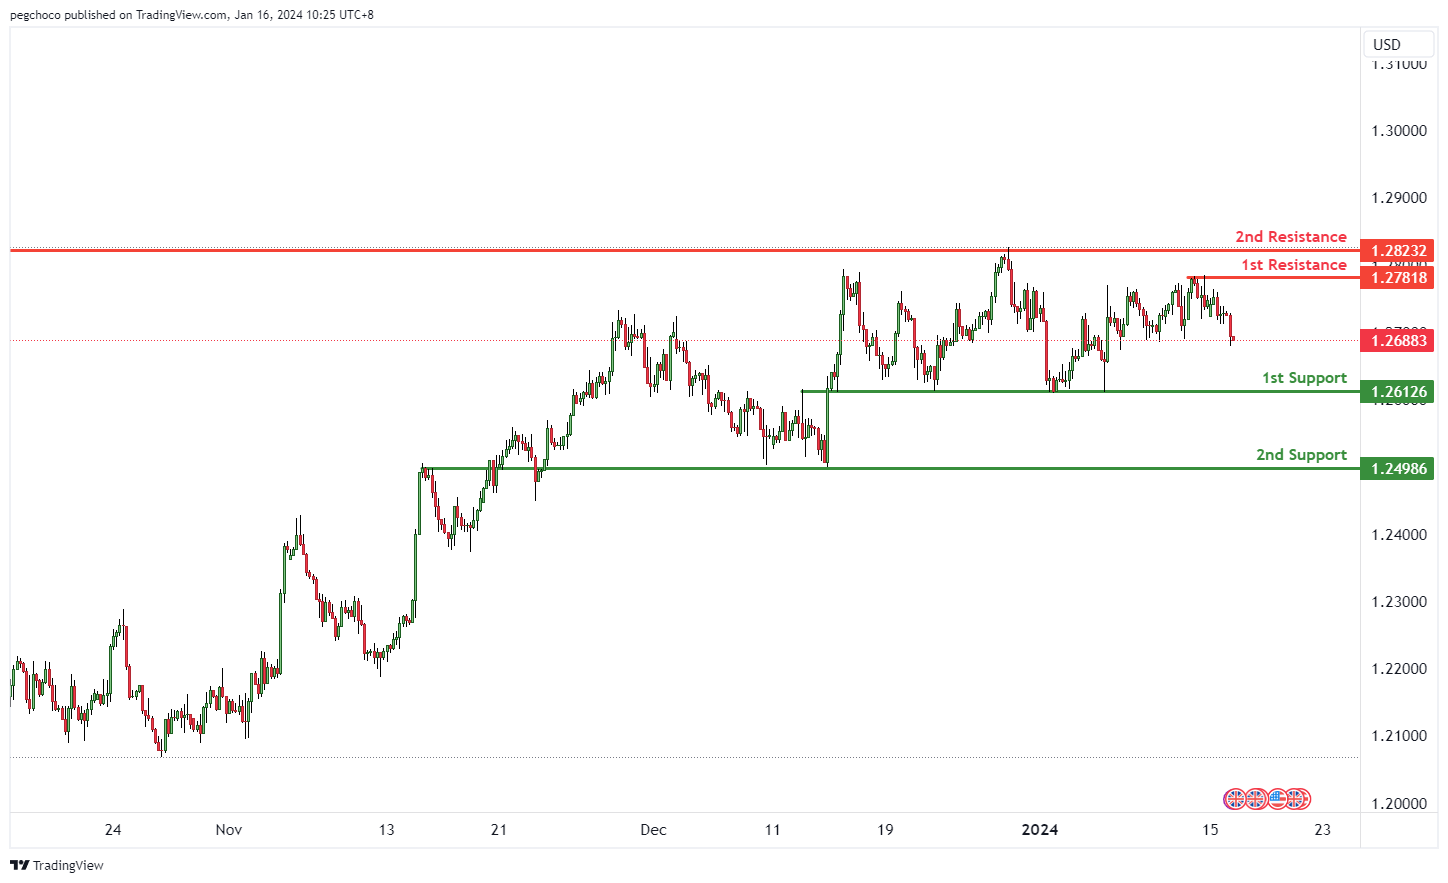
GBP/USD:
The GBP/USD chart currently exhibits a bearish overall momentum, suggesting weakness in the British Pound relative to the US Dollar.
Price could potentially make a bearish continuation towards the 1st support level.
Here are the identified support and resistance levels:
1st support at 1.2612 is categorized as an overlap support, and it may serve as a potential area where buying interest could emerge, providing temporary support for GBP/USD.
2nd support at 1.2498 is also identified as an overlap support, reinforcing its significance as a potential support zone.
On the resistance side, 1st resistance at 1.2781 is marked as a swing high resistance and could act as a barrier for any potential upward price movement.
2nd resistance at 1.2823 is also categorized as a swing high resistance, adding to its significance as a potential resistance level.
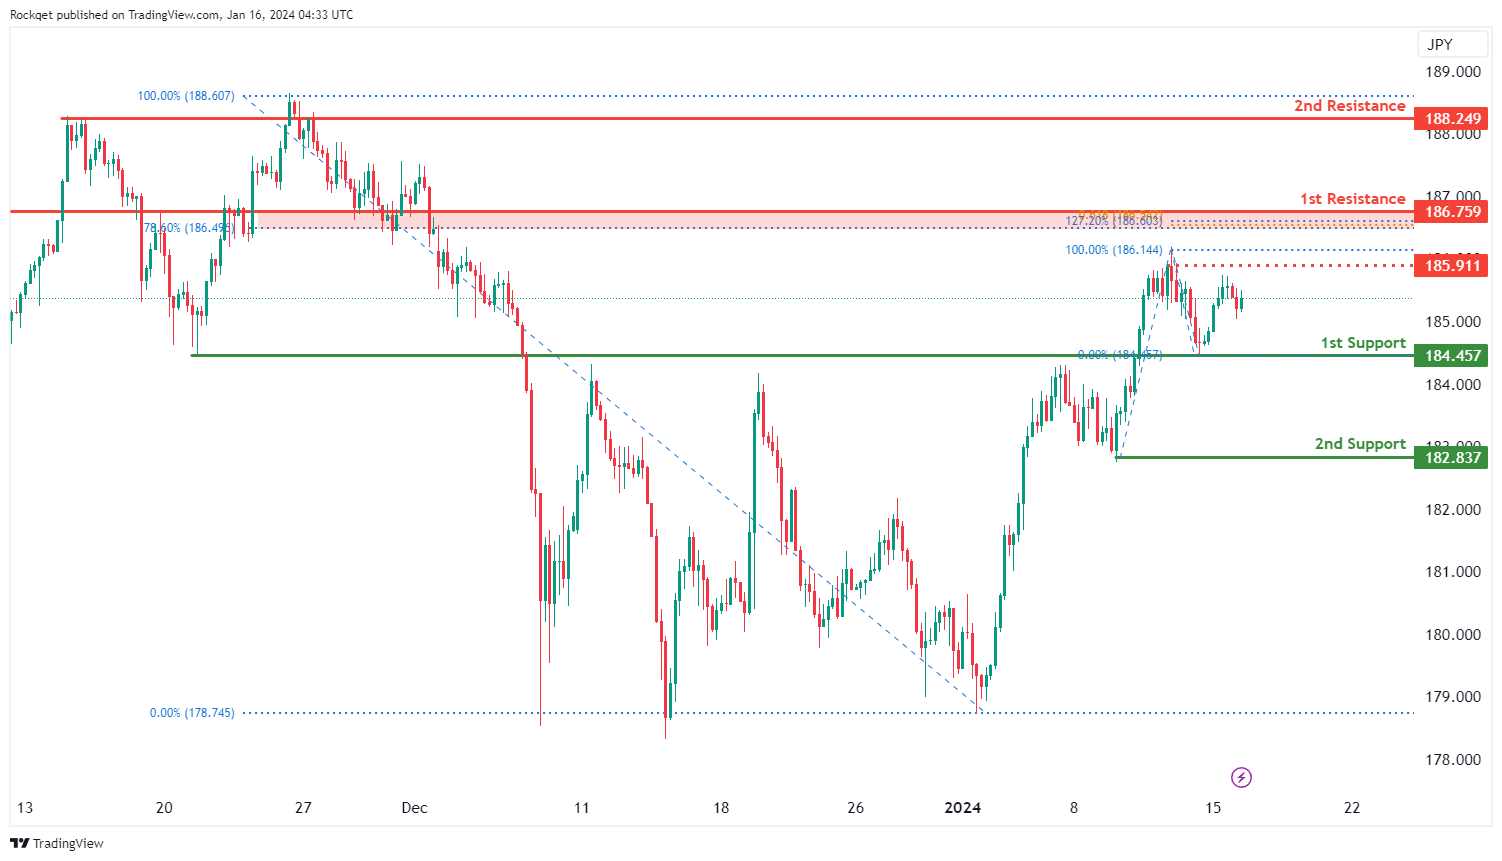
GBP/JPY:
The GBP/JPY chart currently demonstrates a bullish overall momentum, indicating an upward trend. Price has the potential to make a bullish continuation towards the 1st resistance.
The 1st support at 185.46 is considered favorable as it is identified as an overlap support, suggesting historical significance as a level where buying interest has previously emerged.
The 2nd support at 182.84 is recognized as a swing low support, adding additional strength to its potential as a support level.
On the resistance side, the 1st resistance at 186.76 is identified as a pullback resistance and aligns with the 78.60% Fibonacci Retracement, as well as the 127.20% Fibonacci Extension, adding significance to this potential resistance level.
The 2nd resistance at 188.25 is a swing high resistance, further supporting its importance as a potential barrier.There is also an intermediate resistance at 185.91, identified as a pullback resistance, contributing to the overall strength of potential resistance levels.
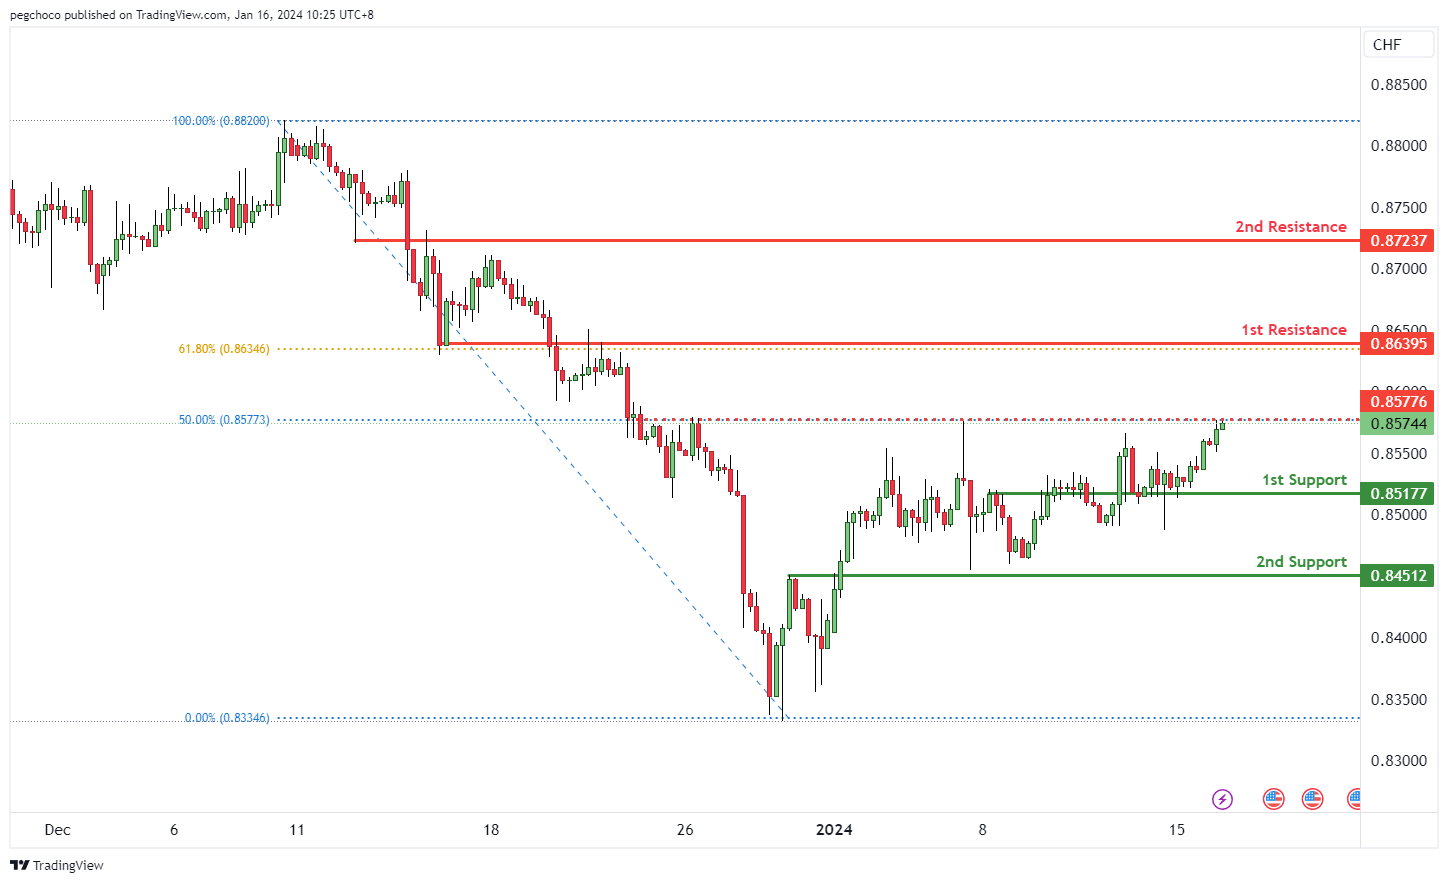
USD/CHF:
The USD/CHF chart currently exhibits a bullish overall momentum, indicating strength in the US Dollar relative to the Swiss Franc. This bullish momentum suggests the potential for a bullish continuation towards the 1st resistance level.
Here are the identified support and resistance levels:
1st support at 0.8517 is marked as an overlap support. It may serve as a potential area where buying interest could emerge, providing temporary support for USD/CHF.
2nd support at 0.8451 is also identified as an overlap support, reinforcing its significance as a potential support zone.
On the resistance side, 1st resistance at 0.8639 is categorized as an overlap resistance and is further supported by the 61.80% Fibonacci Retracement level, making it a significant barrier for potential upward price movement.
2nd resistance at 0.8723 is marked as an overlap resistance, adding to its significance as a potential resistance level.
Intermediate resistance at 0.8577 is mentioned as well, as it corresponds to the 50% Fibonacci Retracement level, which may act as a minor resistance point.
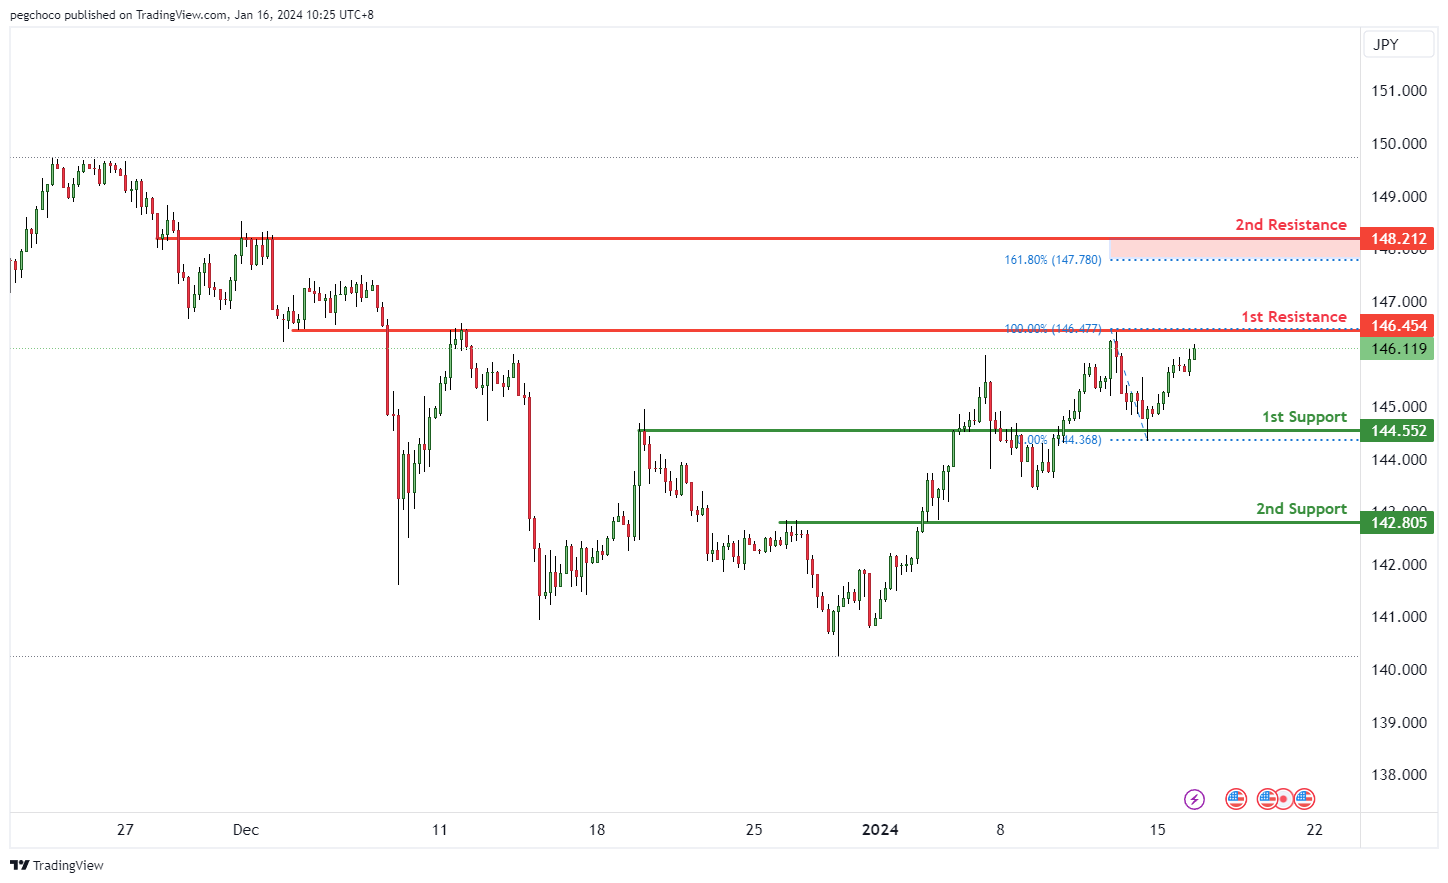
USD/JPY:
The USD/JPY chart currently exhibits a bullish overall momentum, suggesting strength in the US Dollar relative to the Japanese Yen. This bullish momentum indicates the potential for a bullish continuation towards the 1st resistance level.
Here are the identified support and resistance levels:
1st support at 144.55 is marked as an overlap support. It may act as a potential area where buying interest could emerge, providing temporary support for USD/JPY.
2nd support at 142.80 is identified as a pullback support, further reinforcing its significance as a potential support zone.
On the resistance side, 1st resistance at 146.45 is categorized as an overlap resistance, indicating a potential barrier for further upward price movement.
1st resistance at 148.21 is also marked as an overlap resistance and is supported by the 161.80% Fibonacci Extension level, making it a significant potential resistance point.
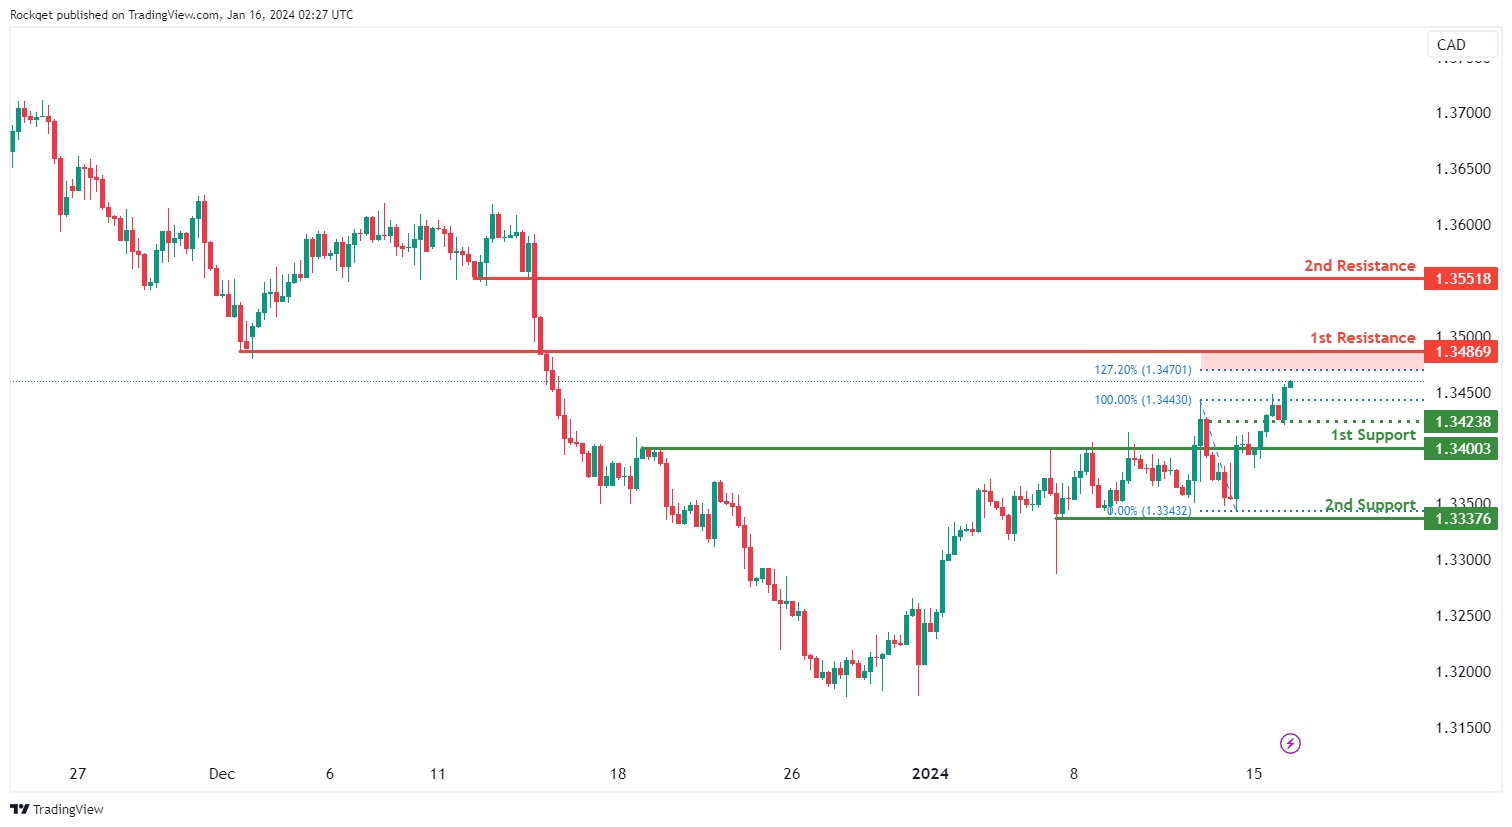
USD/CAD:
The USD/CAD chart currently exhibits an overall bullish momentum. In this context, there is a potential scenario for price to rise towards the 1st resistance.
The 1st resistance level at 1.3486 is identified as a pullback resistance that aligns close to the 127.20% Fibonacci extension level. Higher up, the 2nd resistance level at 1.3551 is also noted as a pullback resistance, further reinforcing its significance as a potential resistance zone.
To the downside, the intermediate support level at 1.3423 is identified as an overlap support while the 1st support level at 1.3400 is also noted as an overlap support. Further below, the 2nd support level at 1.3337 is marked as a pullback support, further reinforcing its importance as a key support level.
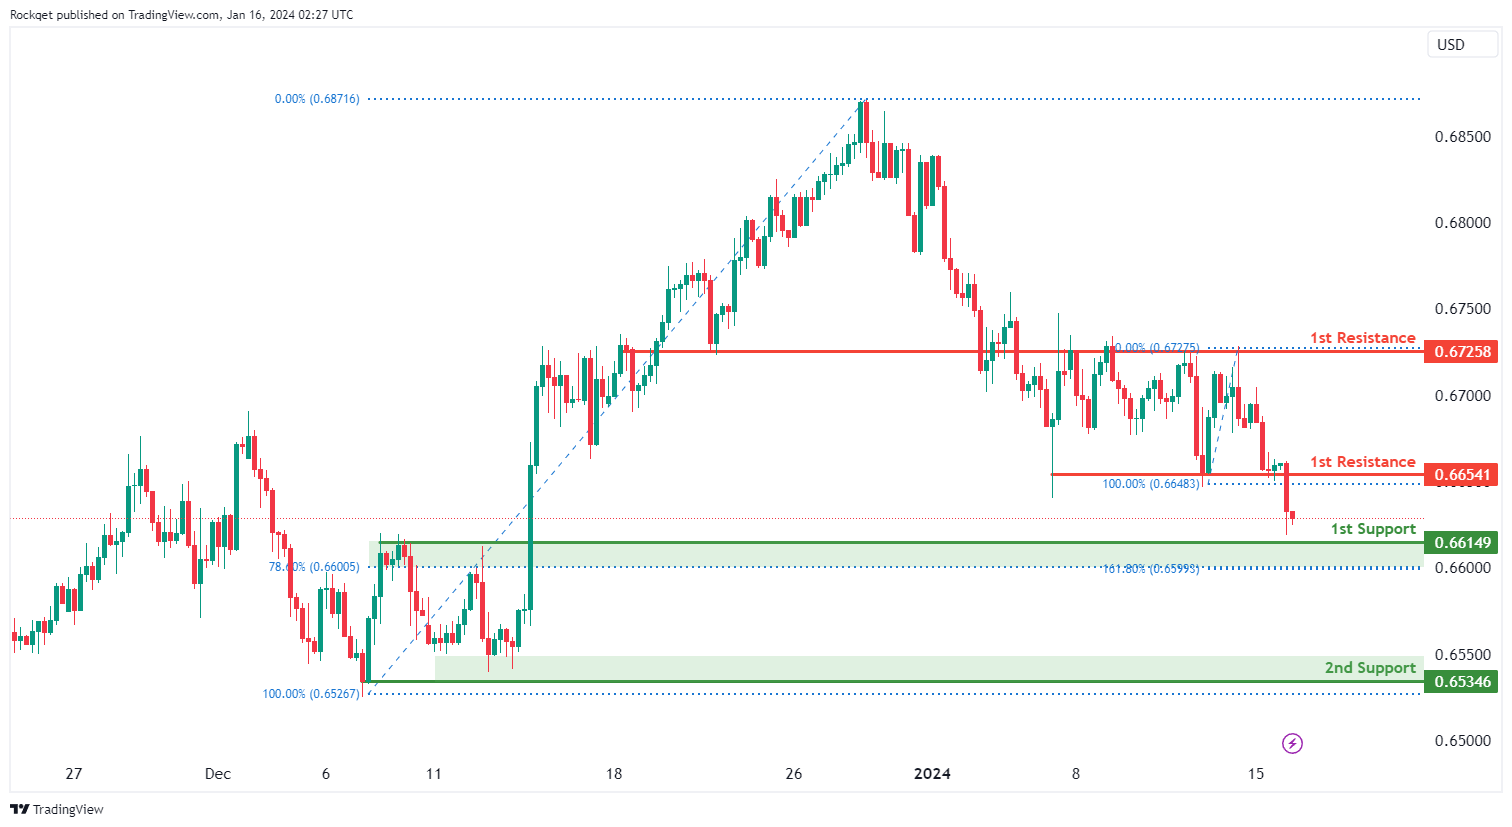
AUD/USD:
The AUD/USD chart currently exhibits an overall bearish momentum. In this context, there is a potential scenario for price to drop towards the 1st support.
The 1st support level at 0.6614 is identified as a pullback support that aligns with a confluence of Fibonacci levels i.e. the 78.60% retracement and the 161.80% extension. Further below, the 2nd support level at 0.6534 is also marked as an pullback support, further reinforcing its importance as a key support level.
To the upside, the 1st resistance level at 0.6654 is identified as a pullback resistance. Higher up, the 2nd resistance level at 0.6725 is noted as an overlap resistance, suggesting a potential barrier for further upside movement.
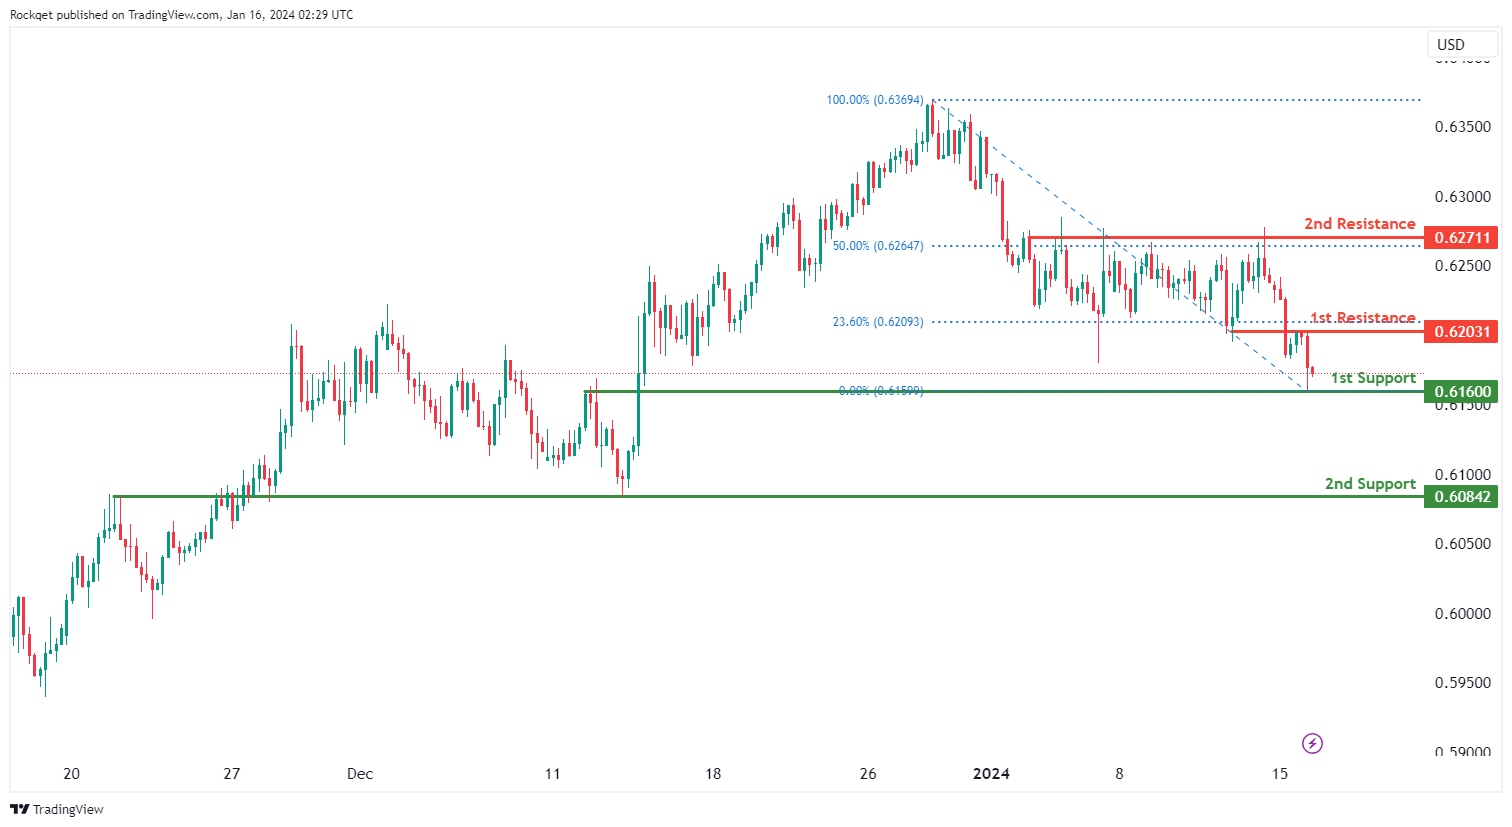
NZD/USD
The NZD/USD chart currently exhibits an overall bearish momentum. In this context, there is a potential scenario for price to drop towards the 1st support.
The 1st support level at 0.6160 is identified as an overlap support. Further below, the 2nd support level at 0.6084 is also marked as an overlap support, further reinforcing its importance as a key support level.
To the upside, the 1st resistance level at 0.6203 is identified as an overlap resistance that aligns with the 23.60% Fibonacci retracement level. Higher up, the 2nd resistance level at 0.6271 is noted as a pullback resistance that aligns with the 50.00% Fibonacci projection level, suggesting a potential barrier for further upside movement.
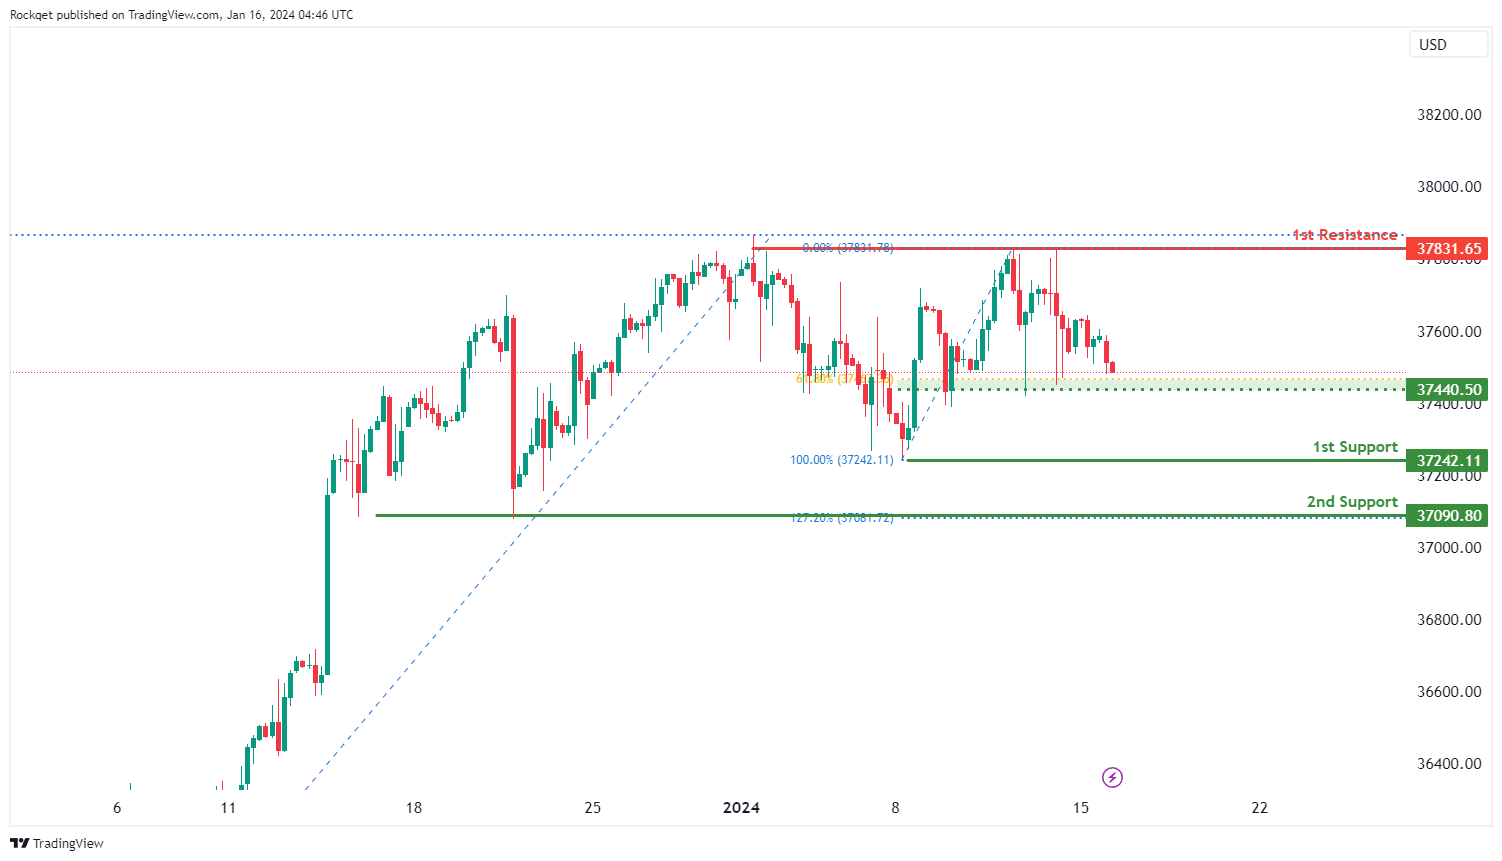
DJ30:
The DJ30 chart currently exhibits a bearish overall momentum, indicating a prevailing downward trend. There is a likelihood that the price may continue its bearish movement towards the 1st support level.
The 1st support at 37242.11 is considered significant due to its identification as a swing low support, suggesting a historical level where buying interest has previously emerged.
The 2nd support at 37090.80 is characterized as a pullback support, adding further strength to its potential as a level where buyers might step in.
On the resistance side, the 1st resistance at 37831.65 is identified as a multi-swing high resistance, indicating a historical level where selling pressure has been notable.
Intermediate support is found at 37440.50, recognized as a pullback support, and coincides with the 61.80% Fibonacci Retracement level. This convergence adds additional significance to this level as a potential area of support.
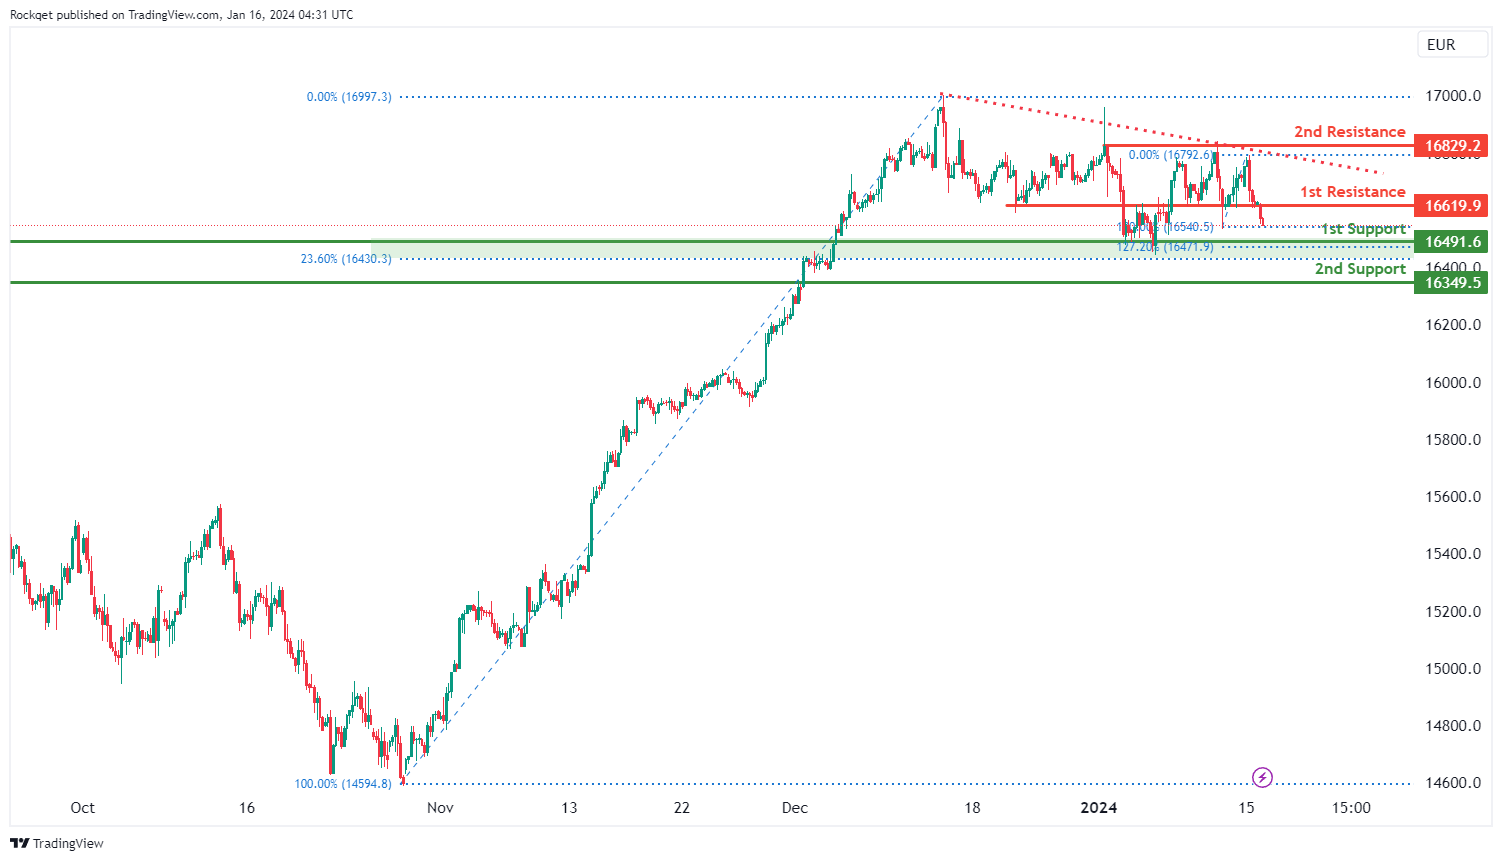
GER40:
The GER40 chart currently experiences a bearish overall momentum, with key factors contributing to this being the price positioned below a major descending trend line, indicating a predisposition towards further downward movement. Given this bearish scenario, the price could potentially continue its bearish trend towards the 1st support level.
The 1st support at 16491.60 holds significance as it is identified as an overlap support. Moreover, it aligns with both the 23.60% Fibonacci Retracement and the 127.20% Fibonacci Extension, suggesting a confluence of support levels. Traders should consider this level as it has historical importance, having acted as a level where buying interest emerged previously.
The 2nd support at 16349.50 is recognized as a pullback support, adding additional strength to its potential as a level where buyers might step in. This level should be monitored closely as it provides an additional layer of support.
On the resistance side, the 1st resistance at 16619.90 is identified as a pullback resistance, signifying a historical level where selling pressure has been notable. The 2nd resistance at 16829.20 is characterized as a swing high resistance, indicating a level where strong selling interest has historically been observed.
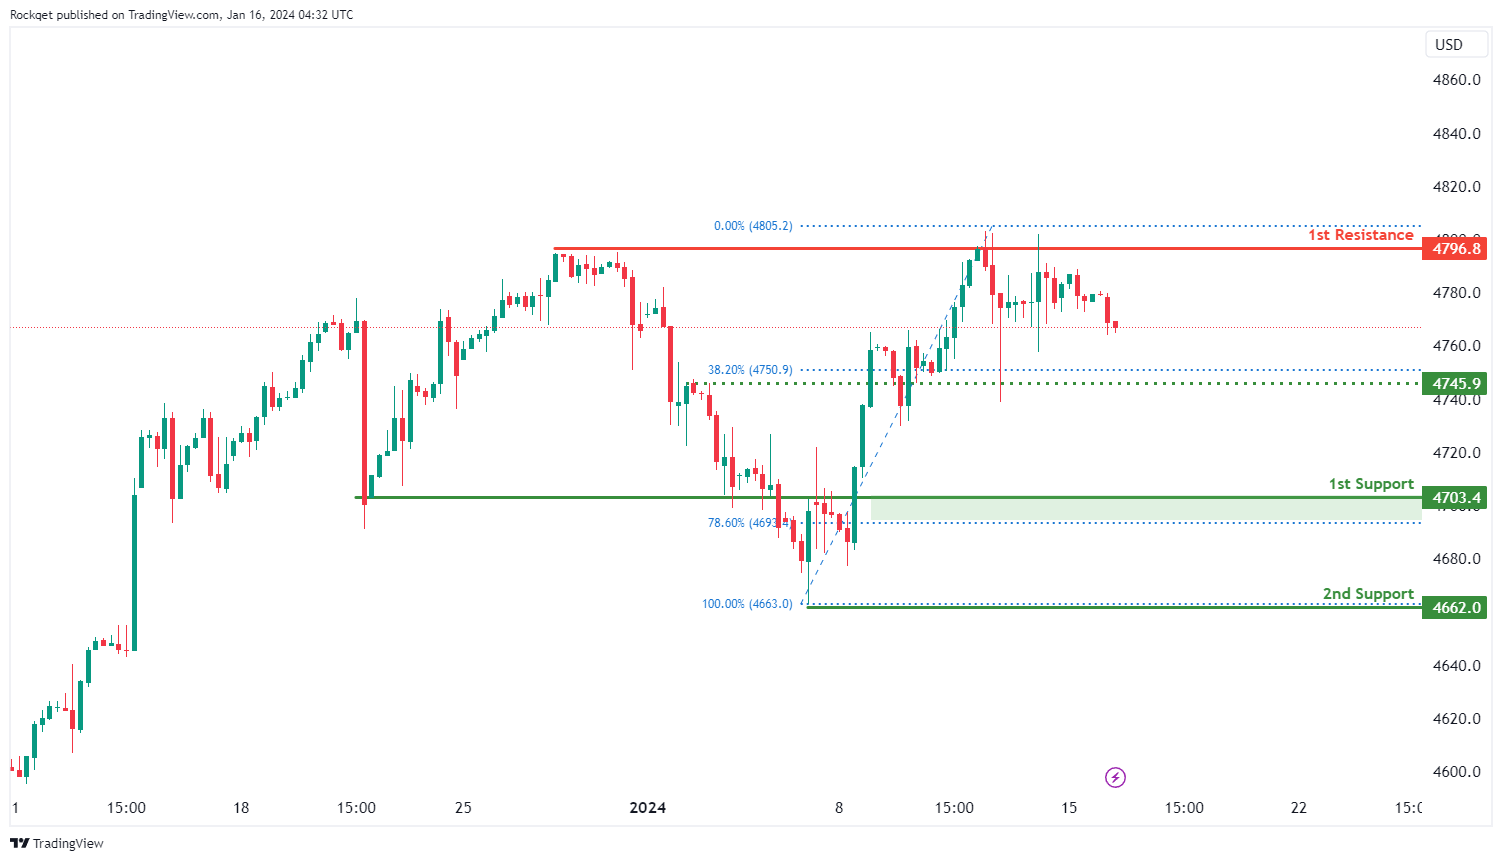
US500:
The US500 chart currently exhibits a bearish overall momentum, and several factors contribute to this downward trend. The price is positioned below a major descending trend line, indicating a bearish bias. Given this momentum, there is a potential for a bearish continuation towards the 1st support level.
The 1st support at 4703.4 is considered significant for several reasons. Firstly, it aligns with the 78.60% Fibonacci Retracement, suggesting a historical level where buying interest has emerged. Additionally, this level is identified as a pullback support, reinforcing its potential significance.
The 2nd support at 4662.0 is noteworthy for being a swing low support, indicating a level where buyers have historically stepped in. Traders should closely monitor this level as it represents a historical point of interest.
The intermediate support at 4745.9 holds importance as it is characterized as an overlap support and coincides with the 38.20% Fibonacci Retracement. This confluence of support levels enhances the significance of this level.
On the resistance side, the 1st resistance at 4796.8 is identified as a swing high resistance, marking a historical level where selling pressure has been notable.
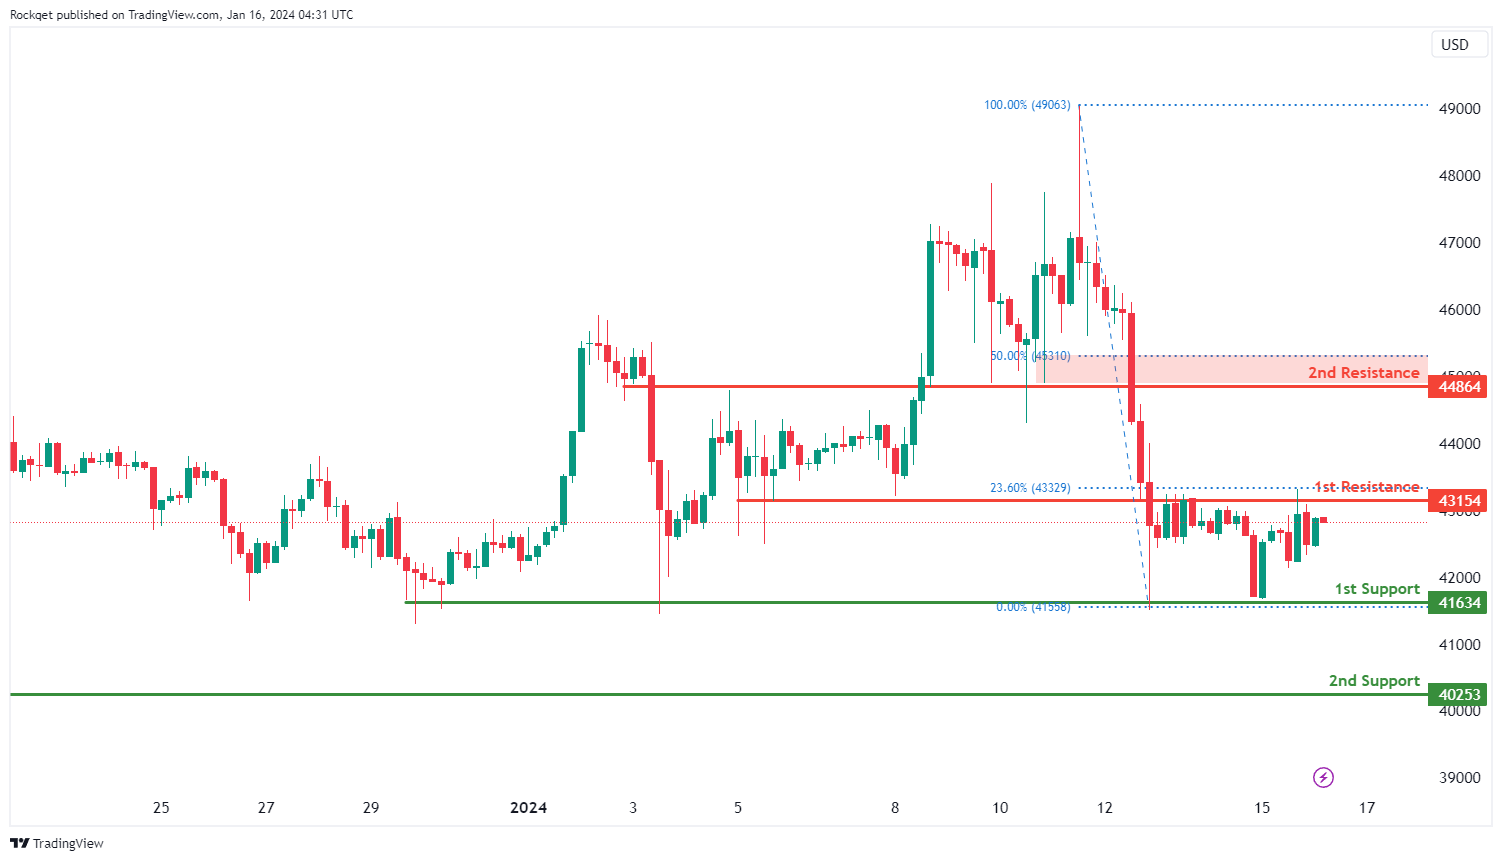
BTC/USD:
The BTC/USD chart currently exhibits a weak bullish overall momentum with low confidence, suggesting a tentative upward trend. There is a potential for a bullish continuation, and several key support and resistance levels should be considered for trading decisions.
The 1st support at 41634 is identified as a multi-swing low support, indicating a level where buyers have previously shown interest. This level is expected to provide initial support in case of any pullback.
The 2nd support at 40253 is characterized as a pullback support, adding to its significance. It represents a level where the price has retraced before finding buying support, potentially making it a key area for traders to watch.
On the resistance side, the 1st resistance at 43154 is considered significant due to its identification as an overlap resistance and alignment with the 23.60% Fibonacci Retracement. This confluence of technical factors adds strength to this resistance level.
The 2nd resistance at 44864 is recognized as an overlap resistance, further reinforcing its potential significance. Traders should carefully monitor these resistance levels as they may present challenges for further bullish movement.
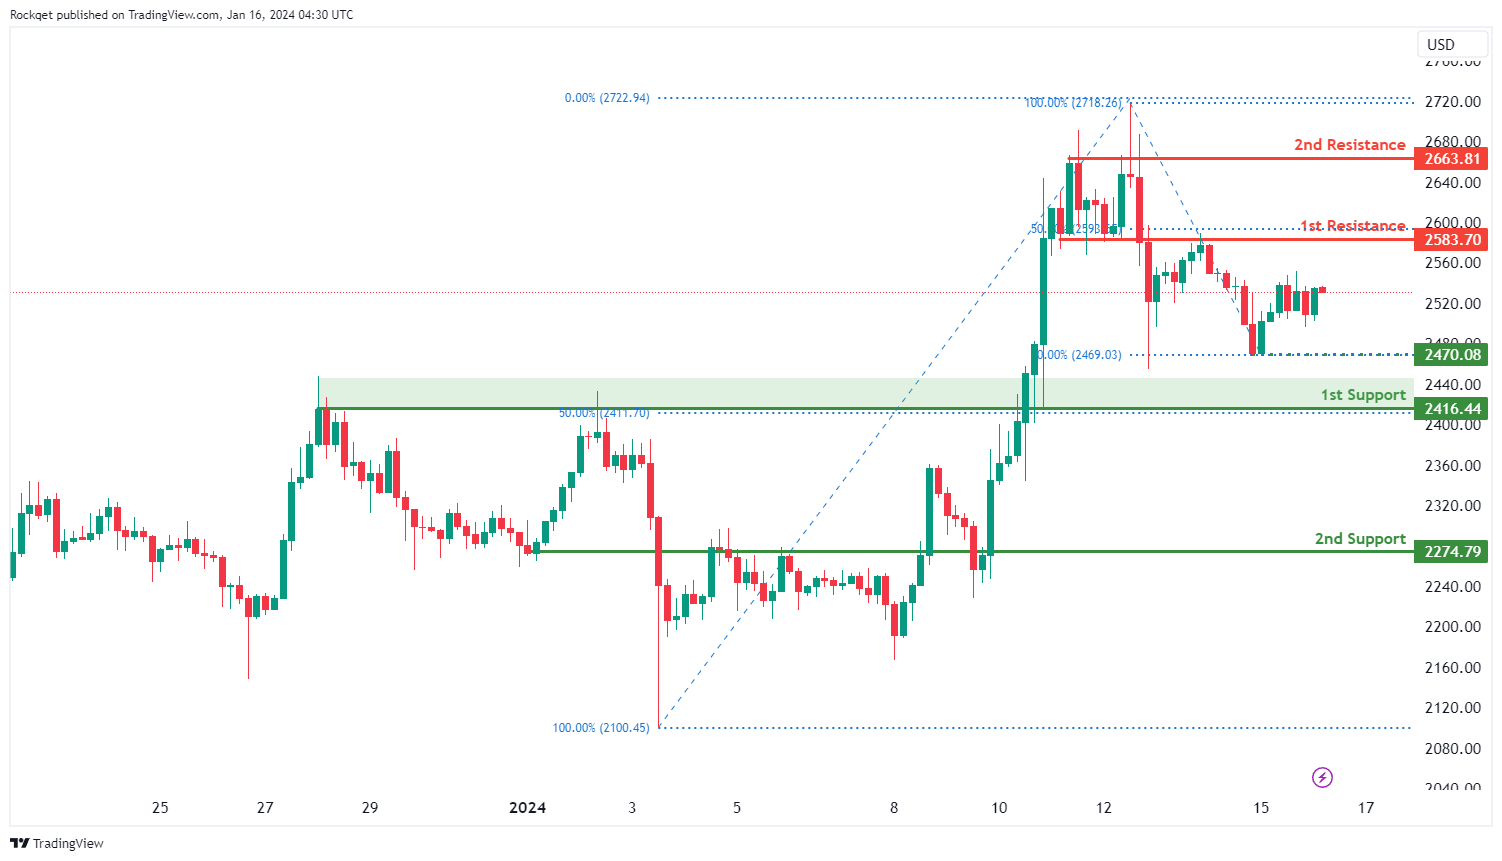
ETH/USD:
The ETH/USD chart currently reflects a neutral overall momentum, indicating a lack of a clear trend direction. The price is anticipated to potentially exhibit fluctuations between the 1st resistance and 1st support levels, and traders should carefully consider these key levels for potential trading decisions.
The 1st support at 2416.44 is identified as an overlap support and coincides with the 50% Fibonacci Retracement level, adding significance to this level. This suggests historical importance as a level where buying interest has emerged before.
The 2nd support at 2274.79 is recognized as an overlap support, contributing to its potential as a key support level. Overlap supports often signify areas where the price has found stability in the past.
On the resistance side, the 1st resistance at 2583.70 is considered significant due to its identification as an overlap resistance and alignment with the 50% Fibonacci Retracement. This confluence of technical factors adds strength to this resistance level.
The 2nd resistance at 2663.81 is acknowledged as a swing high resistance, indicating a level where the price has faced selling pressure in previous instances.
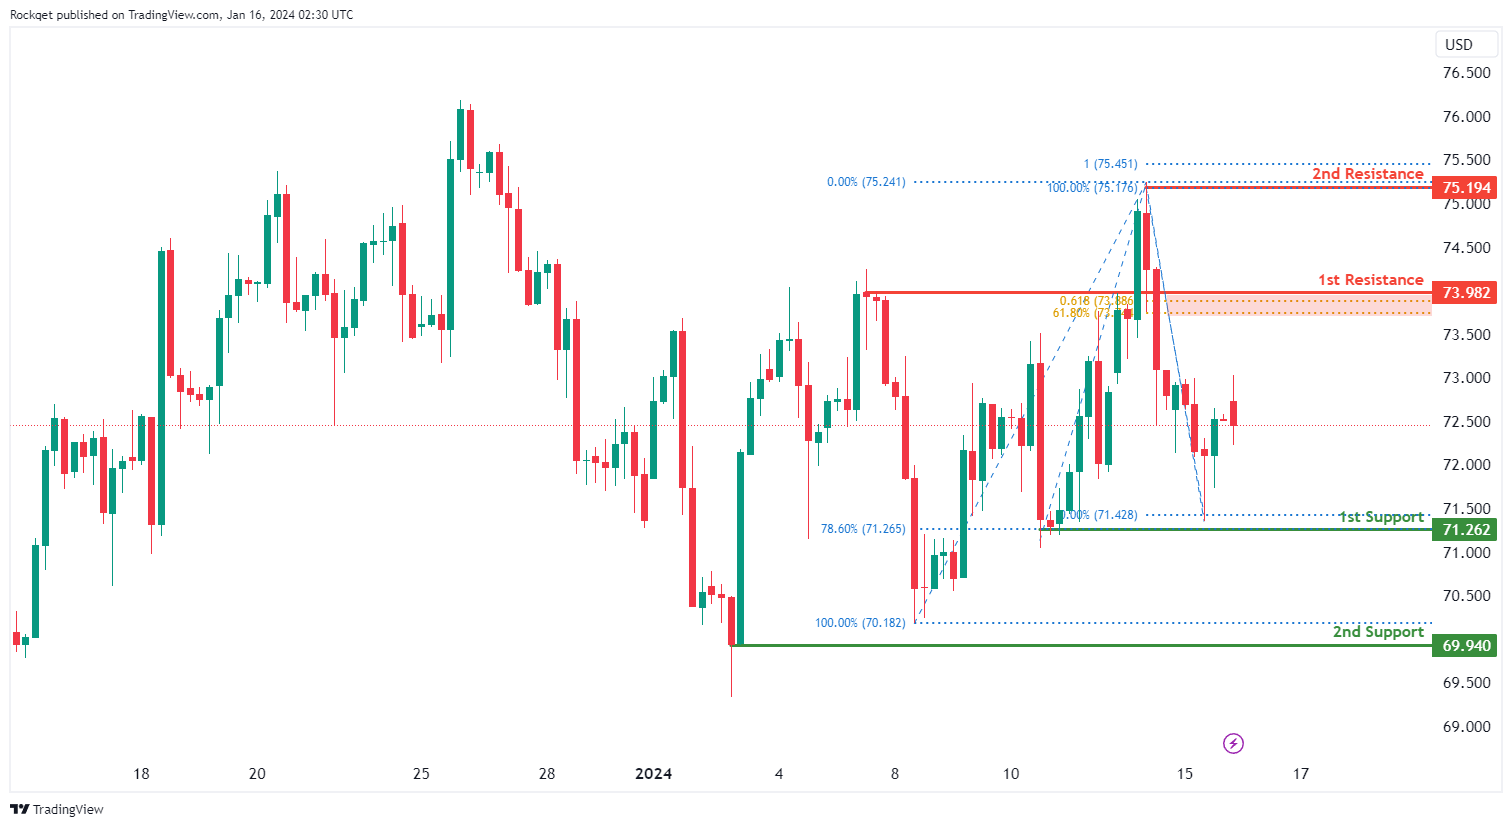
WTI/USD:
The WTI (West Texas Intermediate) chart currently exhibits a neutral bias, indicating a potential for price to fluctuate between the 1st resistance and the 1st support.
The 1st resistance level at 73.98 is identified as a pullback resistance that aligns with a confluence of Fibonacci levels i.e. the 61.80% retracement and the 61.80% projection. Higher up, the 2nd resistance level at 75.19 is noted as a swing-high resistance that aligns with the 100.00% Fibonacci projection, suggesting a potential barrier for further upside movement.
To the downside, the 1st support level at 71.26 is identified as a pullback support that aligns close to the 78.60% Fibonacci retracement level. Further below, the 2nd support level at 69.94 is marked as a swing-low support, further reinforcing its importance as a key support level.
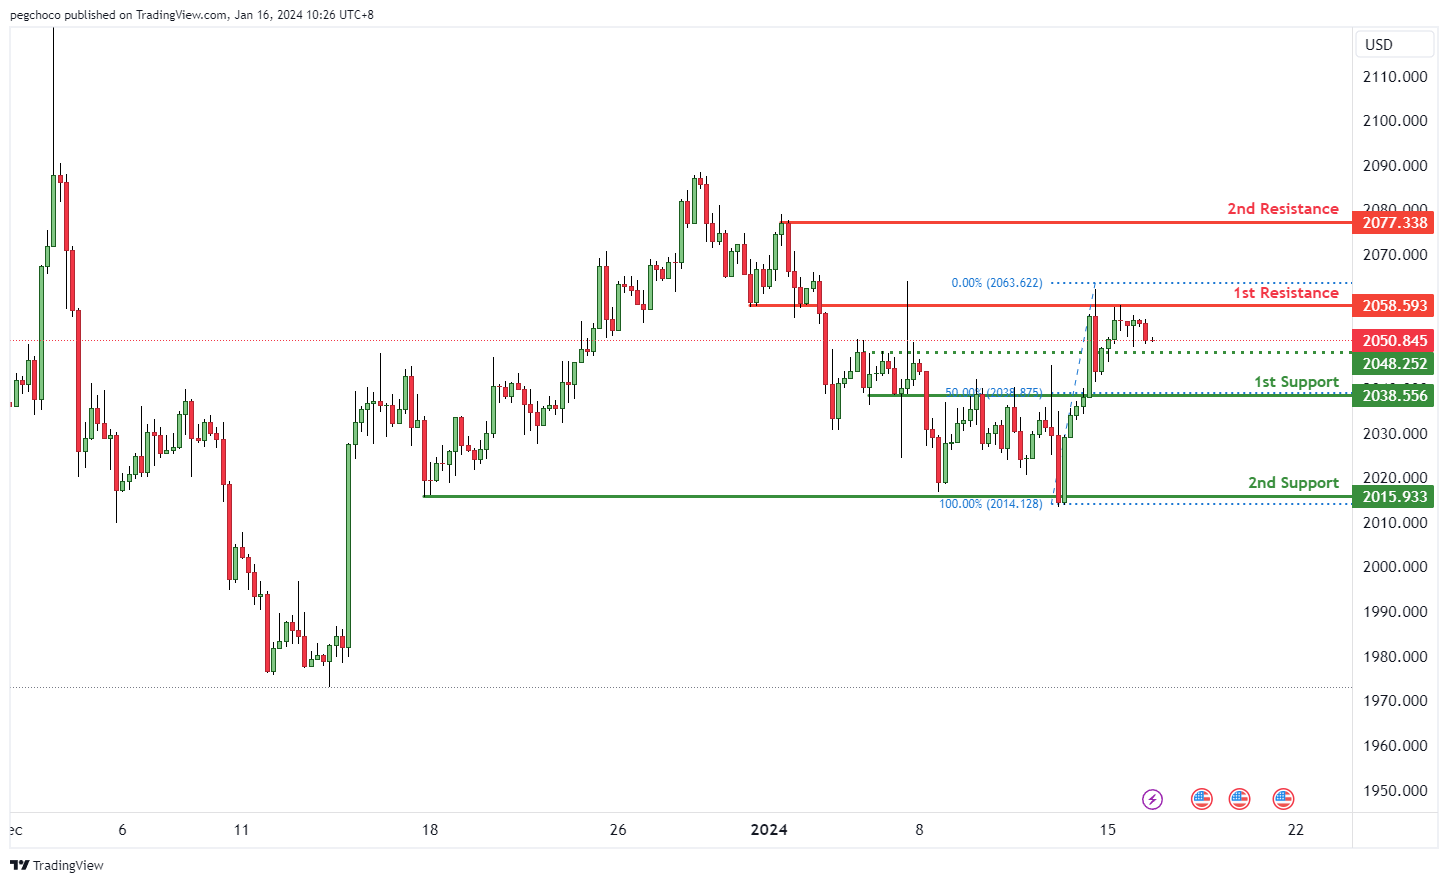
XAU/USD (GOLD):
The XAU/USD (Gold/US Dollar) chart currently shows a bearish overall momentum, suggesting weakness in the price of gold relative to the US Dollar. This bearish momentum indicates the potential for a bearish continuation towards the 1st support level.
1st support at 2038.25 is marked as a pullback support. This level is significant as it suggests a potential area where buying interest may emerge, providing temporary support for XAU/USD.
2nd support at 2015.93 is categorized as multi-swing low support, further reinforcing its significance as a potential support zone.
On the resistance side, 1st resistance at 2058.59 is identified as an overlap resistance, which may act as a potential barrier for further upward price movement.
2nd resistance at 2077.33 is marked as a swing high resistance, indicating a significant potential resistance point.
Intermediate support at 2050.00 is also identified as a pullback support, providing an additional potential level of support for XAU/USD.


