
DXY:
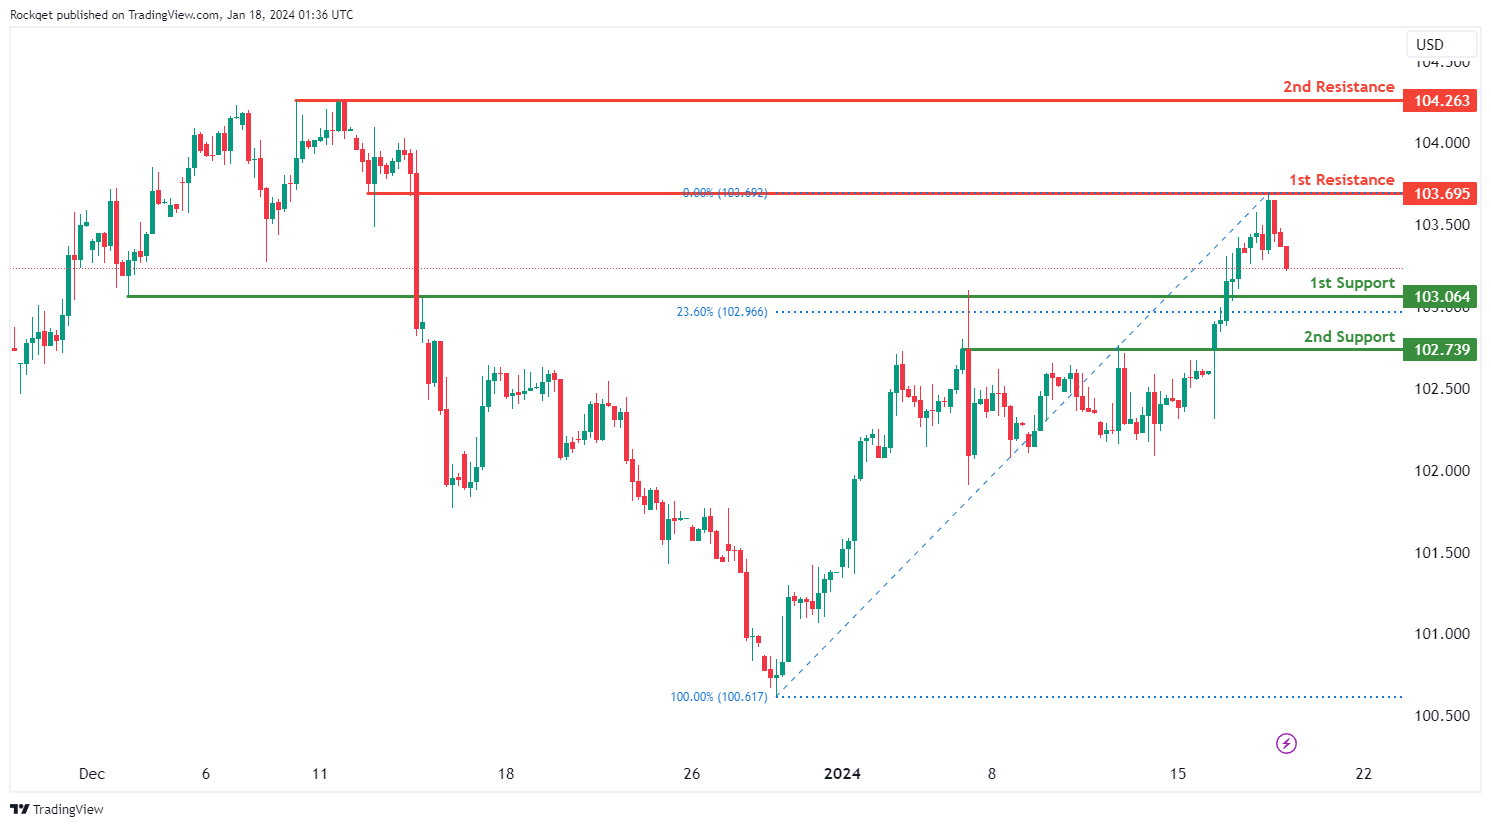
The DXY (US Dollar Index) chart currently exhibits an overall bullish momentum. However, there is a potential scenario for price to drop towards the 1st support before resuming the uptrend.
The 1st support level at 103.06 is identified as an overlap support that aligns close to the 23.60% Fibonacci retracement level. Further below, the 2nd support level at 102.73 is also marked as an overlap support, further reinforcing its importance as a key support level.
To the upside, the 1st resistance level at 103.69 is identified as an overlap resistance. Higher up, the 2nd resistance level at 104.26 is noted as a pullback resistance, further reinforcing its significance as a potential resistance zone.
EUR/USD:
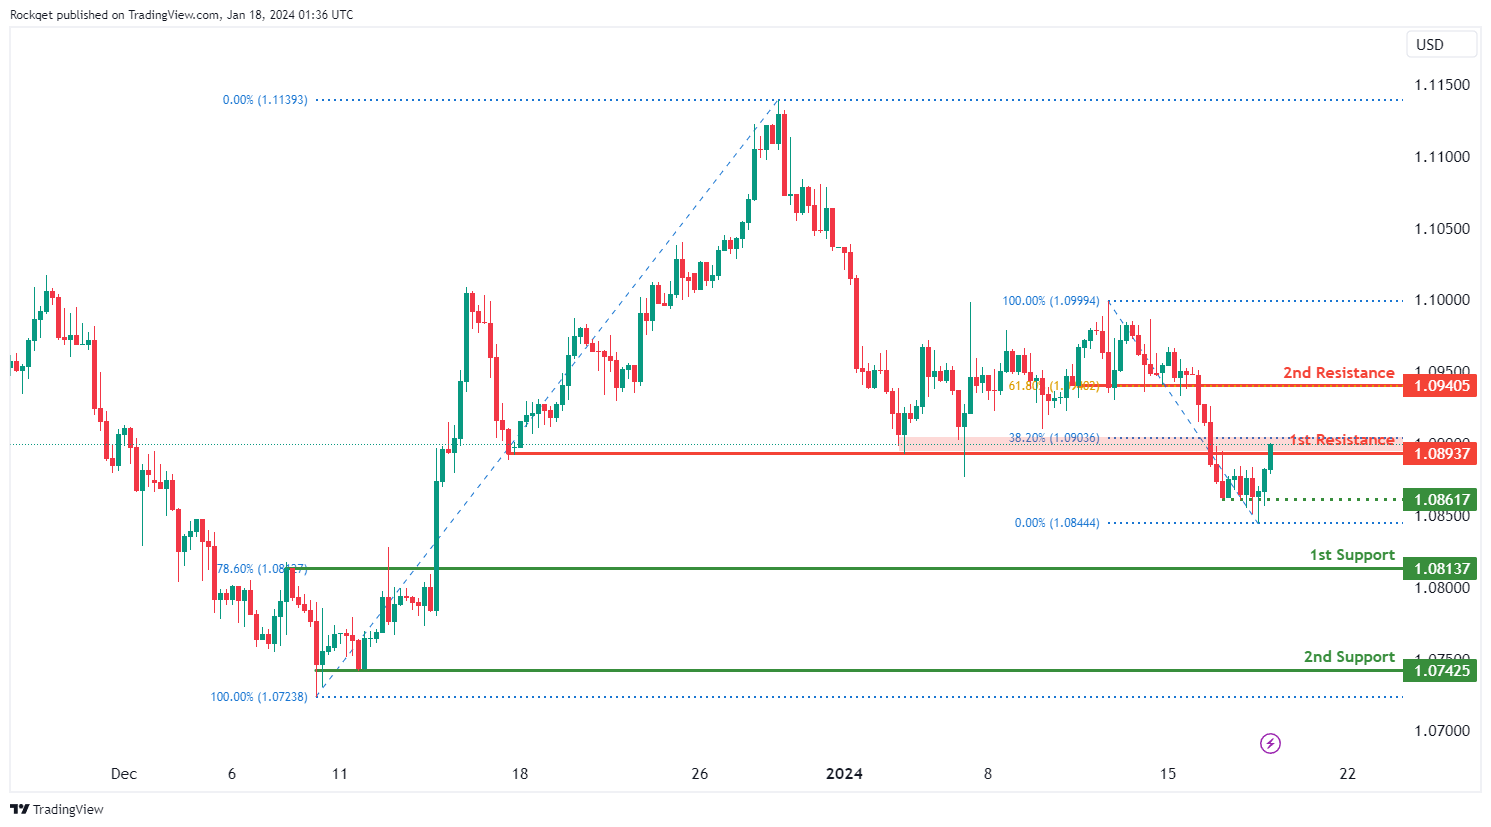
The EUR/USD chart currently exhibits an overall bearish momentum. However, there is a potential scenario for price to rise towards the 1st resistance before resuming the downtrend.
The 1st resistance level at 1.0893 is identified as a pullback resistance that aligns close to the 38.20% Fibonacci retracement level. Higher up, the 2nd resistance level at 1.0940 is also noted as a pullback resistance that aligns with the 61.80% Fibonacci retracement level, suggesting a potential barrier for further upside movement.
To the downside, the intermediate support level at 1.0861 is identified as a pullback support while the 1st support level at 1.0813 is also noted as a pullback support that aligns with the 78.60% Fibonacci retracement level. Further below, the 2nd support level at 1.0742 is marked as a swing-low support, further reinforcing its importance as a key support level.
EUR/JPY:
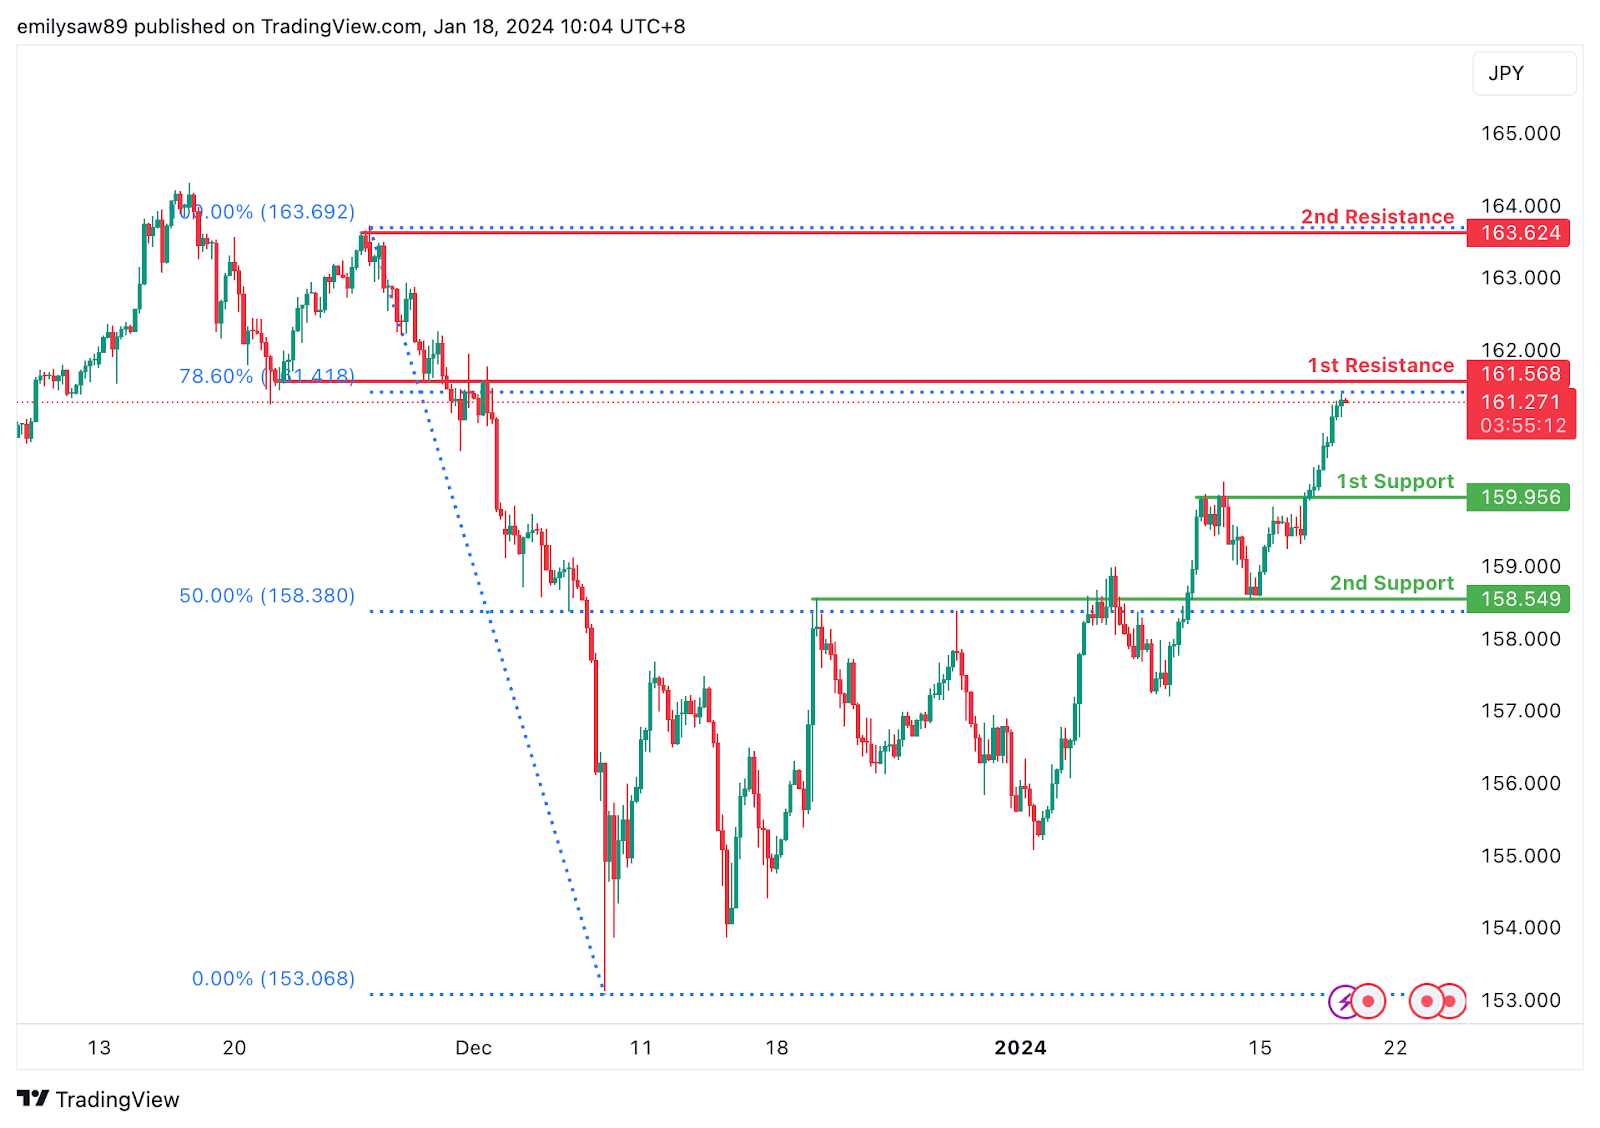
The EUR/JPY chart currently displays a bullish overall momentum, indicating a positive trend direction. There is a potential scenario where the price could make a bullish continuation towards the 1st resistance.
The 1st support at 159.96 is considered favourable as it is identified as a pullback support, suggesting historical significance as a level where buying interest has previously emerged. Additionally, the 2nd support at 158.55 is recognized as an overlap support, adding strength to the potential support zone.
On the resistance side, the 1st resistance at 161.57 is identified as an overlap resistance and aligns with the 78.60% Fibonacci Retracement. This confluence of technical factors adds strength to the potential resistance level. Furthermore, the 2nd resistance at 163.62 is acknowledged as a swing high resistance.
EUR/GBP:
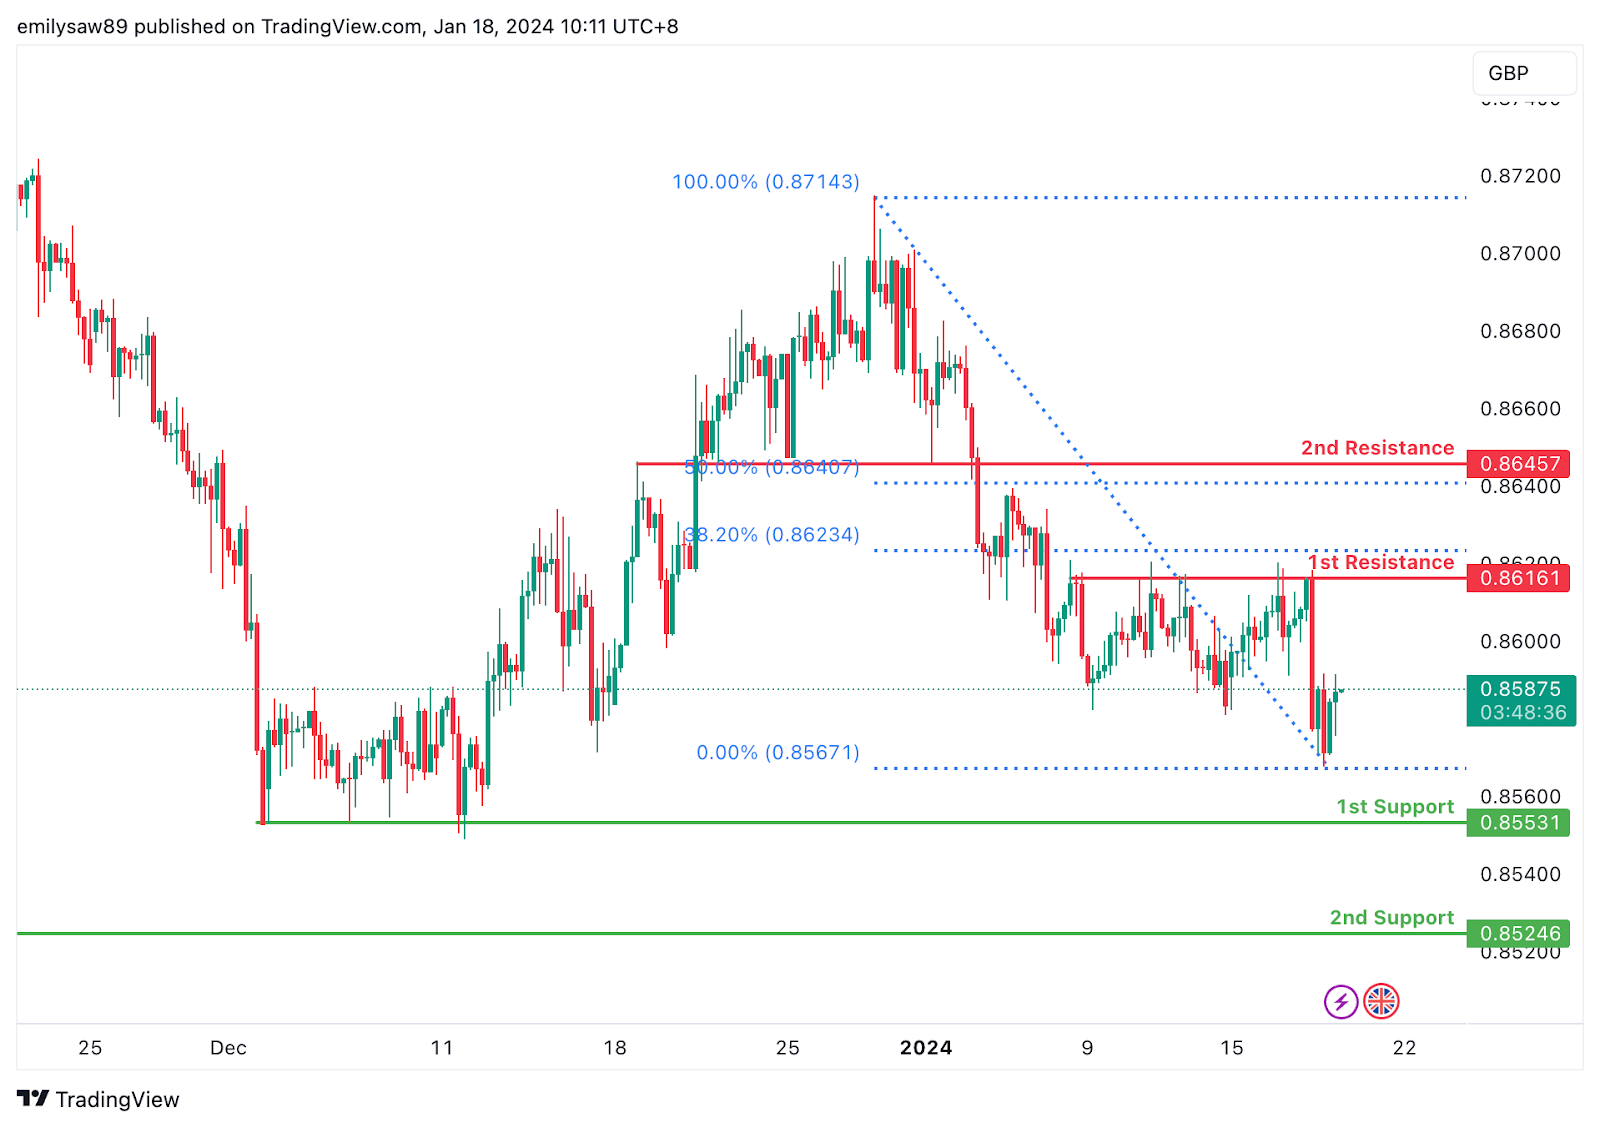
The EUR/GBP chart currently exhibits a weak bearish overall momentum, characterized by low confidence in the downward trend. Several factors contribute to this weak bearish momentum, and as a result, the price could potentially make a bearish continuation towards the 1st support.
The 1st support at 0.8553 is considered significant due to its identification as a multi-swing low support and coincides with the 78.60% Fibonacci Retracement, suggesting historical relevance as a level where buying interest has previously emerged. Additionally, the 2nd support at 0.8526 is recognized as a swing low support, providing additional strength to the potential support zone.
On the resistance side, the 1st resistance at 0.8616 is identified as a multi-swing high resistance and aligns with the 38.20% Fibonacci Retracement. This confluence of technical factors adds strength to the potential resistance level. Furthermore, the 2nd resistance at 0.8646 is acknowledged as an overlap resistance and corresponds to the 50% Fibonacci Retracement.
GBP/USD:
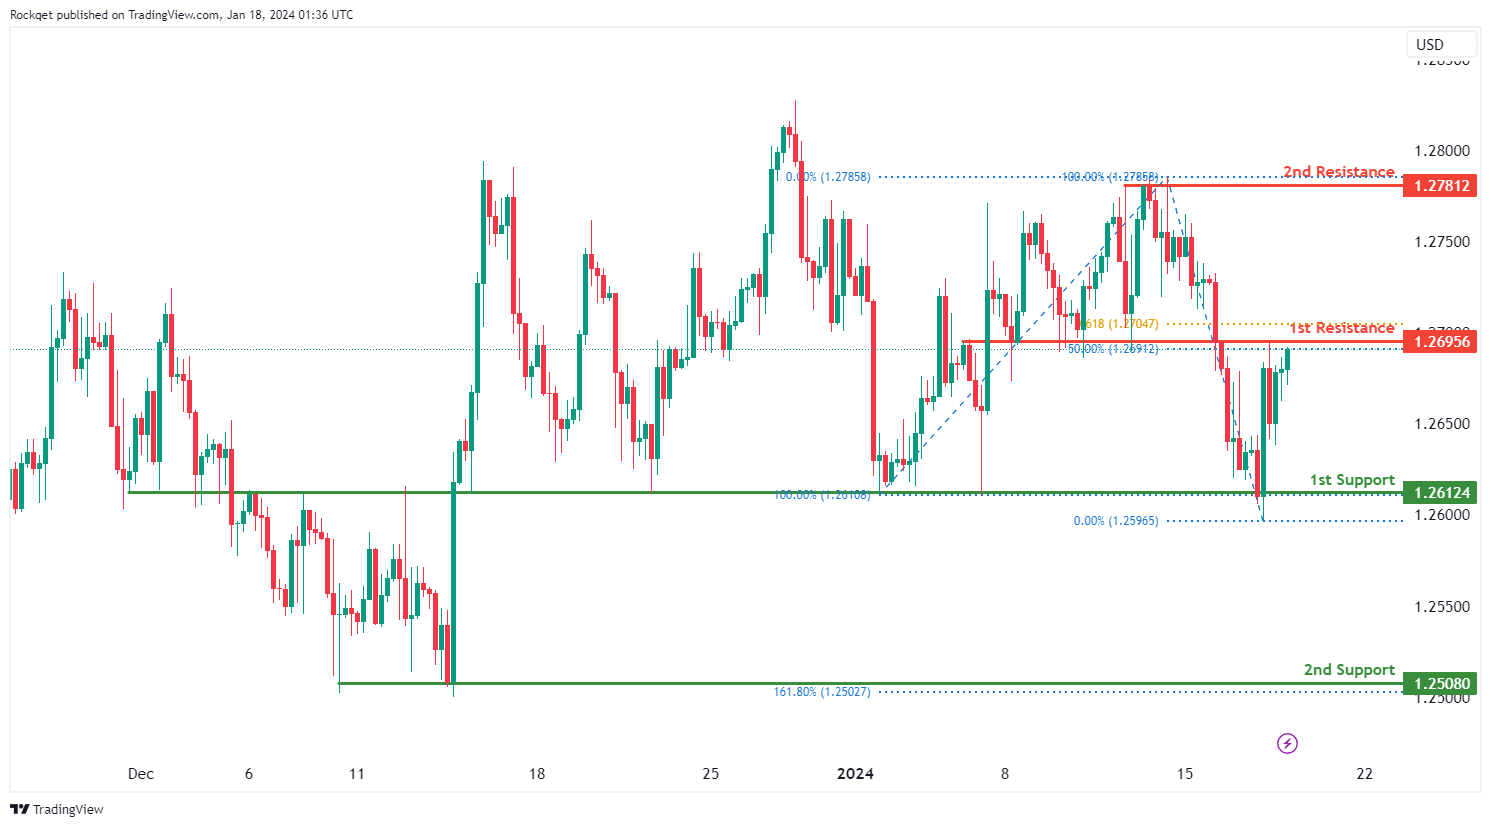
The GBP/USD chart currently exhibits an overall bearish momentum. However, there is a potential scenario for price to rise towards the 1st resistance before resuming the downtrend.
The 1st resistance level at 1.2695 is identified as an overlap resistance that aligns with a confluence of Fibonacci levels i.e. the 50.00% retracement and the 61.80% projection. Higher up, the 2nd resistance level at 1.2781 is noted as a swing-high resistance, suggesting a potential barrier for further upside movement.
To the downside, the 1st support level at 1.2612 is identified as an overlap support. Further below, the 2nd support level at 1.2508 is marked as a swing-low support that aligns with the 161.80% Fibonacci extension level, further reinforcing its importance as a key support level.
GBP/JPY:
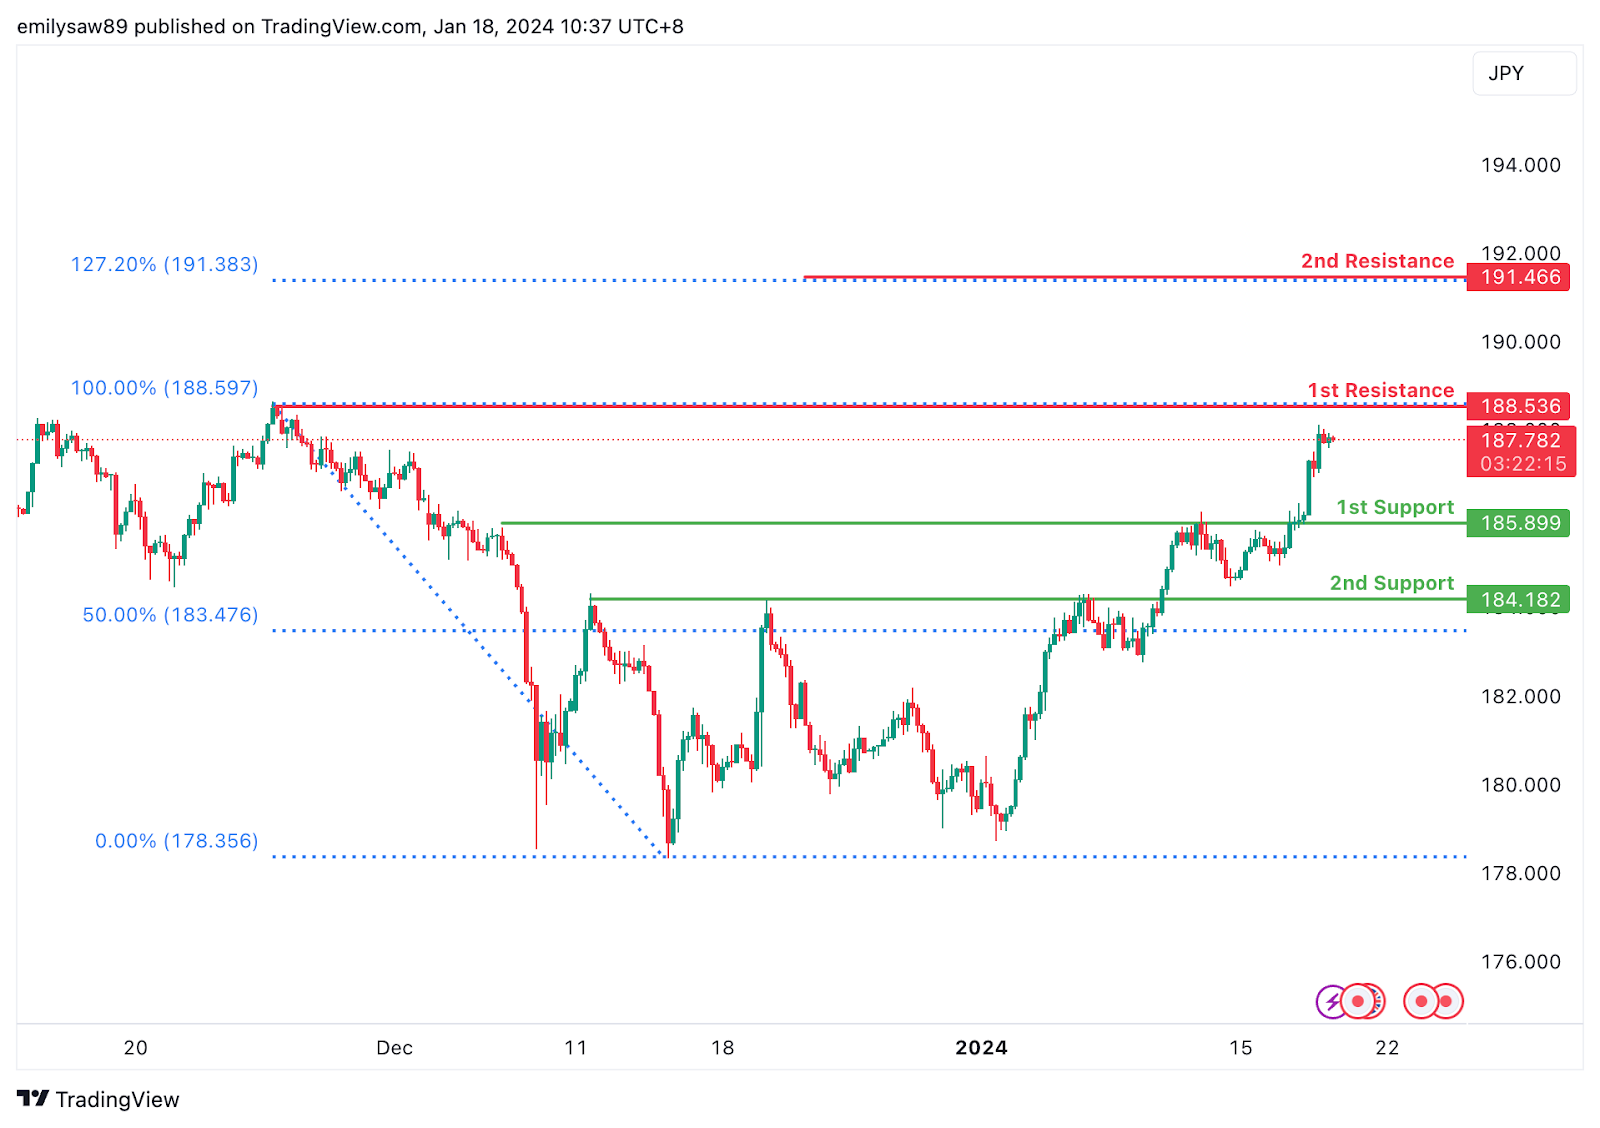
The GBP/JPY chart currently displays a bullish overall momentum, indicating a positive trend direction. The potential price movement suggests a bullish continuation towards the 1st resistance level.
The 1st support at 185.90 is considered favorable as it aligns with pullback support, indicating a historical level where buying interest has previously emerged. Additionally, the 2nd support at 184.18 is identified as pullback support and coincides with the 50% Fibonacci Retracement, providing additional strength to the support zone.
On the resistance side, the 1st resistance at 188.54 is recognized as a swing high resistance, signifying a historical level where selling pressure may emerge. Furthermore, the 2nd resistance at 191.47 is notable for the presence of the 127.20% Fibonacci Extension, adding significance to this potential resistance level.
USD/CHF:
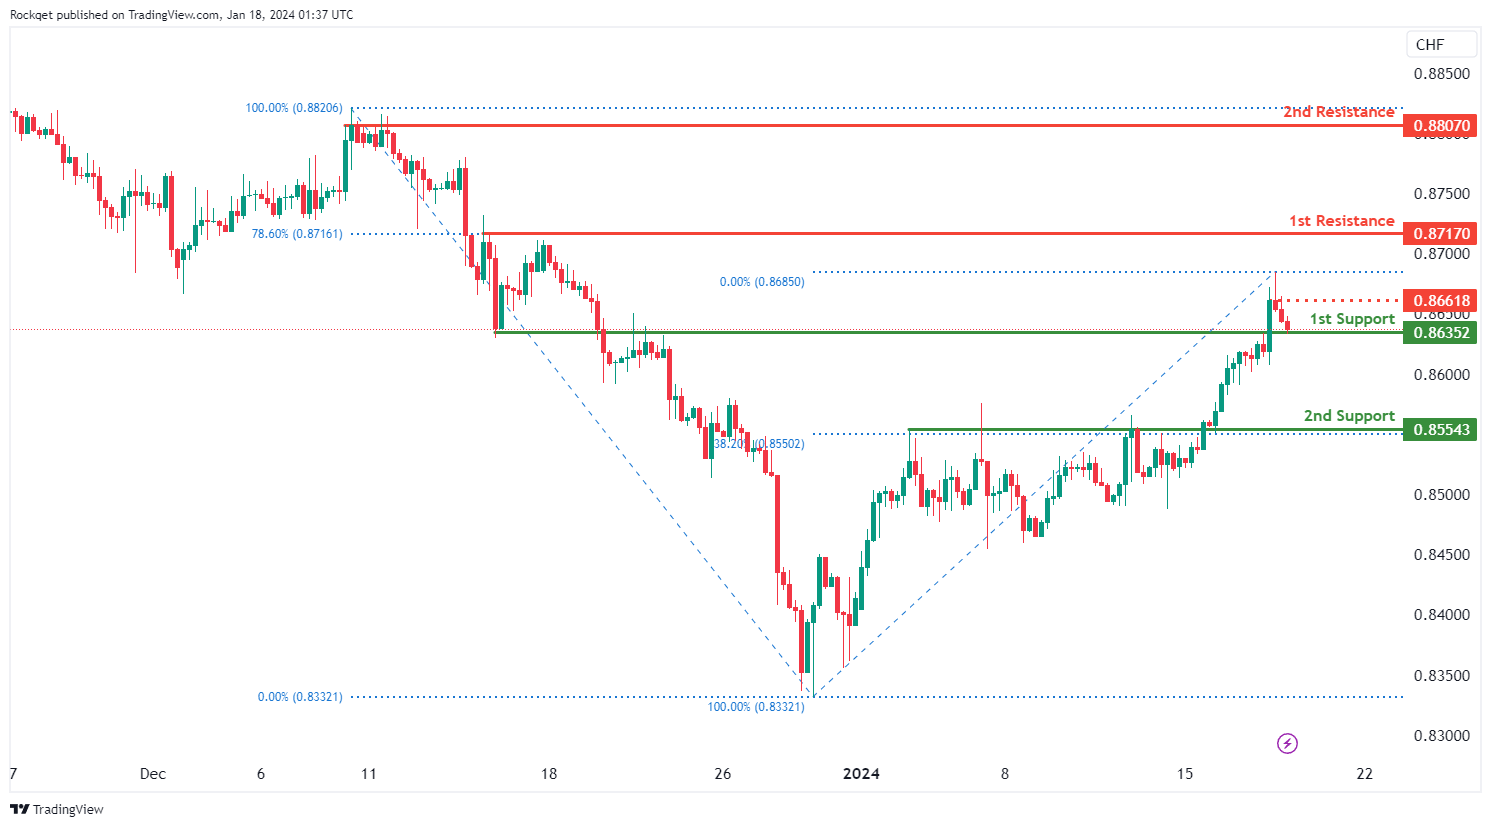
The USD/CHF chart currently exhibits an overall bullish momentum. However, there is a potential scenario for price to drop towards the 1st support before resuming the uptrend.
The 1st support level at 0.8635 is identified as an overlap support. Further below, the 2nd support level at 0.8554 is marked as a pullback support that aligns with the 38.20% Fibonacci retracement level, further reinforcing its importance as a key support level.
To the upside, the intermediate resistance level at 0.8661 is identified as a pullback resistance while the 1st resistance level at 0.8717 is also marked as a pullback resistance that aligns with the 78.60% Fibonacci retracement level. Higher up, the 2nd resistance level at 0.8807 is also noted as a pullback resistance, further reinforcing its significance as a potential resistance zone.
USD/JPY:
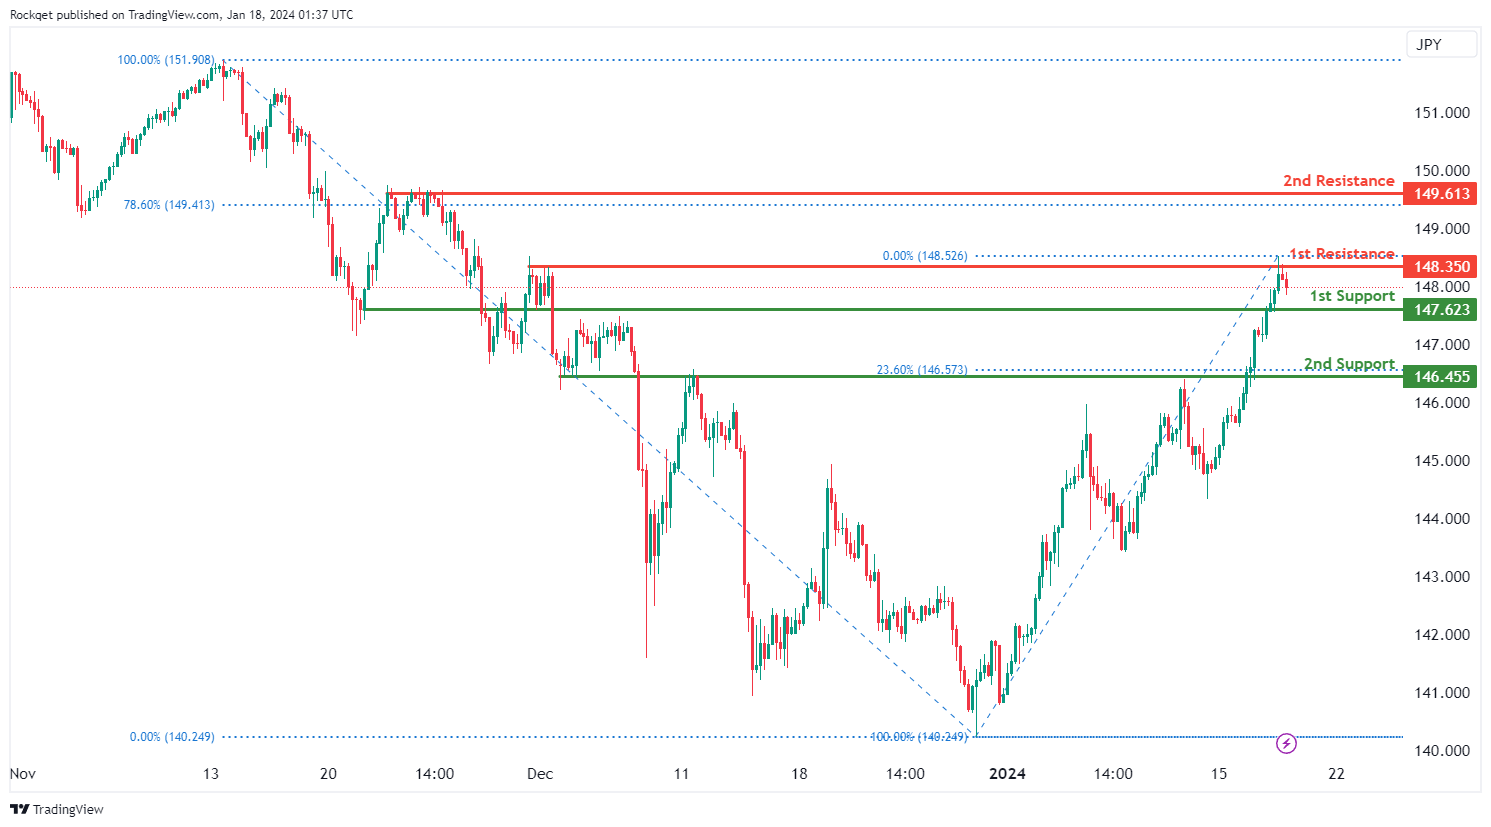
The USD/JPY chart currently exhibits an overall bullish momentum. However, there is a potential scenario for price to drop towards the 1st support before resuming the uptrend.
The 1st support level at 147.62 is identified as an overlap support. Further below, the 2nd support level at 146.45 is also marked as an overlap support that aligns with the 23.60% Fibonacci retracement level, further reinforcing its importance as a key support level.
To the upside, the 1st resistance level at 148.35 is identified as a pullback resistance. Higher up, the 2nd resistance level at 149.61 is also noted as a pullback resistance that aligns close to the 78.60% Fibonacci retracement level, further reinforcing its significance as a potential resistance zone.
USD/CAD:
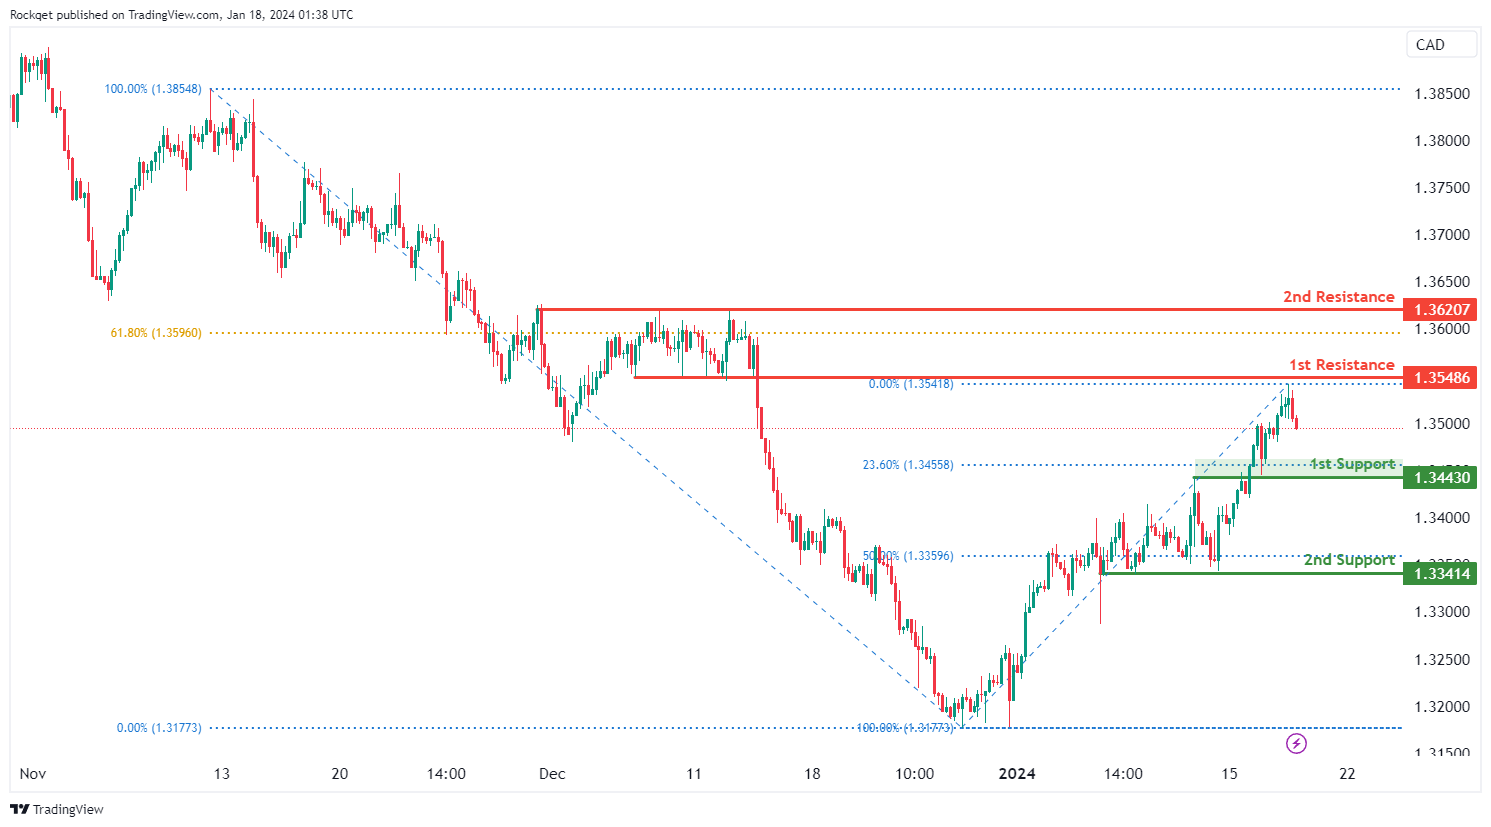
The USD/CAD chart currently exhibits an overall bullish momentum. However, there is a potential scenario for price to drop towards the 1st support before resuming the uptrend.
The 1st support level at 1.3443 is identified as an overlap support that aligns close to the 23.60% Fibonacci retracement level. Further below, the 2nd support level at 1.3341 is marked as a pullback support that aligns close to the 50.00% Fibonacci retracement level, further reinforcing its importance as a key support level.
To the upside, the 1st resistance level at 1.3548 is identified as a pullback resistance. Higher up, the 2nd resistance level at 1.3620 is also noted as a pullback resistance that aligns close to the 61.80% Fibonacci retracement level, further reinforcing its significance as a potential resistance zone.
AUD/USD:
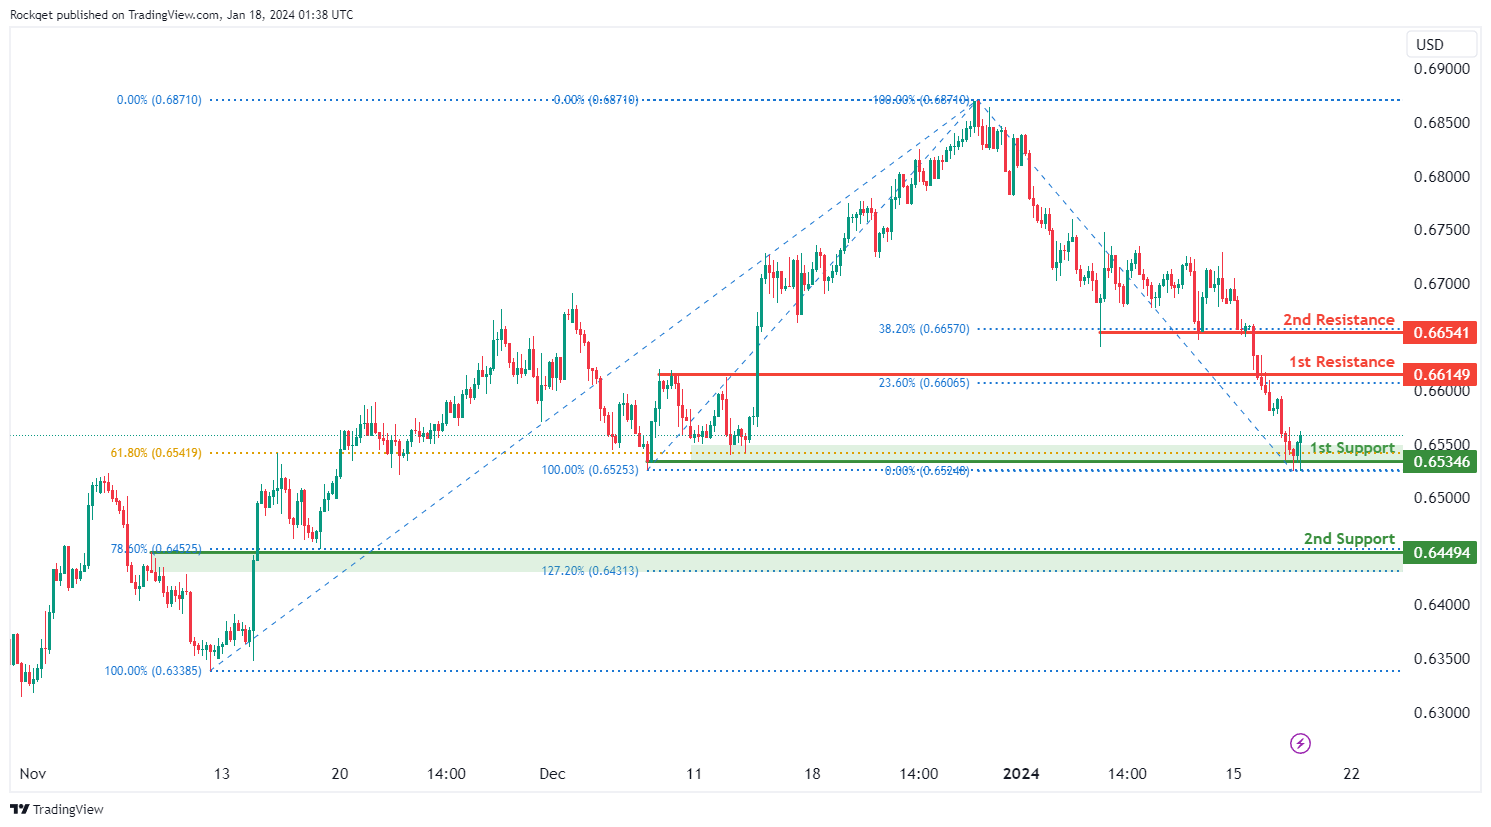
The AUD/USD chart currently exhibits an overall bearish momentum. However, there is a potential scenario for price to rise towards the 1st resistance before resuming the downtrend.
The 1st resistance level at 0.6614 is identified as a pullback resistance that aligns with the 23.60% Fibonacci retracement level. Higher up, the 2nd resistance level at 0.6654 is also noted as a pullback resistance that aligns with the 38.20% Fibonacci retracement level, suggesting a potential barrier for further upside movement.
To the downside, the 1st support level at 0.6534 is identified as a pullback support that aligns with the 61.80% Fibonacci retracement level. Further below, the 2nd support level at 0.6449 is marked as an overlap support that aligns with a confluence of Fibonacci levels i.e. the 78.60% retracement and the 127.20% extension, further reinforcing its importance as a key support level.
NZD/USD
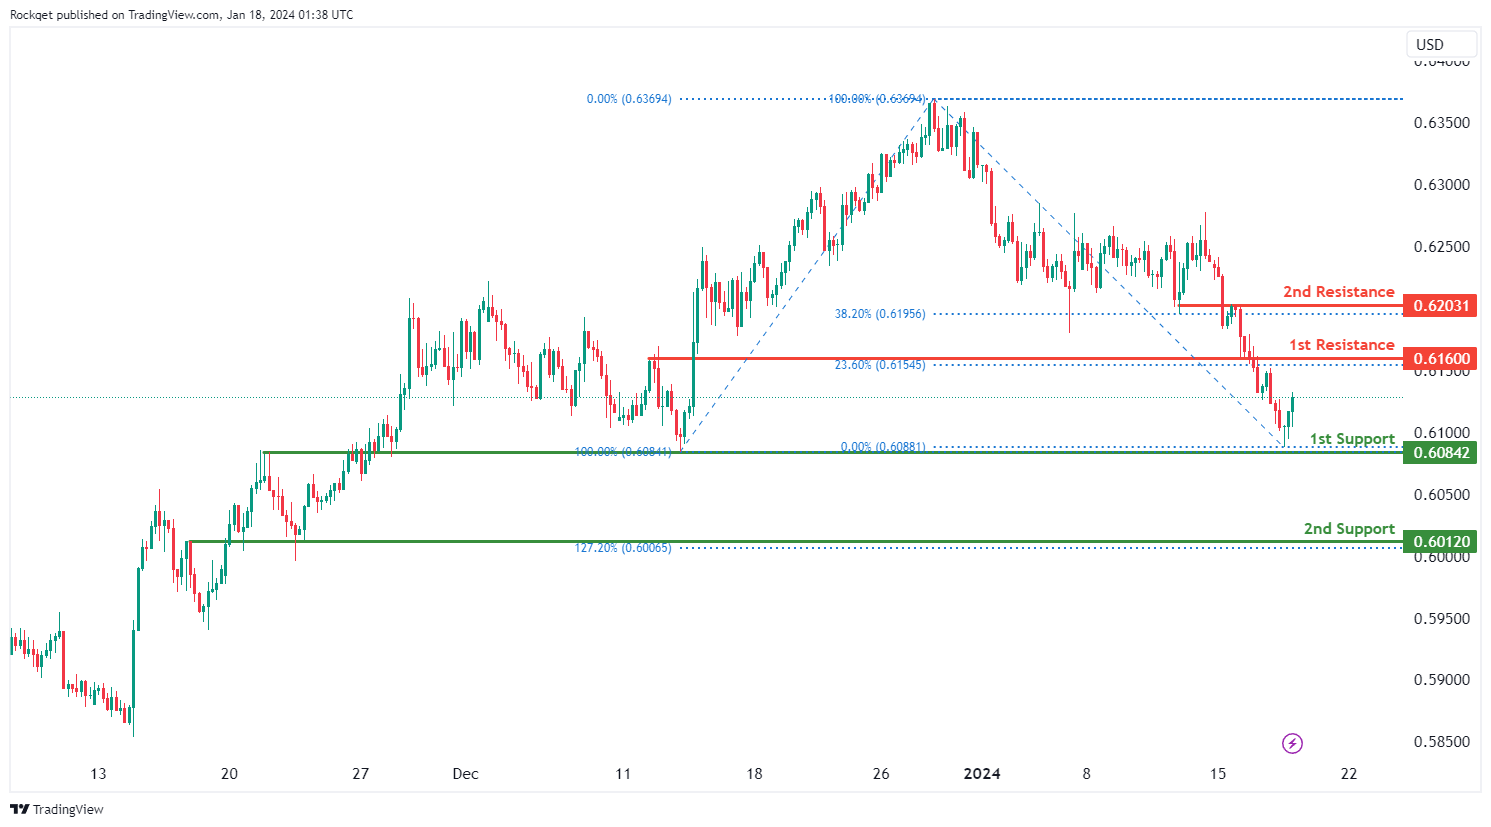
The NZD/USD chart currently exhibits an overall bearish momentum. However, there is a potential scenario for price to rise towards the 1st resistance before resuming the downtrend.
The 1st resistance level at 0.6160 is identified as a pullback resistance that aligns with the 23.60% Fibonacci retracement level. Higher up, the 2nd resistance level at 0.6203 is noted as an overlap resistance that aligns with the 38.20% Fibonacci retracement level, suggesting a potential barrier for further upside movement.
To the downside, the 1st support level at 0.6084 is identified as an overlap support. Further below, the 2nd support level at 0.6012 is also marked as an overlap support that aligns with the 127.20% Fibonacci extension level, further reinforcing its importance as a key support level.
DJ30:
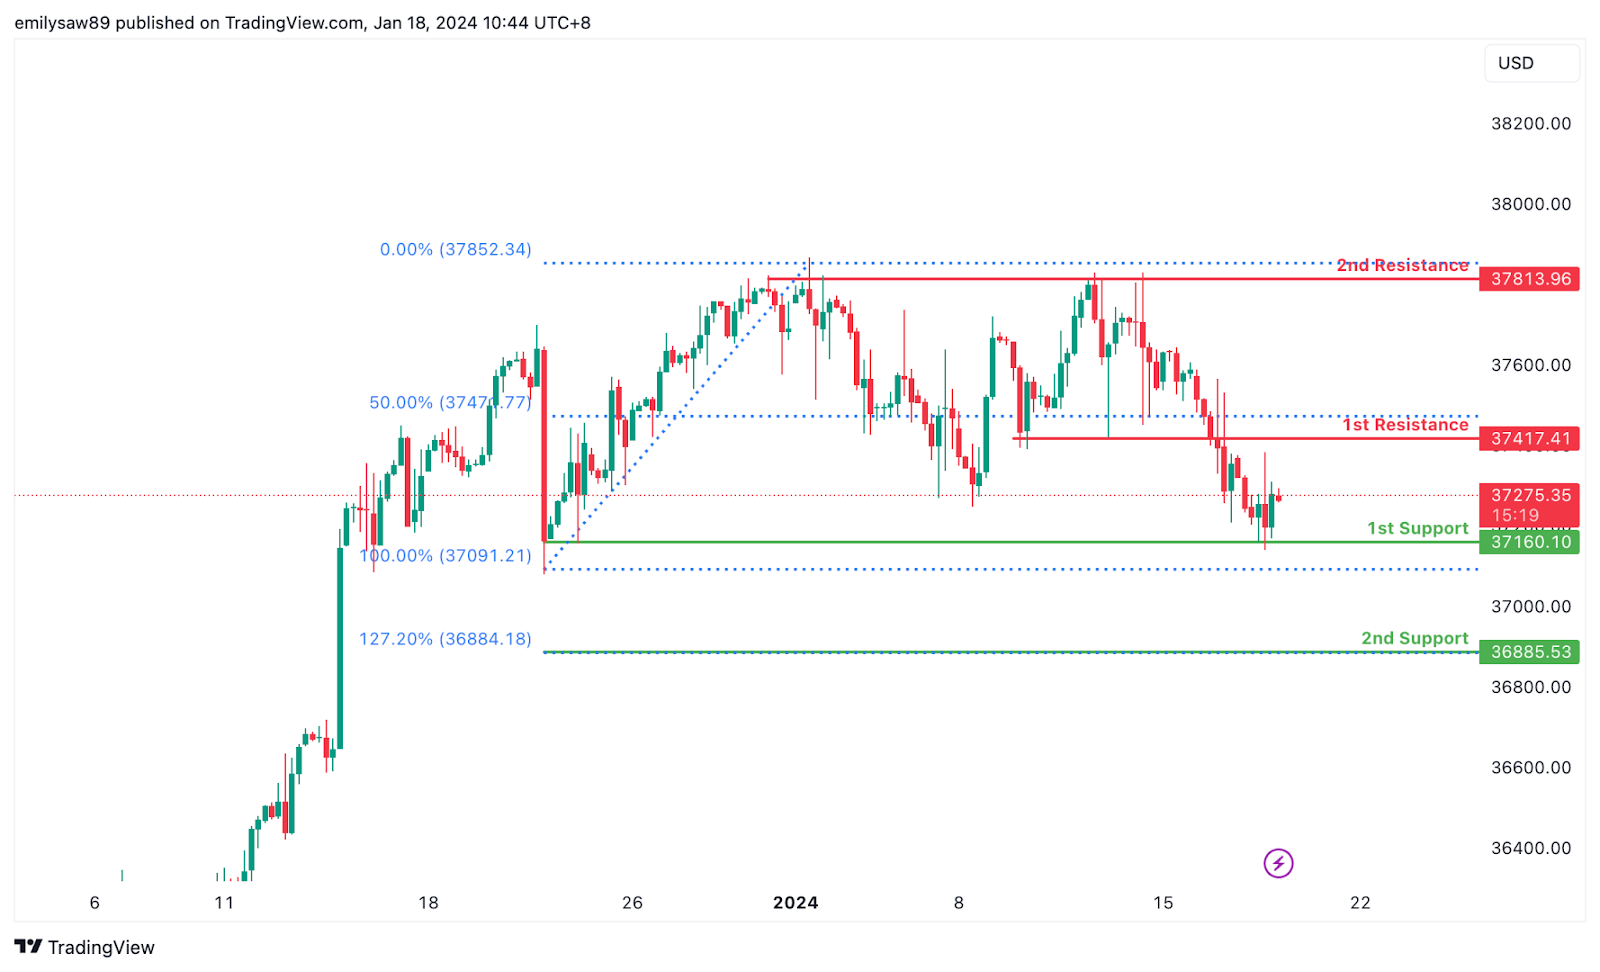
The DJ30 chart currently indicates a neutral overall momentum, suggesting a lack of a clear trend direction. The potential price movement suggests that the price could fluctuate between the 1st resistance and 1st support levels.
The 1st support at 37160.10 is considered favourable as it aligns with multi-swing low support, indicating a historical level where buying interest has previously emerged. Additionally, the 2nd support at 36885.53 is recognized for the presence of the 127.20% Fibonacci Extension, adding an extra layer of significance to this support level.
On the resistance side, the 1st resistance at 37417.41 is identified as an overlap resistance and coincides with the 50% Fibonacci Retracement, providing potential resistance to upward price movement. Furthermore, the 2nd resistance at 37813.96 is notable for being a multi-swing high resistance, suggesting a historical level where selling pressure may emerge.
GER40:
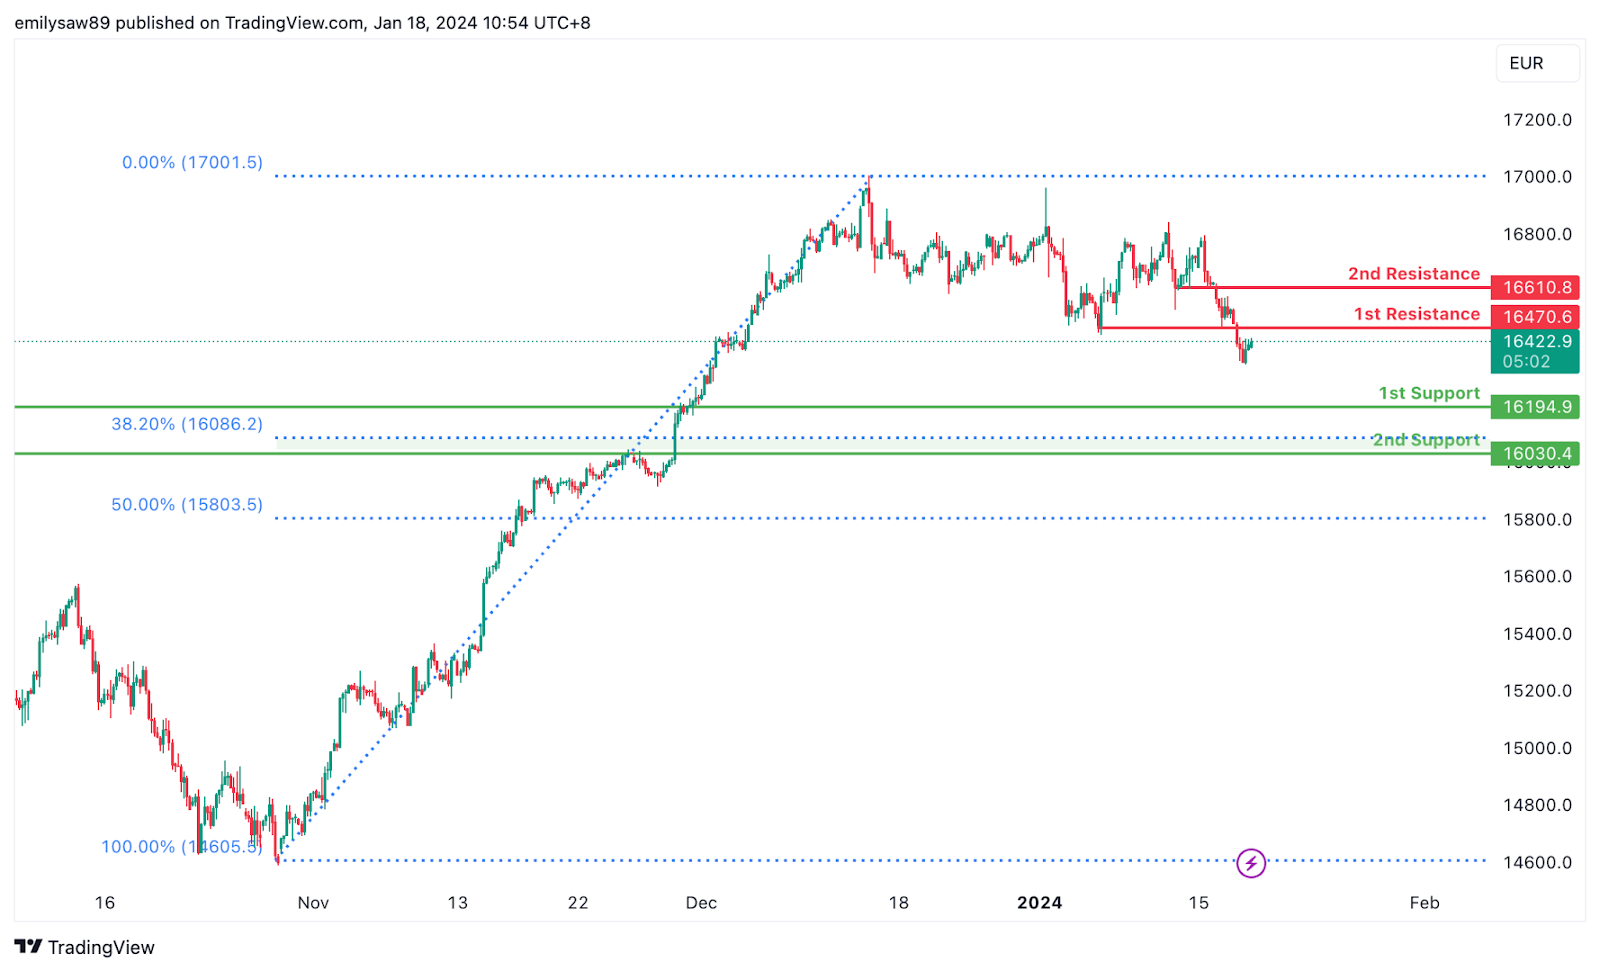
The GER40 chart currently displays a weak bullish overall momentum with low confidence, suggesting a tentative upward direction. Several factors contribute to this weak bullish momentum, indicating that the price could potentially make a bullish continuation towards the 1st resistance.
The 1st support at 16194.90 is considered favourable as it aligns with pullback support, indicating a historical level where buying interest has previously emerged. Additionally, the 2nd support at 16030.40 is recognized for being a pullback support and coincides with the 38.20% Fibonacci Retracement, adding confluence to its potential as a support level.
On the resistance side, the 1st resistance at 16470.60 is identified as an overlap resistance, suggesting a historical level where selling pressure may emerge. Furthermore, the 2nd resistance at 16610.80 is notable for being a pullback resistance, indicating a potential level where the upward momentum might face resistance.
US500:
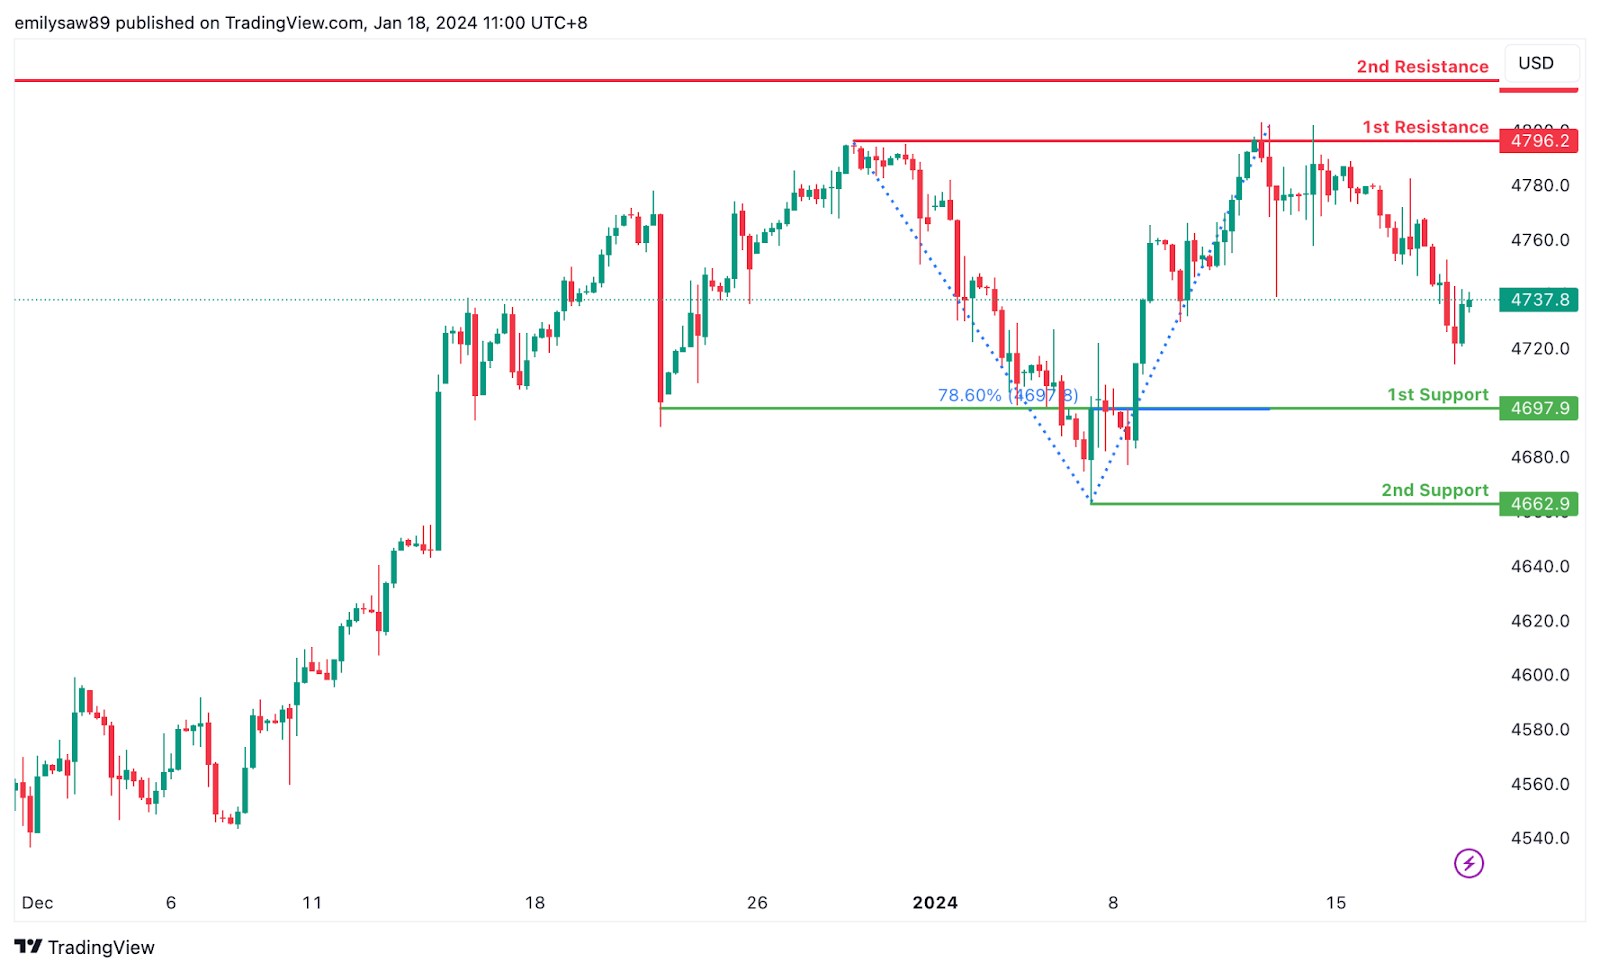
The US500 chart is currently experiencing a bearish overall momentum, with several factors contributing to this downward trend. As a result, the price could potentially continue its bearish movement towards the 1st support.
The 1st support at 4697.9 is considered advantageous as it is identified as an overlap support and coincides with the 78.60% Fibonacci Projection. This level suggests historical significance and may act as a strong support zone. Additionally, the 2nd support at 4662.9 is recognized as a swing low support, further reinforcing the potential support level.
On the resistance side, the 1st resistance at 4796.2 is noted for being a multi-swing high resistance, indicating a historical level where selling pressure has been significant. Furthermore, the intermediate resistance at 4818.4 is highlighted as a swing high resistance, adding strength to the potential resistance zone.
BTC/USD:
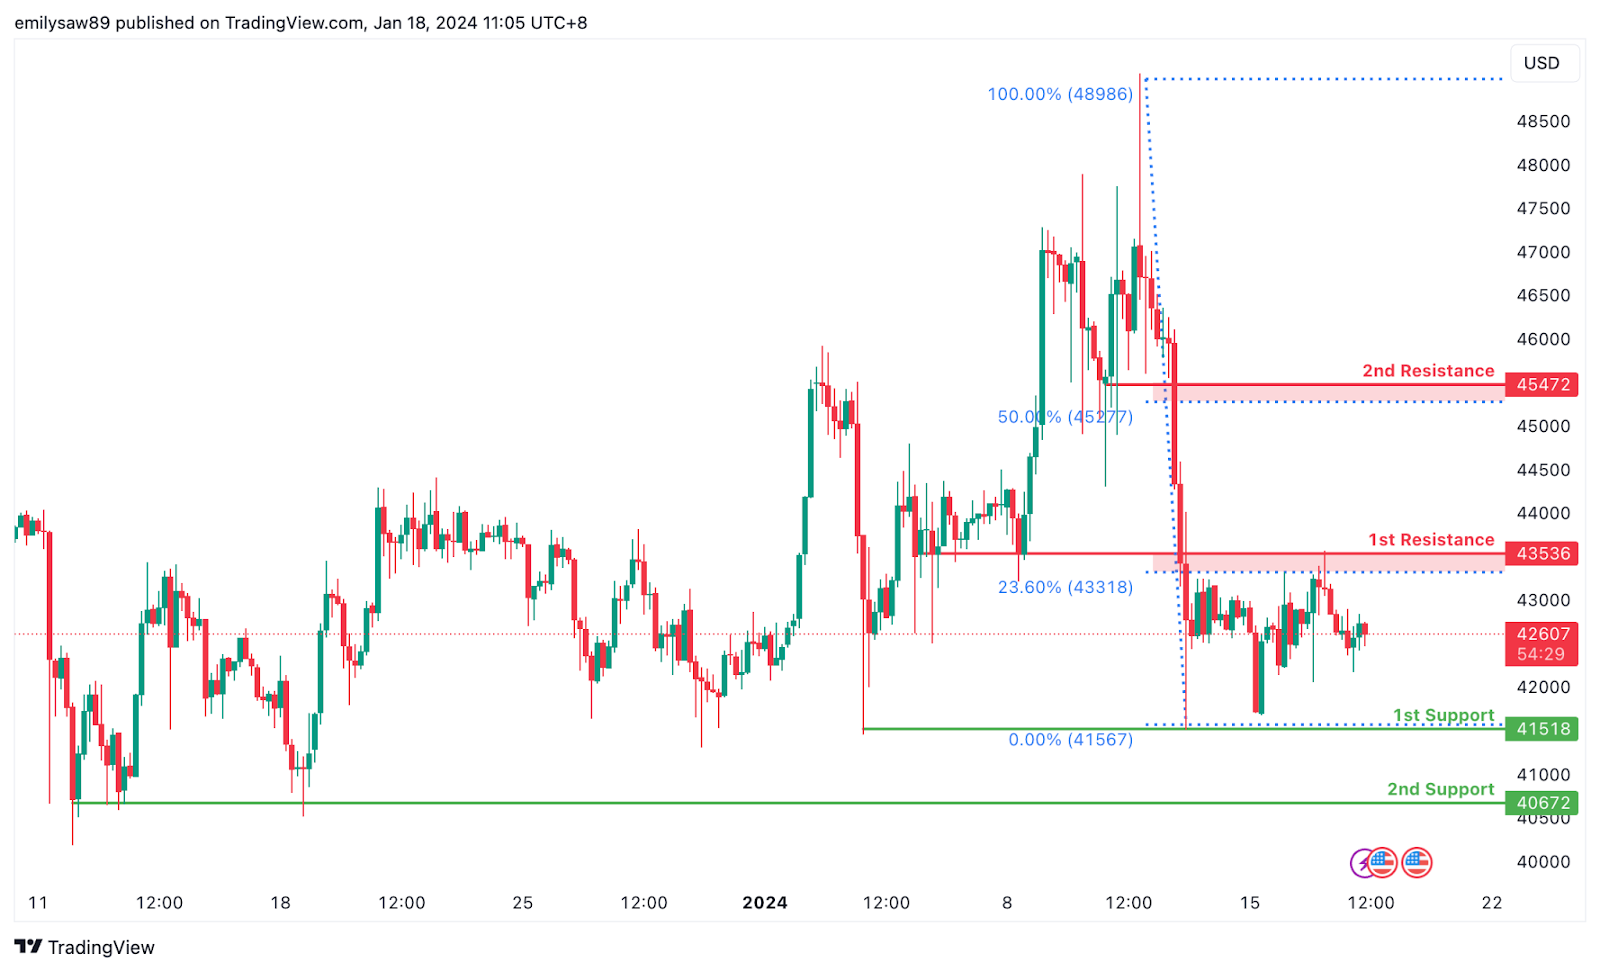
The BTC/USD chart is currently exhibiting a neutral overall momentum, suggesting a lack of a clear trend direction. In such a scenario, the price could potentially make fluctuations between the 1st resistance and 1st support levels.
The 1st support at 41518 is considered advantageous due to its identification as a multi-swing low support. This level has historical significance, indicating a point where buying interest has emerged in the past. Additionally, the 2nd support at 40672 is recognized as another multi-swing low support, providing additional strength to the support zone.
On the resistance side, the 1st resistance at 43536 is identified as an overlap resistance and coincides with the 23.60% Fibonacci Retracement. This confluence of technical factors adds strength to the potential resistance level. Furthermore, the 2nd resistance at 45472 is acknowledged as a pullback resistance and aligns with the 50% Fibonacci Retracement.
ETH/USD:
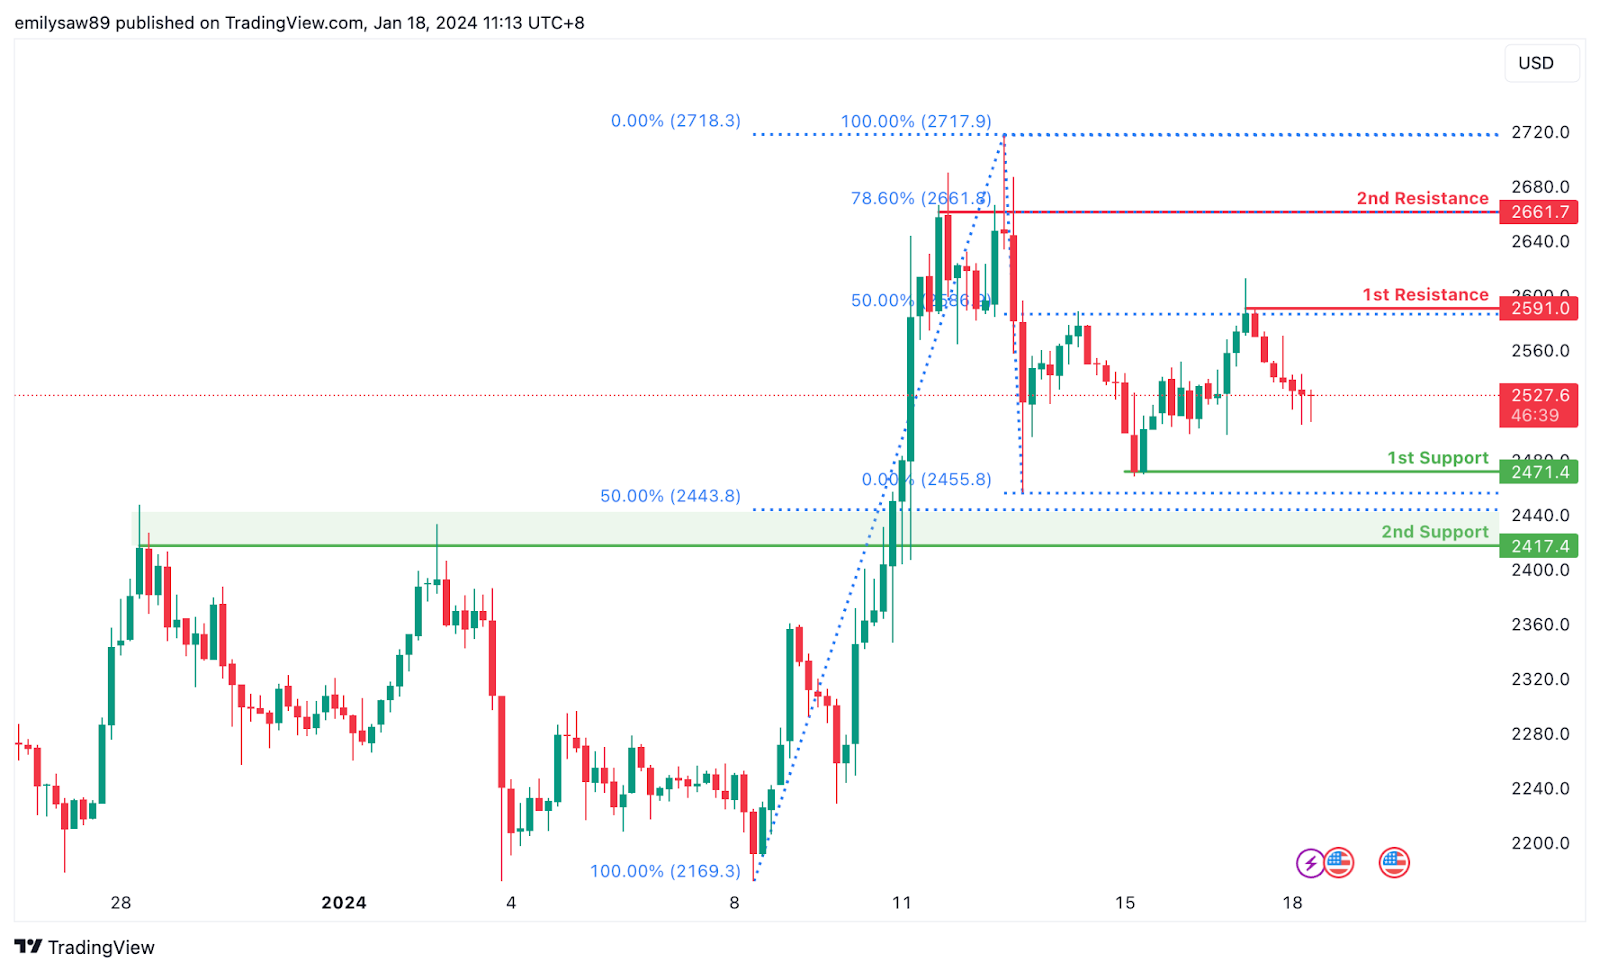
The ETH/USD chart is currently experiencing a bearish overall momentum, indicating a downward trend in the price movement. In this context, there is a potential scenario where the price could continue its bearish trend towards the 1st support level.
The 1st support at 2471.40 is considered favorable due to its identification as a pullback support. This level suggests historical significance, indicating a point where buying interest has previously emerged. Additionally, the 2nd support at 2417.40 is recognized as another pullback support and coincides with the 50% Fibonacci Retracement, adding confluence to its potential as a support level.
On the resistance side, the 1st resistance at 2591.00 is identified as a swing high resistance. This level represents a point where selling pressure has historically been observed. Furthermore, the 2nd resistance at 2661.70 is acknowledged as a multi-swing high resistance and aligns with the 78.60% Fibonacci Retracement, adding strength to the potential resistance level.
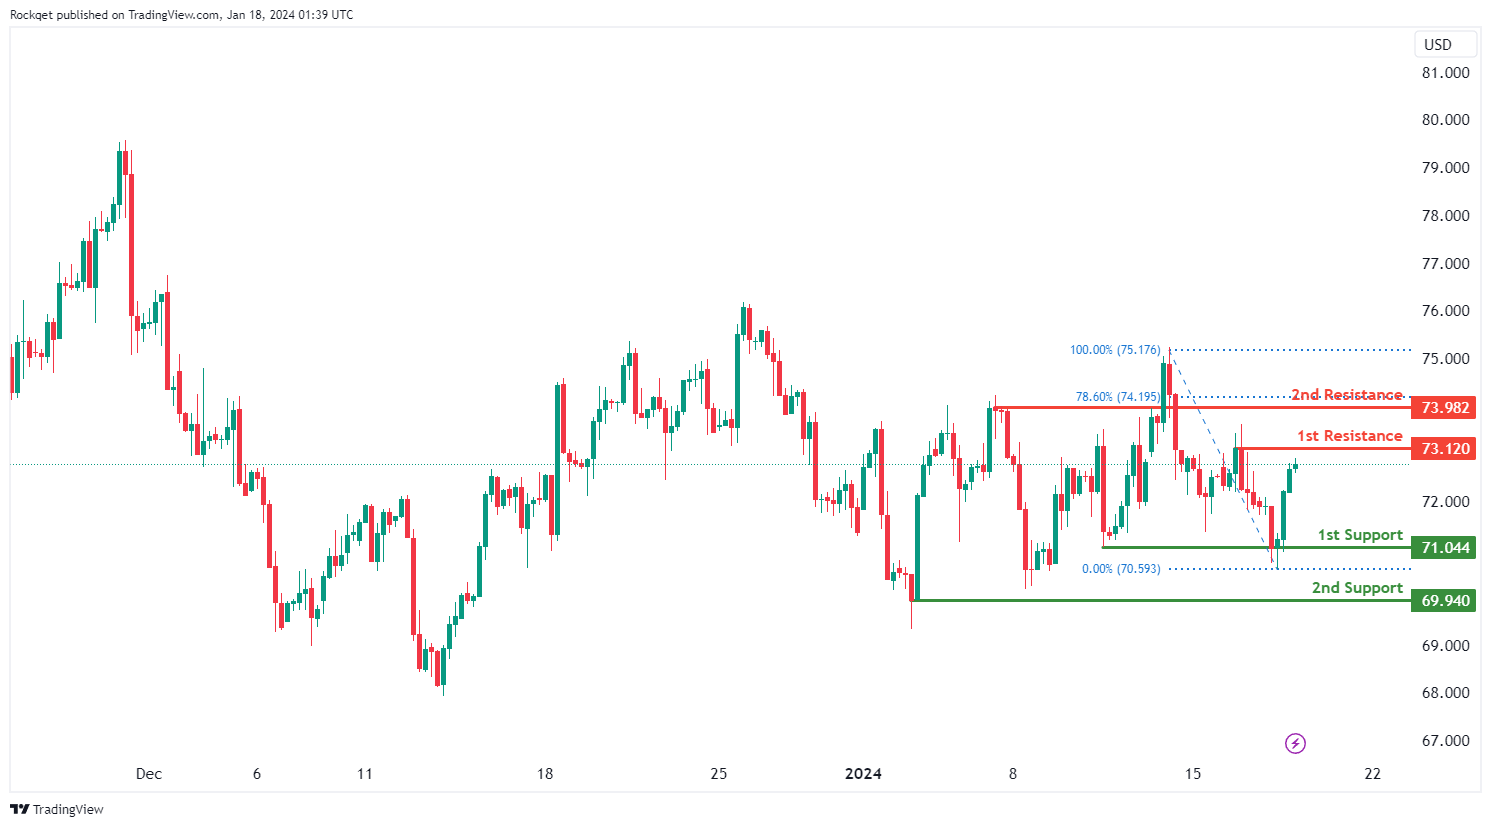
WTI/USD:
The WTI (West Texas Intermediate) chart currently exhibits a neutral bias, indicating a potential for price to fluctuate between the 1st resistance and the 1st support.
The 1st resistance level at 73.12 is identified as a pullback resistance. Higher up, the 2nd resistance level at 73.98 is also noted as a pullback resistance that aligns close to the 78.60% Fibonacci retracement level, suggesting a potential barrier for further upside movement.
To the downside, the 1st support level at 71.04 is identified as a pullback support. Further below, the 2nd support level at 69.94 is marked as a swing-low support, further reinforcing its importance as a key support level.
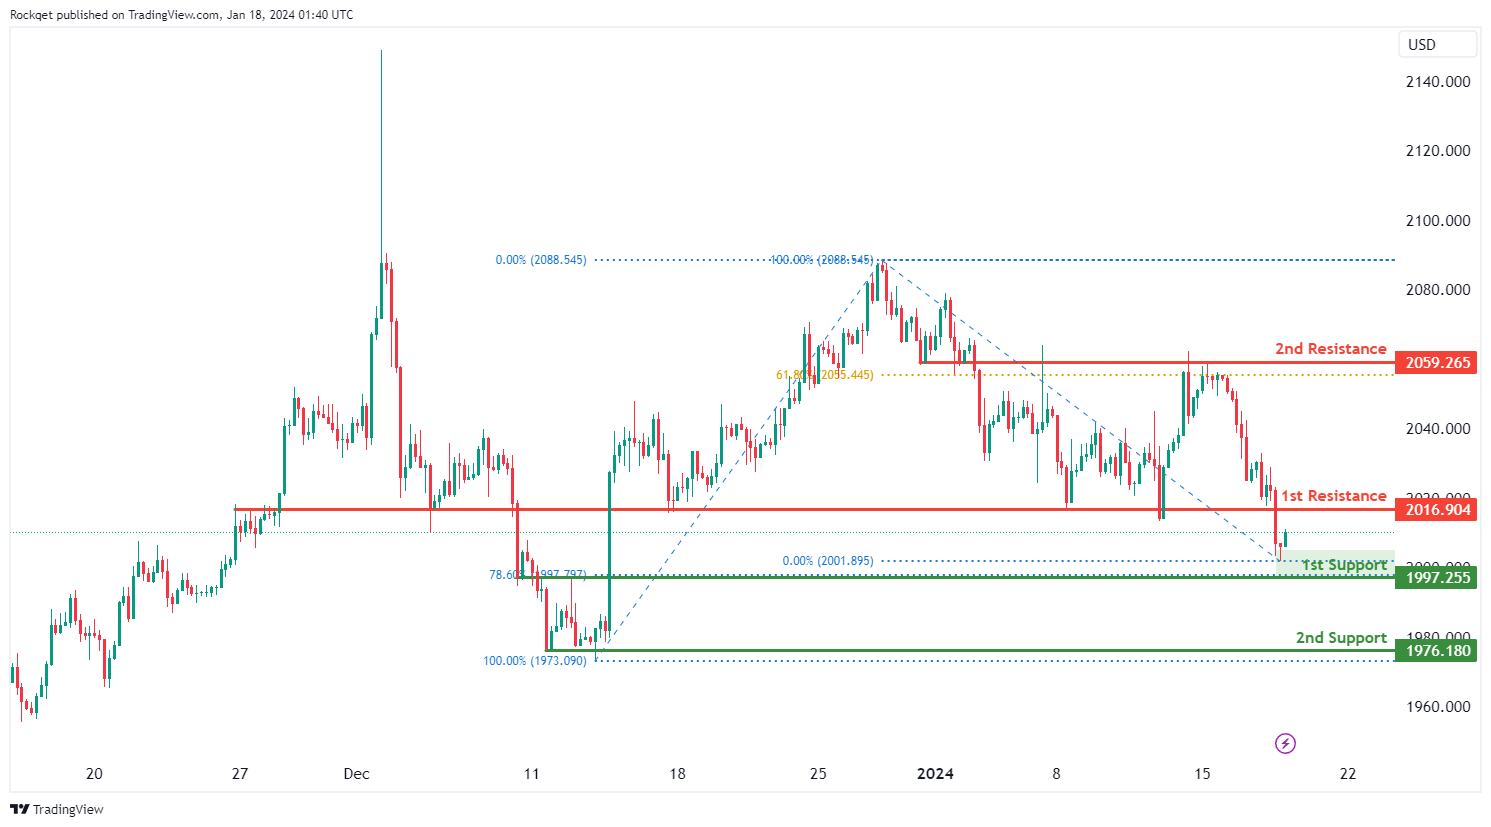
XAU/USD (GOLD):
The XAU/USD (Gold) chart currently exhibits an overall bearish momentum. However, there is a potential scenario for price to rise towards the 1st resistance before resuming the downtrend.
The 1st resistance level at 2,016.90 is identified as an overlap resistance. Higher up, the 2nd resistance level at 2,059.26 is also marked as an overlap resistance that aligns with the 61.80% Fibonacci retracement level, indicating a significant potential resistance point.
On the support side, the 1st support level at 1,997.25 is identified as an overlap support that aligns with the 78.60% Fibonacci retracement level. Further below, the 2nd support level at 1,976.18 is categorized as a swing-low support, further reinforcing its significance as a potential support zone.


