
DXY:
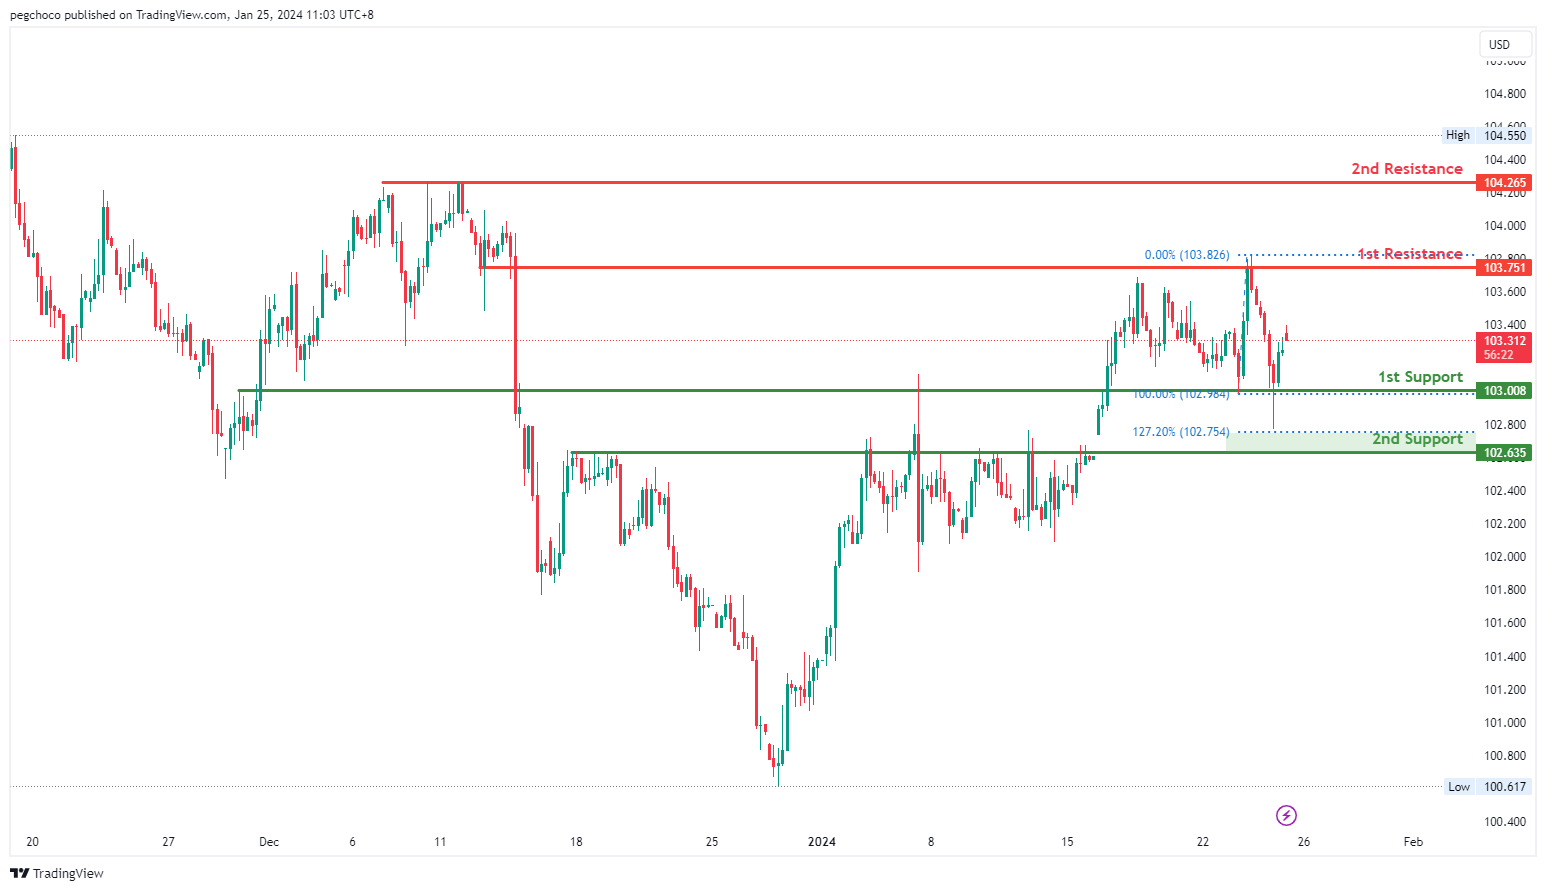
The DXY (US Dollar Currency Index) chart currently demonstrates a bullish overall momentum, indicating strength in the US Dollar. Your analysis suggests that there is potential for a bullish continuation in the price towards the 1st resistance level.
The 1st support level at 103.10 is considered significant as it represents an overlap support, indicating that this price level has previously acted as both support and resistance. This historical significance suggests it may serve as a strong area where price could potentially find support during a bullish move.
The 2nd support level at 102.63 is identified as a pullback support and also coincides with the 127.20% Fibonacci Extension level. This confluence of factors adds further significance to this support zone, implying that it may act as a notable support level during price pullbacks.
On the resistance side, the 1st resistance level at 103.75 is recognized as an overlap resistance, suggesting that this price level has historically served as both support and resistance. This makes it a potential barrier where selling pressure could emerge.
The 2nd resistance level at 104.26 is categorized as a multi-swing high resistance, indicating that it represents a historical point where the price has encountered resistance and potential selling interest.
EUR/USD:
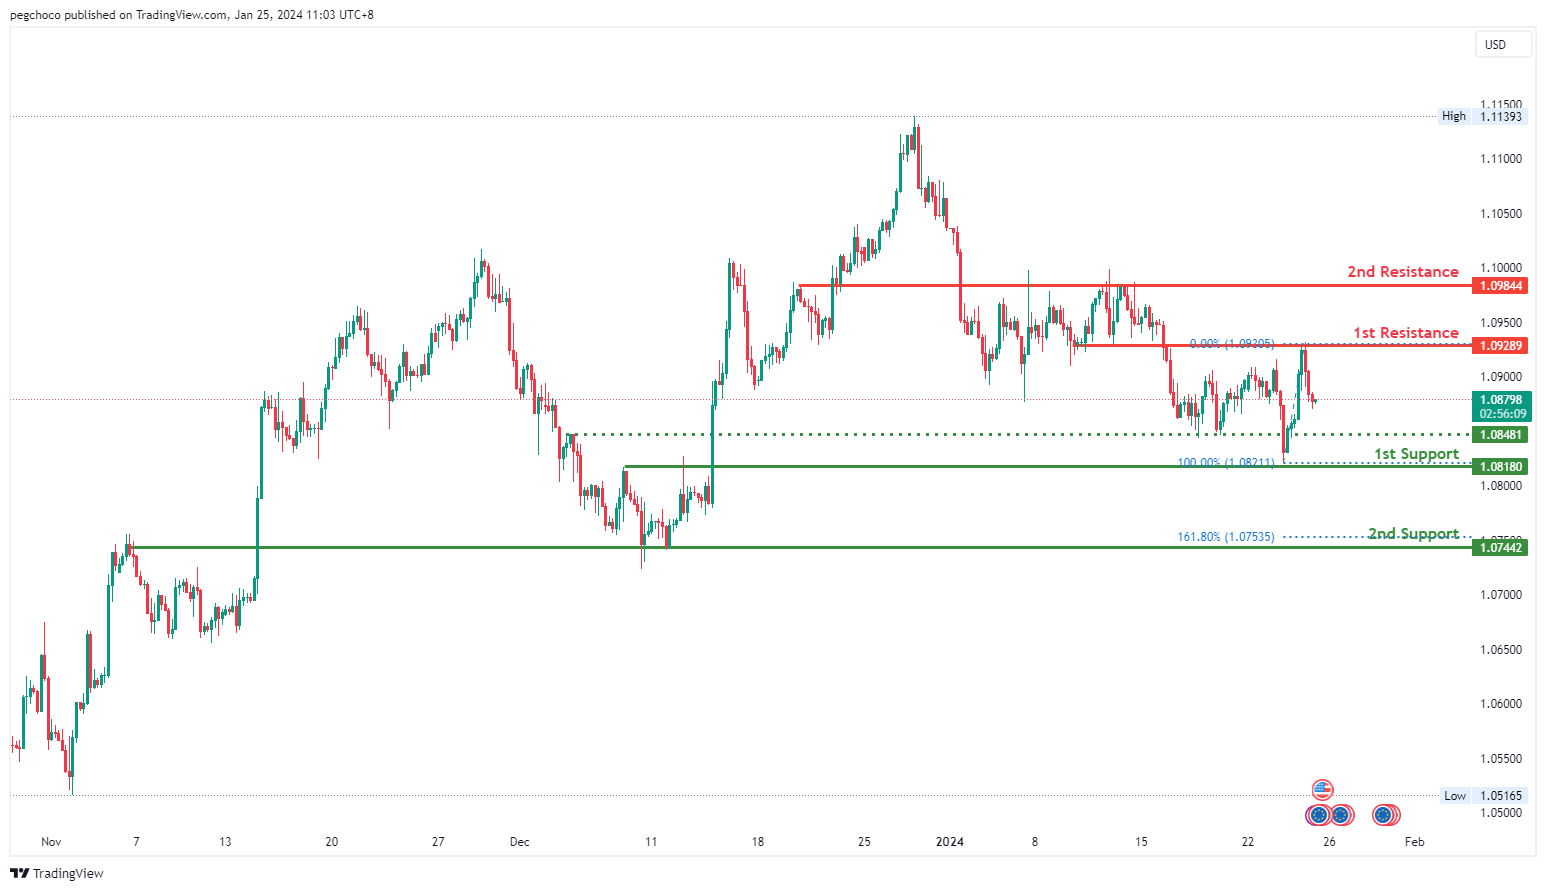
The EUR/USD trading pair is currently displaying a bearish overall momentum, indicating weakness in the Euro relative to the US Dollar. Your analysis suggests that there is potential for a bearish continuation in the price towards the 1st support level.
The 1st support level at 1.0818 is considered significant as it represents an overlap support, indicating that this price level has previously acted as both support and resistance. This suggests that it may serve as a strong area where price could potentially find support during a bearish move.
The 2nd support level at 1.0744 is identified as an overlap support and also coincides with the 161.80% Fibonacci Extension level. This confluence of factors adds further significance to this support zone, implying that it may act as a notable support level during price declines.
On the resistance side, the 1st resistance level at 1.0928 is recognized as an overlap resistance, suggesting that this price level has historically served as both support and resistance. This makes it a potential barrier where selling pressure could emerge.
The 2nd resistance level at 1.0984 is also identified as an overlap resistance, emphasizing its historical significance as a potential barrier for further upward price movement.
EUR/JPY:
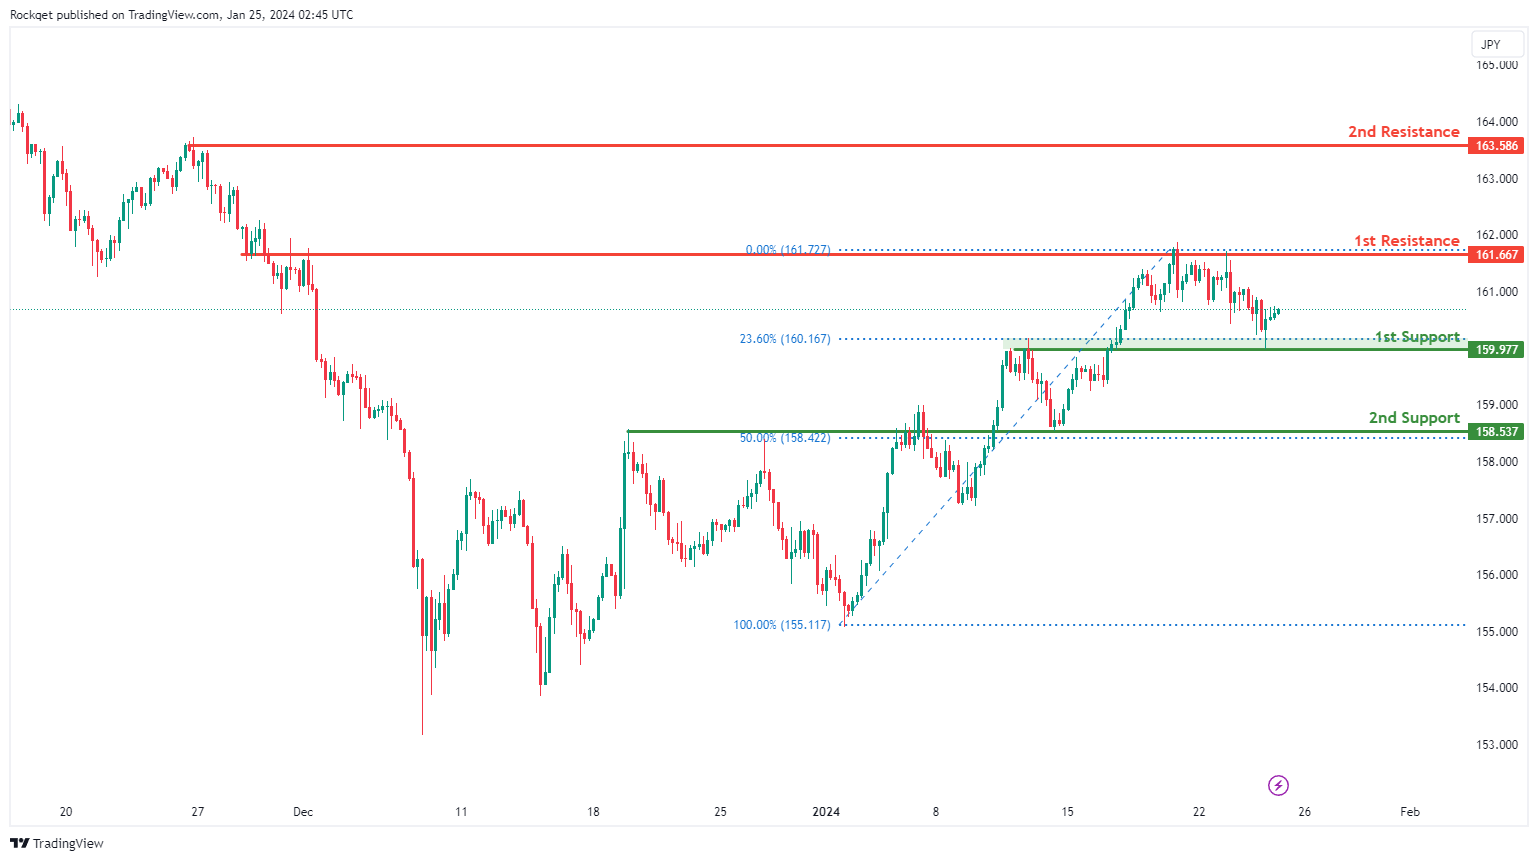
The EUR/JPY chart currently demonstrates a bullish overall momentum, indicating a positive trend direction. There are key support and resistance levels that traders should monitor for potential price movements.
The 1st support at 159.98 is identified as an overlap support and coincides with the 23.60% Fibonacci Retracement, suggesting historical significance as a level where buying interest has emerged before.
Additionally, the 2nd support at 158.54 is recognized as an overlap support and aligns with the 50% Fibonacci Retracement, providing additional strength to the support zone.
On the resistance side, the 1st resistance at 161.67 is significant for being an overlap resistance, marking a historical level where selling pressure has been present.
Furthermore, the 2nd resistance at 163.59 is a swing high resistance, indicating a potential point of price reversal.
EUR/GBP:
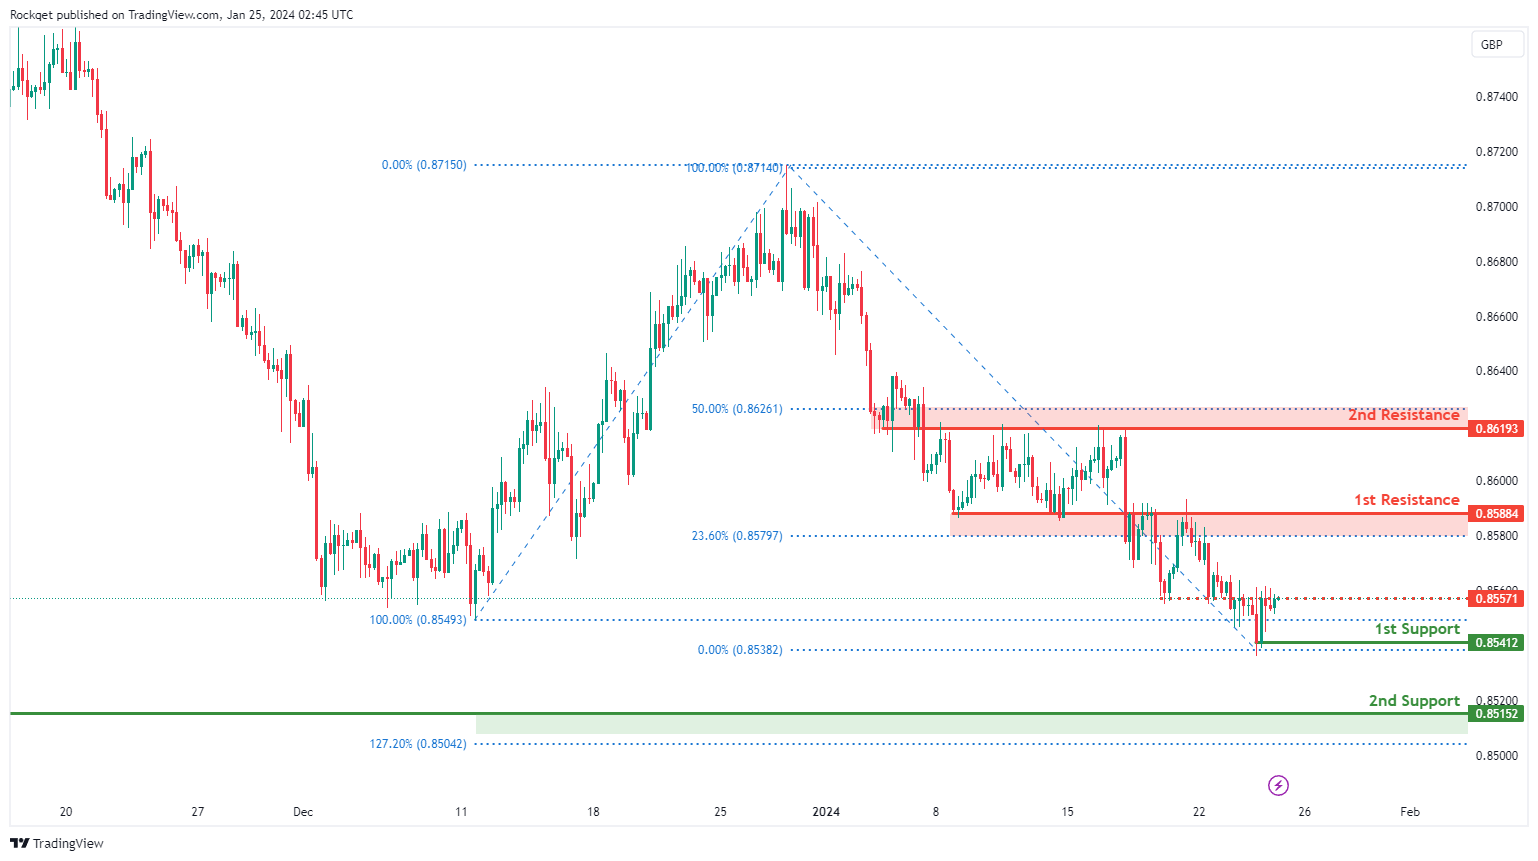
The EUR/GBP chart currently exhibits a bullish overall momentum, suggesting a positive trend direction. Several key support and resistance levels are identified, providing insights for potential price movements.
The 1st support at 0.8541 is considered favorable as it is recognized as a swing low support, representing a historical level where buying interest has previously emerged.
Additionally, the 2nd support at 0.8515 is acknowledged as a swing low support and coincides with the 127.20% Fibonacci Extension, adding confluence to the support zone.
On the resistance side, the intermediate resistance at 0.8557 is identified as an overlap resistance, marking a level where selling pressure may be present.
The 1st resistance at 0.8588 is significant for being an overlap resistance and aligns with the 23.60% Fibonacci Retracement, providing additional strength to this potential resistance level.
Furthermore, the 2nd resistance at 0.8619 is recognized as an overlap resistance and corresponds to the 50% Fibonacci Retracement.
GBP/USD:
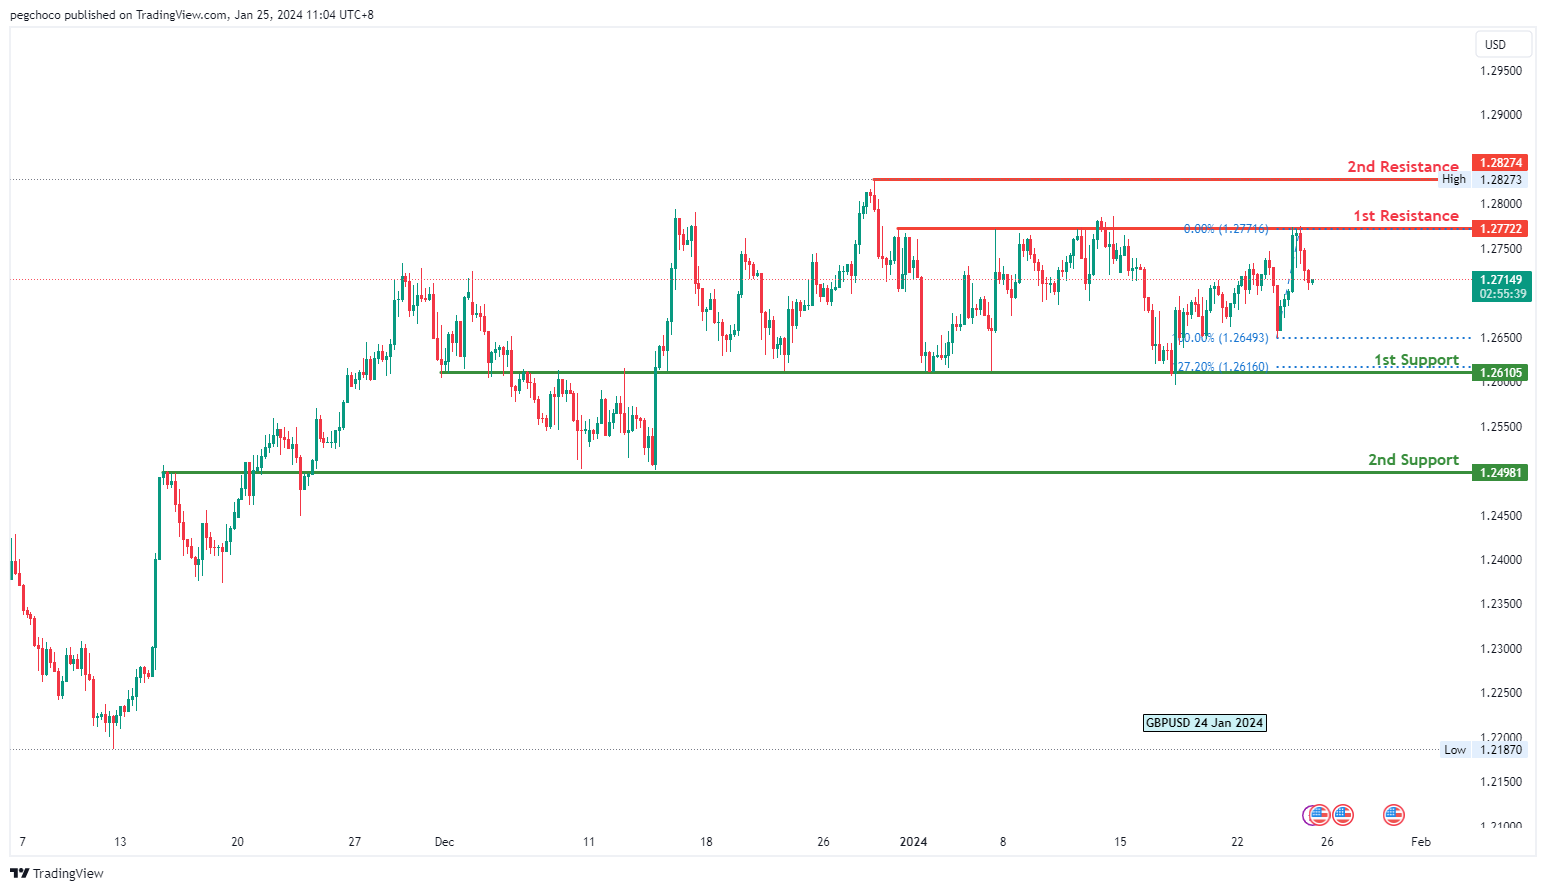
The GBP/USD trading pair currently has a bearish overall momentum, indicating weakness in the British Pound relative to the US Dollar. Your analysis suggests that there is potential for a bearish continuation in the price towards the 1st support level.
The 1st support level at 1.2610 is considered significant as it represents an overlap support and also coincides with the 127.20% Fibonacci Extension level. This confluence of factors adds further significance to this support zone, implying that it may serve as a strong area where price could potentially find support during a bearish move.
The 2nd support level at 1.2498 is identified as an overlap support, reinforcing its importance as a level where price has previously found both support and resistance.
On the resistance side, the 1st resistance level at 1.2772 is recognized as a multi-swing high resistance, indicating that it represents a historical point where the price has encountered resistance and potential selling interest.
The 2nd resistance level at 1.2827 is categorized as a swing high resistance, suggesting that it represents a historical point where the price has encountered resistance.
GBP/JPY:
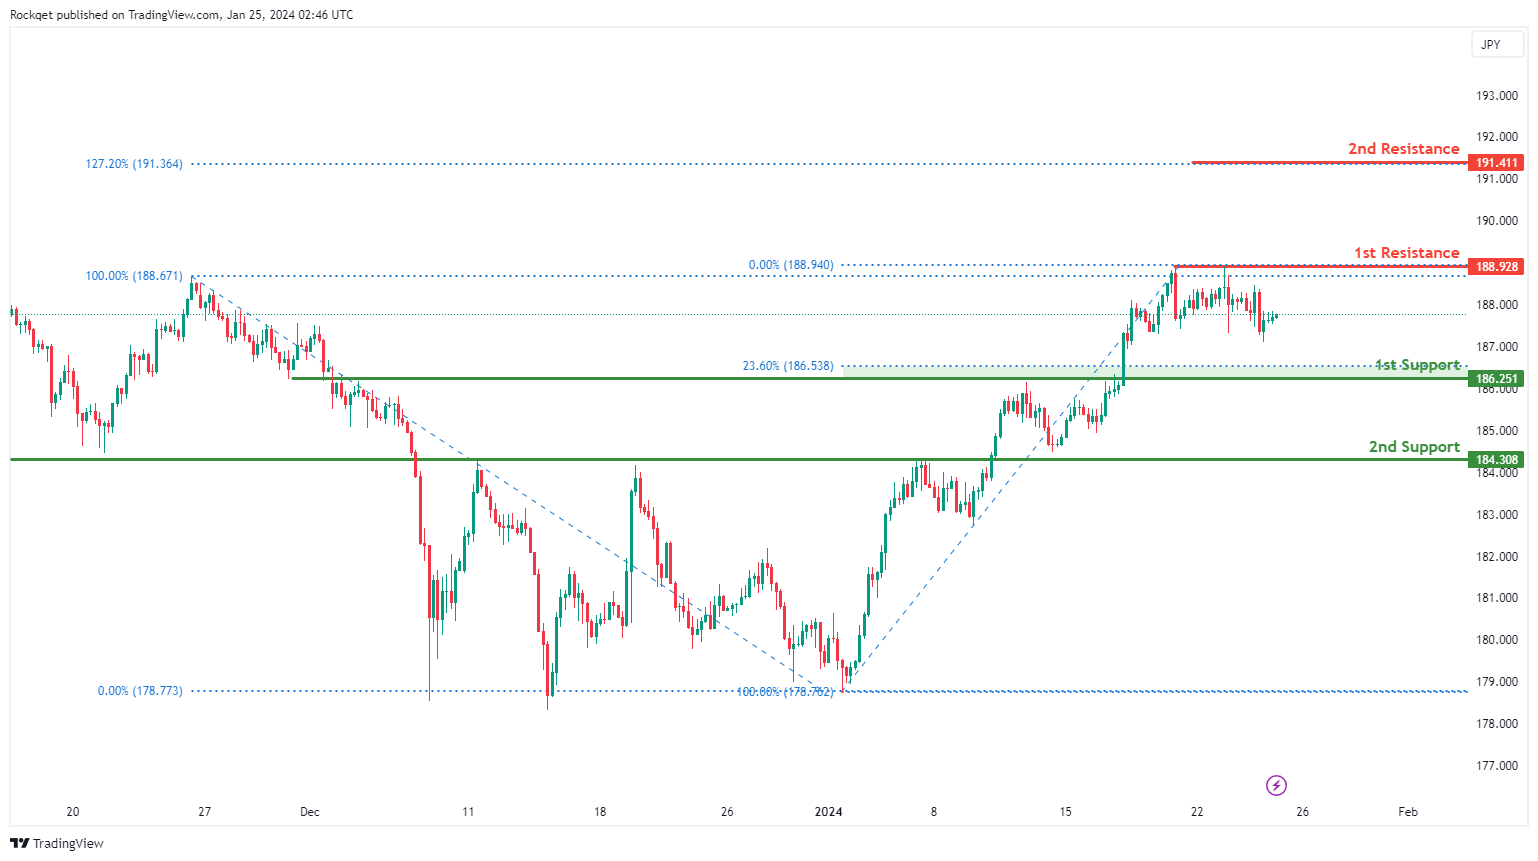
The GBP/JPY chart currently demonstrates a neutral overall momentum, indicating a lack of a clear trend direction. In such a market environment, the price could potentially experience fluctuations between key support and resistance levels.
The 1st support at 186.25 is identified as an overlap support and coincides with the 23.60% Fibonacci Retracement, marking a historical level where buying interest has previously emerged. Additionally, the 2nd support at 184.31 is recognized as a pullback support, providing additional strength to the support zone.
On the resistance side, the 1st resistance at 188.93 is considered significant for being a swing high resistance. This level suggests a historical point where selling pressure has been notable. Furthermore, the 2nd resistance at 191.41 is noteworthy as it aligns with the 127.20% Fibonacci Extension, adding confluence to its potential as a resistance level.
USD/CHF:
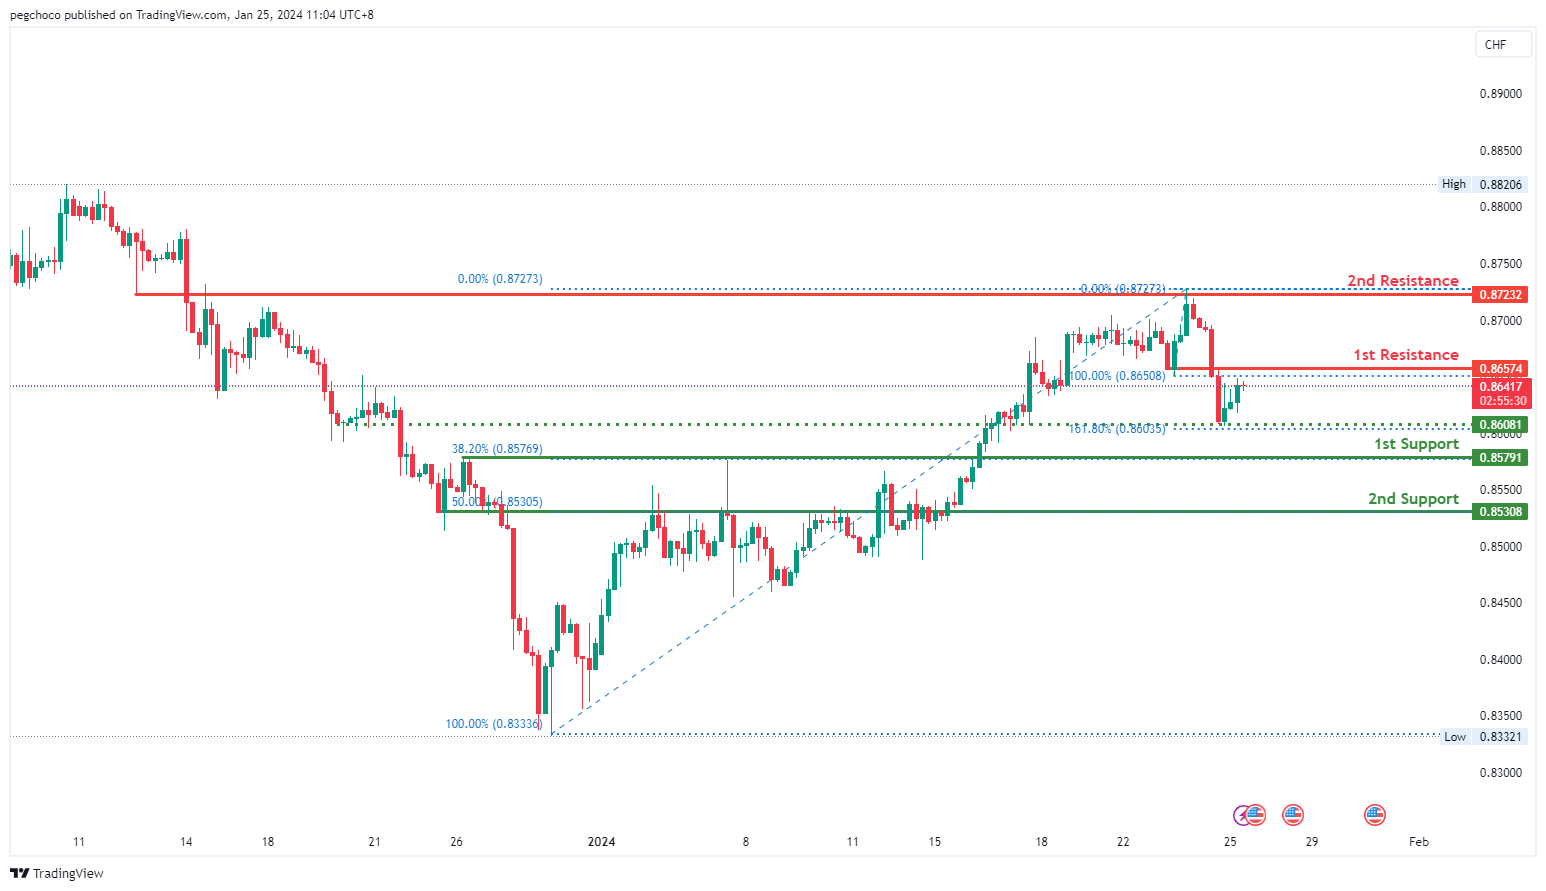
The USD/CHF trading pair is currently displaying a bearish overall momentum, indicating weakness in the US Dollar relative to the Swiss Franc. According to your analysis, there is potential for a bearish reaction off the 1st resistance level, followed by a drop towards the 1st support level.
The 1st support level at 0.8579 is considered significant as it represents a pullback support and coincides with the 38.20% Fibonacci Retracement level. This confluence of factors adds further significance to this support zone, suggesting it may serve as a strong area where price could potentially find support during a bearish move.
The 2nd support level at 0.8530 is identified as a pullback support and aligns with the 50% Fibonacci Retracement level, further reinforcing its importance as a potential support level during price pullbacks.
On the resistance side, the 1st resistance level at 0.8657 is recognized as a pullback resistance, implying that it might act as a notable resistance point during price pullbacks.
USD/JPY:
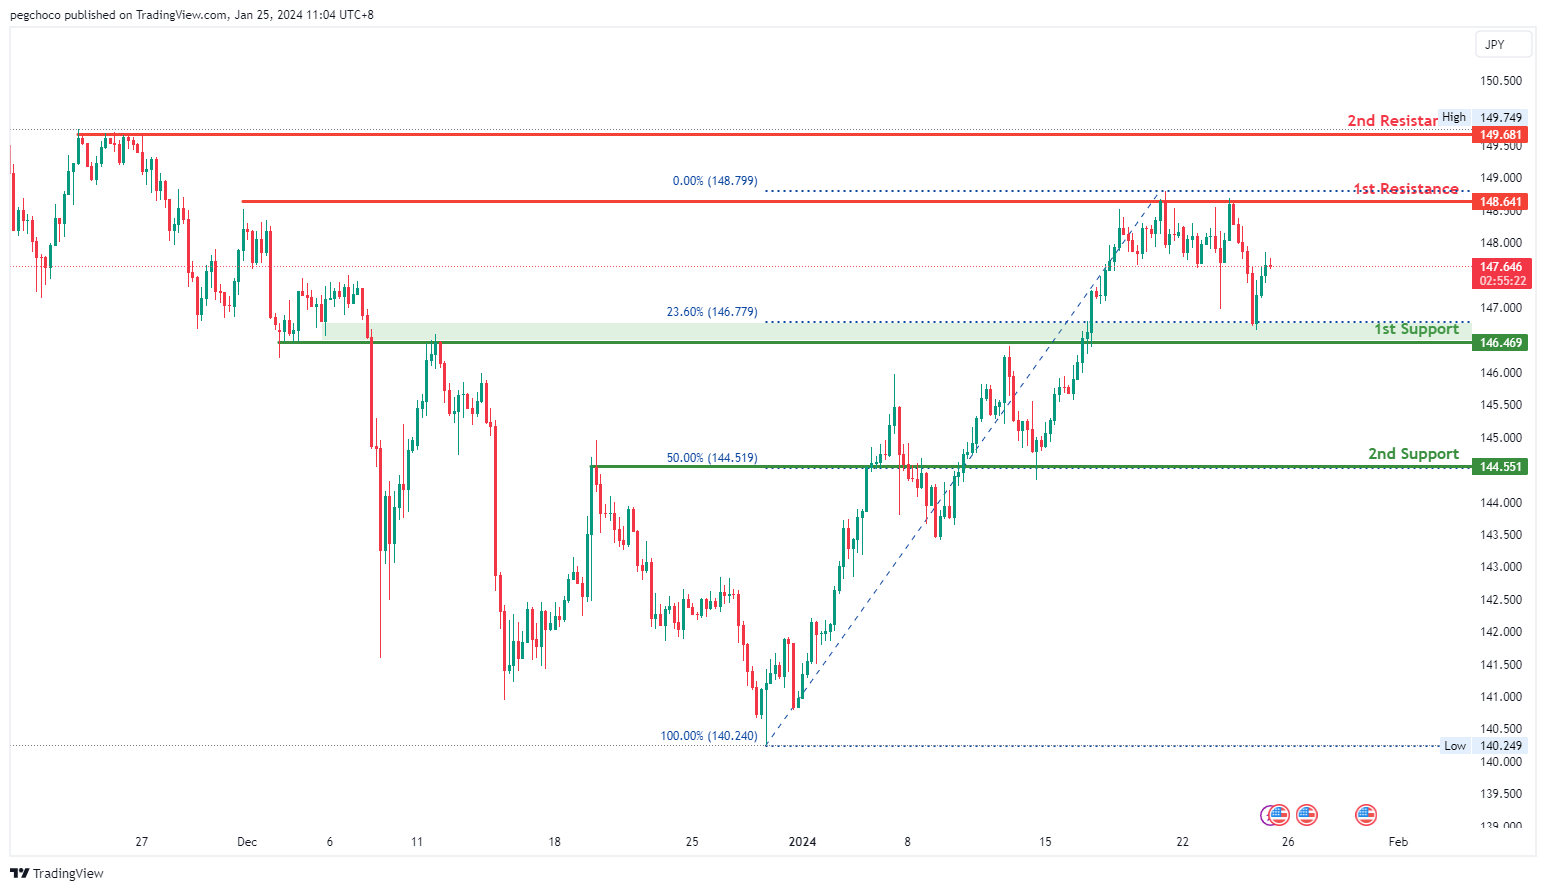
The USD/JPY trading pair currently demonstrates a bearish overall momentum, indicating weakness in the US Dollar relative to the Japanese Yen. According to your analysis, there is potential for a short-term rise in price towards the 1st resistance level before reversing off it and subsequently dropping towards the 1st support level.
The 1st support level at 146.46 is considered significant as it represents an overlap support and also coincides with the 23.60% Fibonacci Retracement level. This confluence of factors adds further significance to this support zone, suggesting it may serve as a strong area where price could potentially find support during a bearish move.
The 2nd support level at 144.55 is identified as an overlap support and aligns with the 50% Fibonacci Retracement level, further reinforcing its importance as a potential support level during price declines.
On the resistance side, the 1st resistance level at 148.64 is recognized as a multi-swing high resistance. This implies that it represents a historical point where the price has encountered resistance and potential selling interest.
The 2nd resistance level at 149.68 is categorized as a multi-swing high resistance, indicating its significance as a point where the price has historically faced resistance.
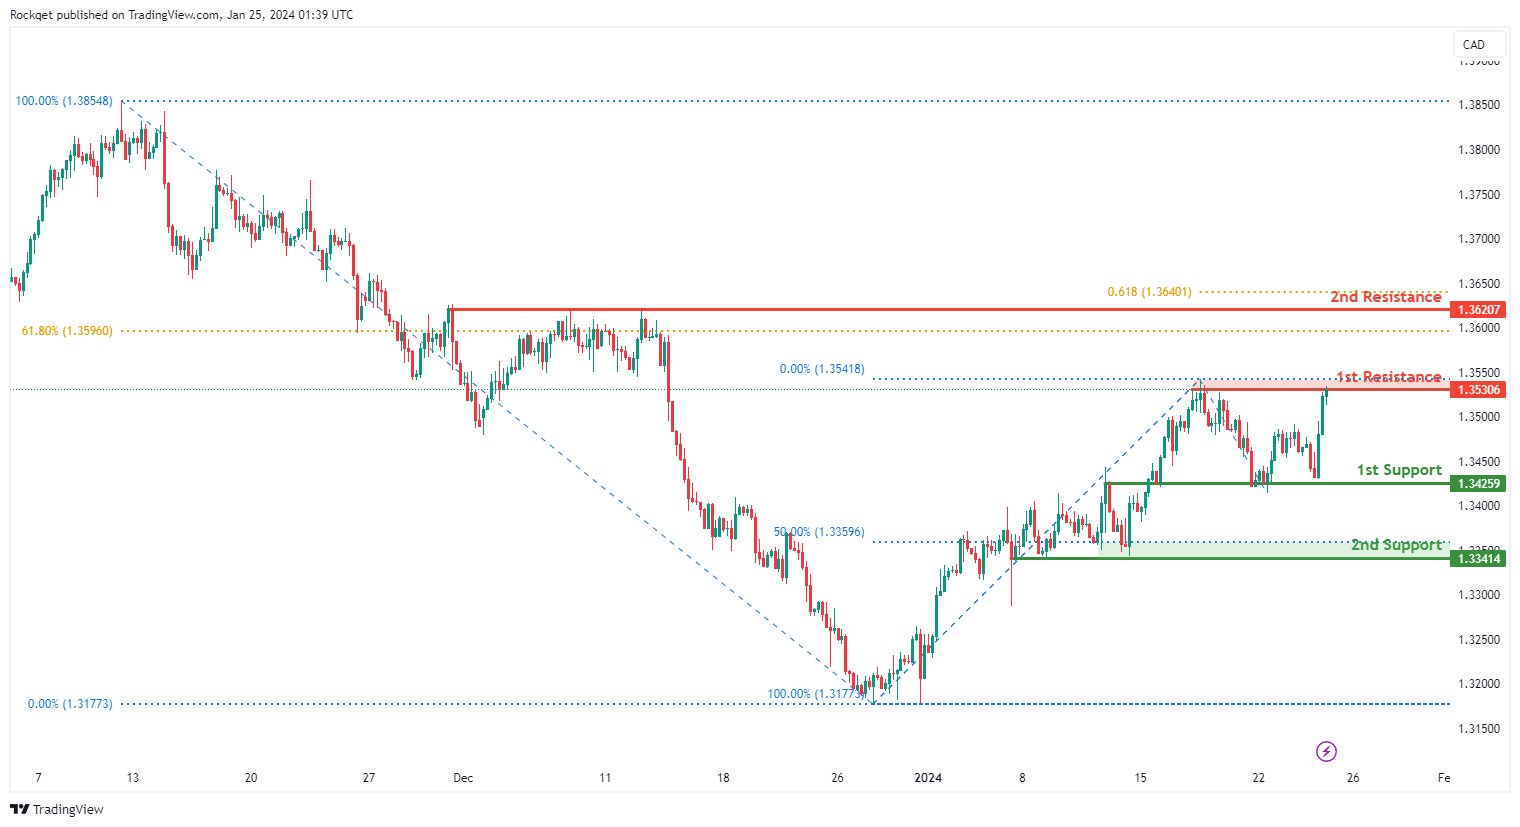
USD/CAD:
The USD/CAD chart currently exhibits an overall bullish momentum. However, there is a potential scenario for price to make a bearish reaction off the 1st resistance to drop lower before resuming the uptrend.
The 1st resistance level at 1.3530 is identified as a pullback resistance. Higher up, the 2nd resistance level at 1.3620 is also noted as a pullback resistance that aligns close to a confluence of Fibonacci levels i.e. the 61.80% retracement and the 61.80% projection, further reinforcing its significance as a potential resistance zone.
To the downside, the 1st support level at 1.3425 is identified as an overlap support. Further below, the 2nd support level at 1.3341 is marked as a pullback support that aligns close to the 50.00% Fibonacci retracement level, further reinforcing its importance as a key support level.
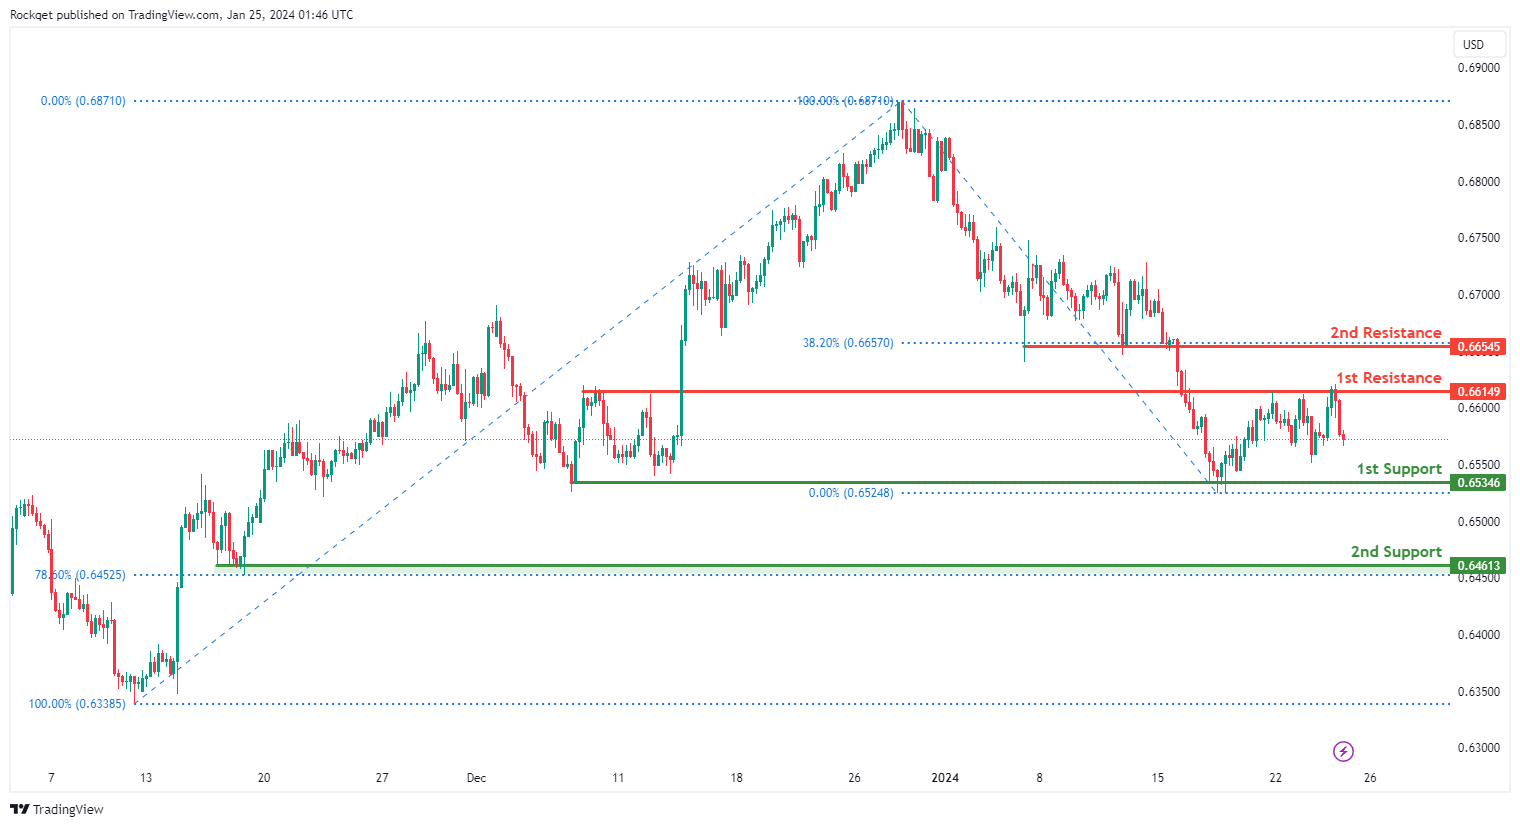
AUD/USD:
The AUD/USD chart currently exhibits an overall bearish momentum. In this context, there is a potential scenario for price to drop towards the 1st support.
The 1st support level at 0.6534 is identified as a pullback support. Further below, the 2nd support level at 0.6461 is also marked as a pullback support that aligns close to the 78.60% Fibonacci retracement level, further reinforcing its importance as a key support level.
To the upside, the 1st resistance level at 0.6614 is identified as a pullback resistance. Higher up, the 2nd resistance level at 0.6654 is also noted as a pullback resistance that aligns with the 38.20% Fibonacci retracement level, suggesting a potential barrier for further upside movement.
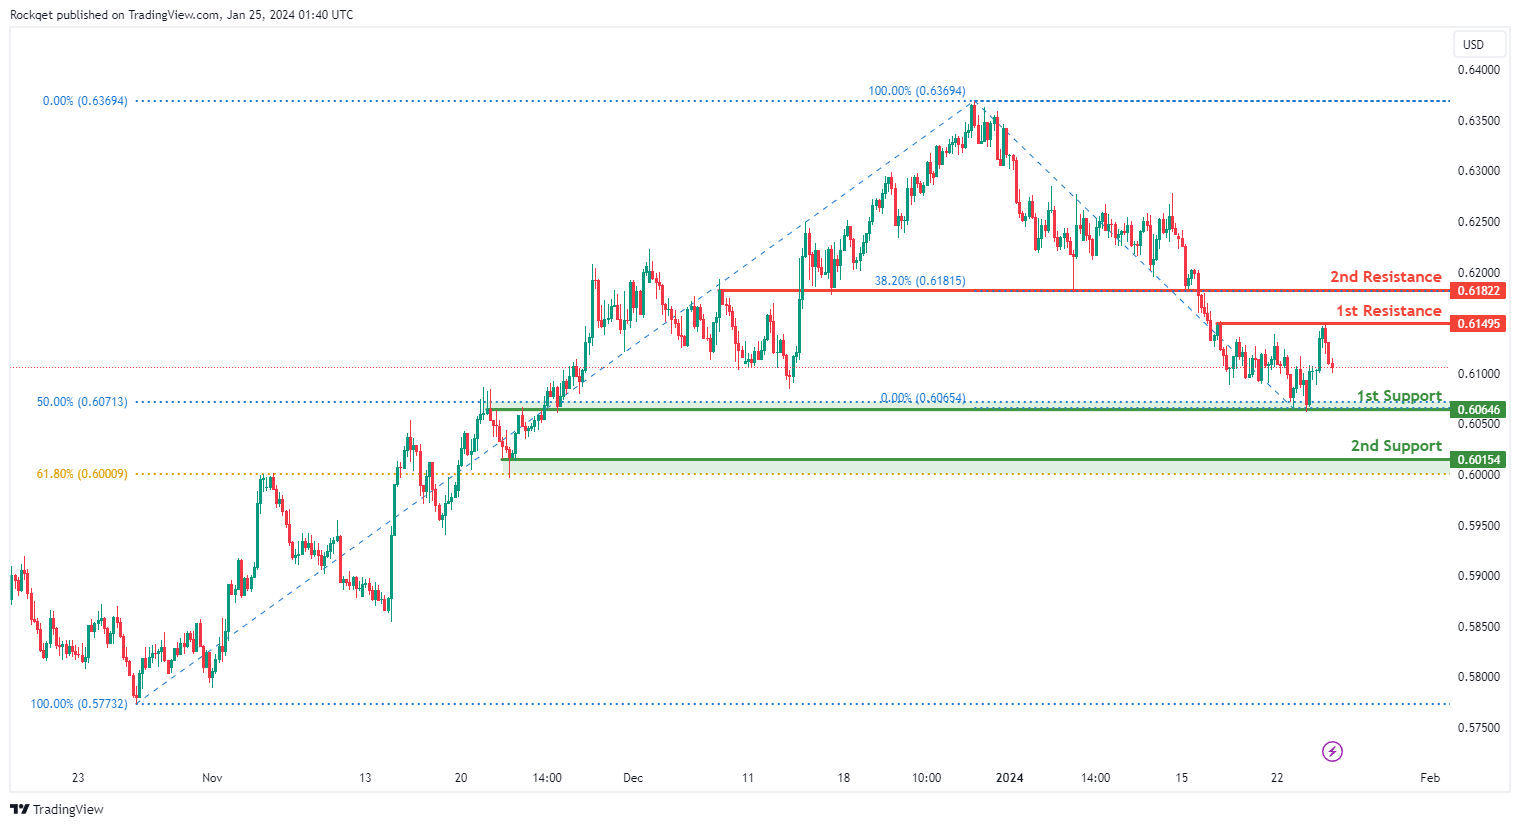
NZD/USD
The NZD/USD chart currently exhibits an overall bearish momentum. In this context, there is a potential scenario for price to drop towards the 1st support.
The 1st support level at 0.6064 is identified as an overlap support that aligns close to the 50.00% Fibonacci retracement level. Further below, the 2nd support level at 0.6015 is marked as a pullback support that aligns close to the 61.80% Fibonacci retracement level, further reinforcing its importance as a key support level.
To the upside, the 1st resistance level at 0.6149 is identified as a pullback resistance. Higher up, the 2nd resistance level at 0.6182 is noted as an overlap resistance that aligns with the 38.20% Fibonacci retracement level, suggesting a potential barrier for further upside movement.
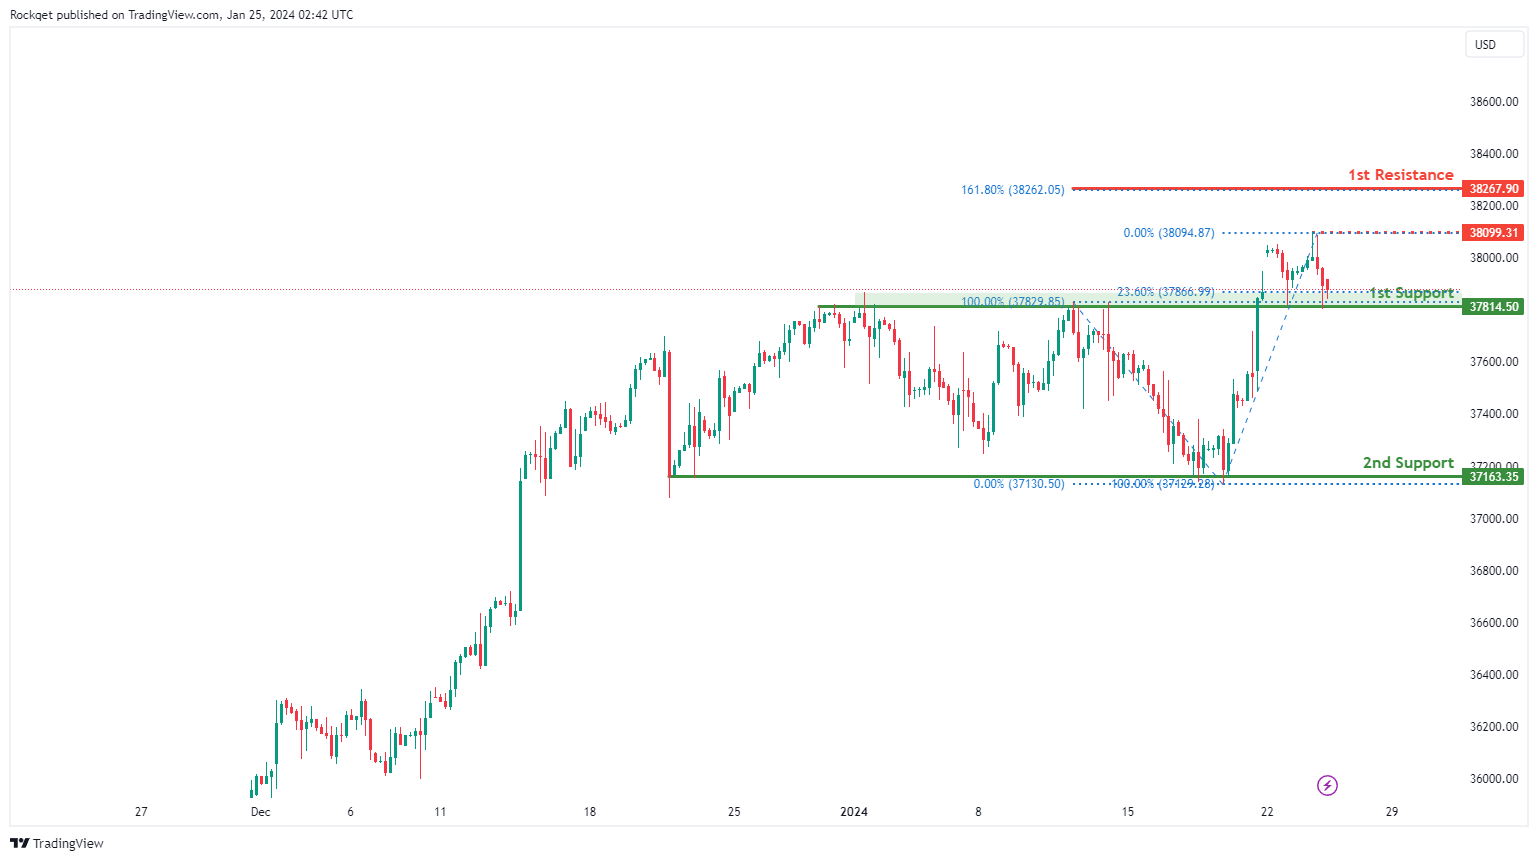
DJ30:
The DJ30 (Dow Jones Industrial Average) chart currently exhibits a bearish overall momentum, indicating a prevailing downward trend. In this market scenario, the price is anticipated to potentially continue its bearish movement towards the 1st support.
The 1st support at 37814.50 is considered favorable for several reasons. Firstly, it is identified as an overlap support, representing a historical level where buying interest has previously emerged. Additionally, this support level coincides with the 23.60% Fibonacci Retracement, further strengthening its significance.
The 2nd support at 37163.35 is recognized as a multi-swing low support, providing additional reinforcement to the potential support zone.
On the resistance side, the intermediate resistance at 38099.31 is highlighted as a level where swing high resistance is observed. This level may pose a challenge to the bearish momentum.
Furthermore, the 1st resistance at 38267.90 is identified as the 161.80% Fibonacci Extension, adding confluence to its potential as a resistance level.
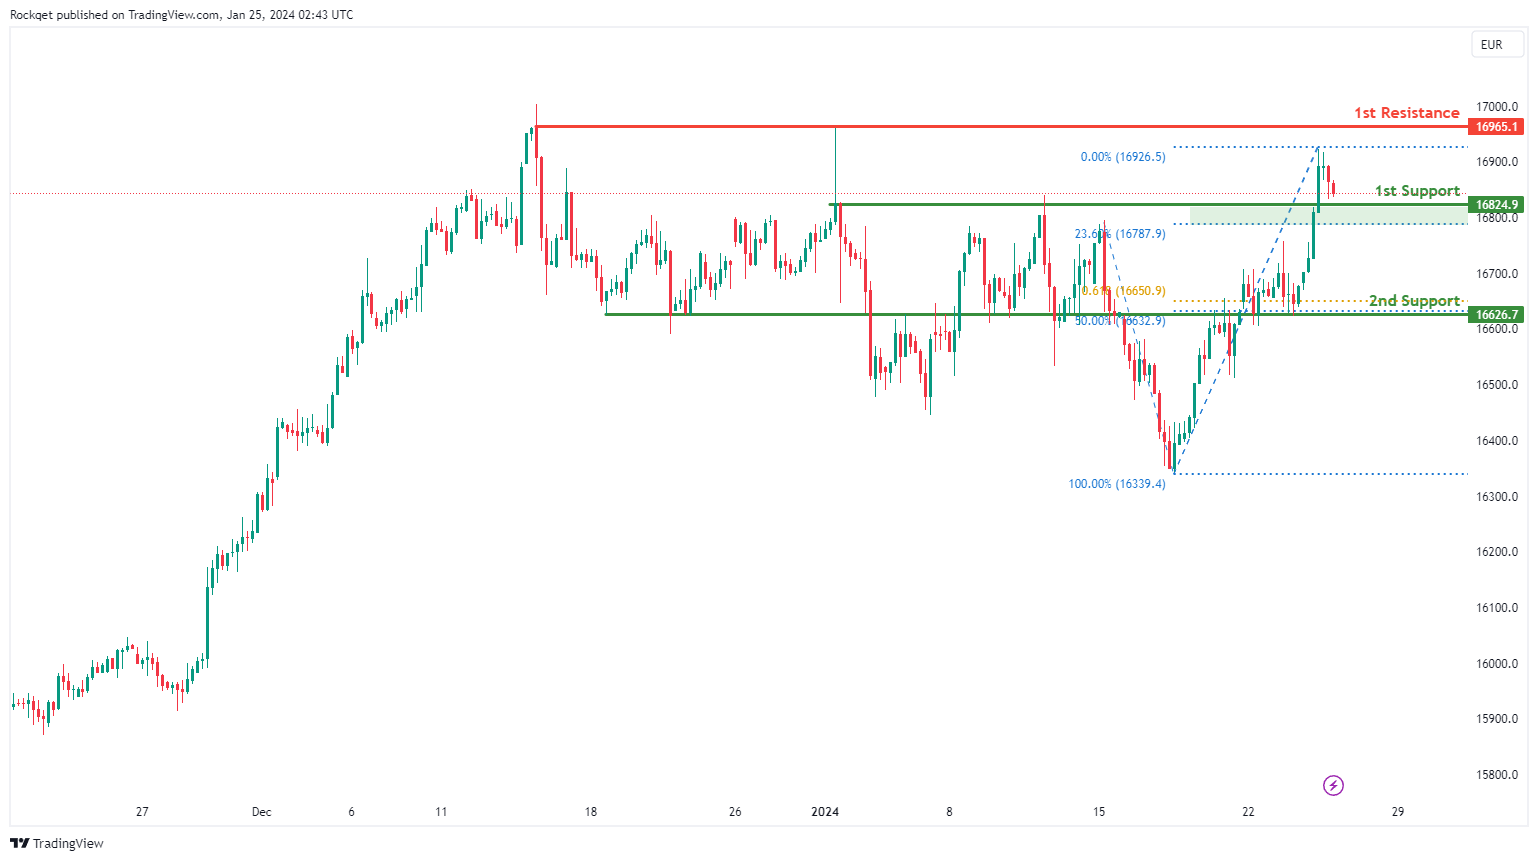
GER40:
The GER40 (DAX) chart currently exhibits a bearish overall momentum, indicating a prevailing downward trend. Several factors contribute to this bearish momentum, suggesting potential downward movement in the price.
The 1st support at 16824.90 is considered favorable for several reasons. Firstly, it is identified as a pullback support, indicating a historical level where buying interest has previously emerged. Additionally, this support level aligns with the 23.60% Fibonacci Retracement, adding confluence to its significance.
The 2nd support at 16626.70 is recognized as a multi-swing low support, providing additional strength to the potential support zone. Furthermore, it coincides with the 50% Fibonacci Retracement and the 61.80% Fibonacci Projection, further reinforcing its importance.
On the resistance side, the 1st resistance at 16965.10 is highlighted as a swing high resistance. This level may act as a barrier to the bearish momentum.
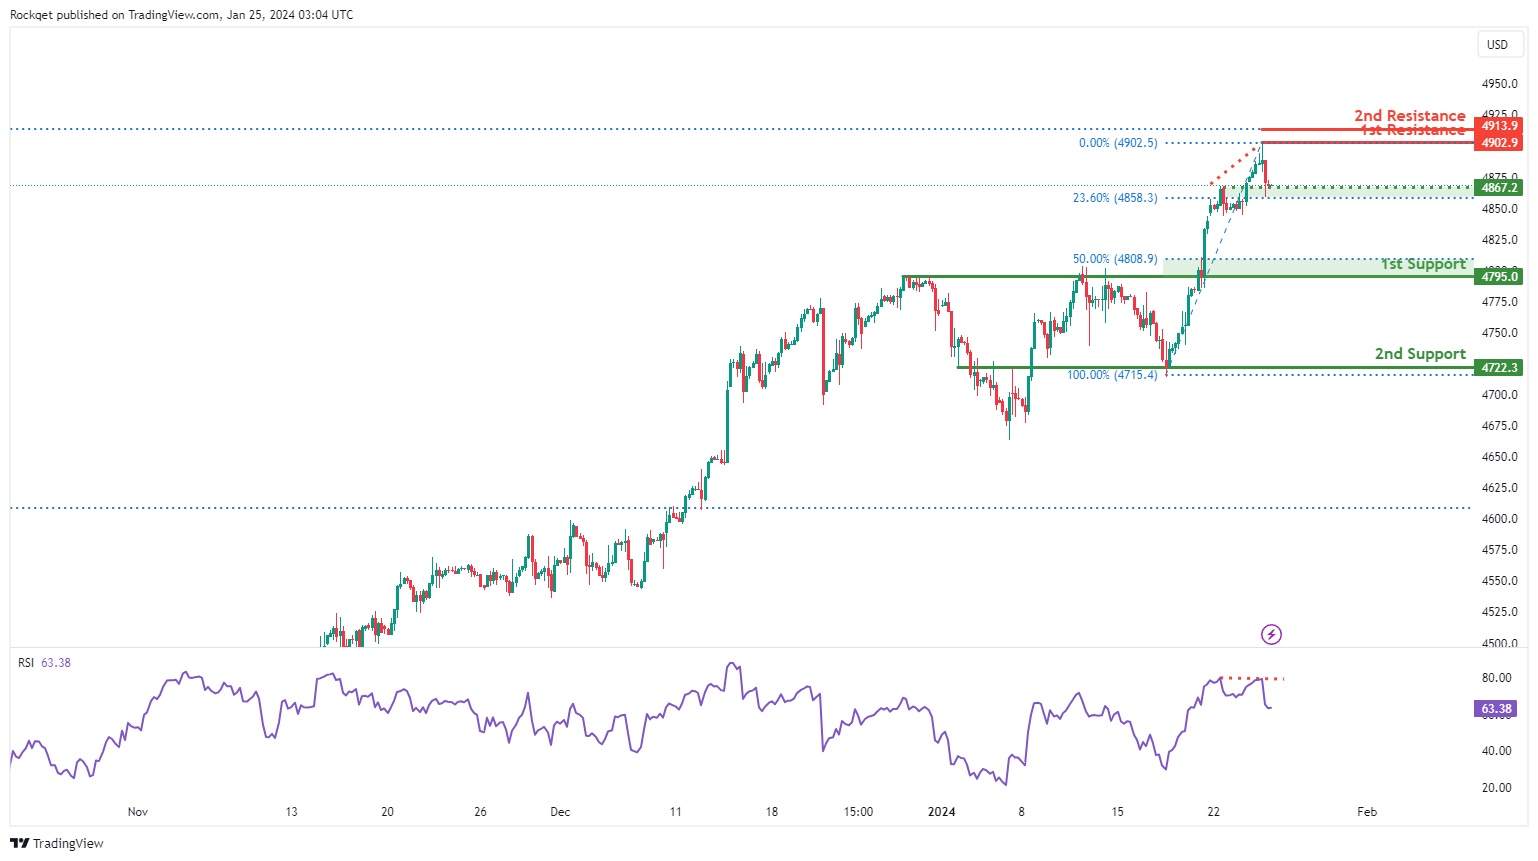
US500:
The US500 (S&P 500) chart currently portrays a bearish overall momentum, signaling a prevailing downward trend. Various factors contribute to this bearish sentiment, hinting at potential further declines in the price.
The 1st support at 4795.0 holds significance for several reasons. Firstly, it serves as a pullback support, representing a historical level where buying interest has previously emerged. Additionally, this support level aligns harmoniously with the 50% Fibonacci Retracement, enhancing its overall significance.
The 2nd support at 4722.3 is identified as an overlap support, adding robustness to the potential support zone.
Intermediate support at 4867.2 is characterized by its nature as an overlap support and its alignment with the 23.60% Fibonacci Retracement. This confluence reinforces the importance of this support level.
On the resistance levels, the 1st resistance at 4902.9 stands out as a swing high resistance, potentially acting as a barrier to the bearish momentum.
The 2nd resistance at 4913.9 corresponds to the 161.80% Fibonacci Extension, adding an additional layer of significance to the potential resistance zone.
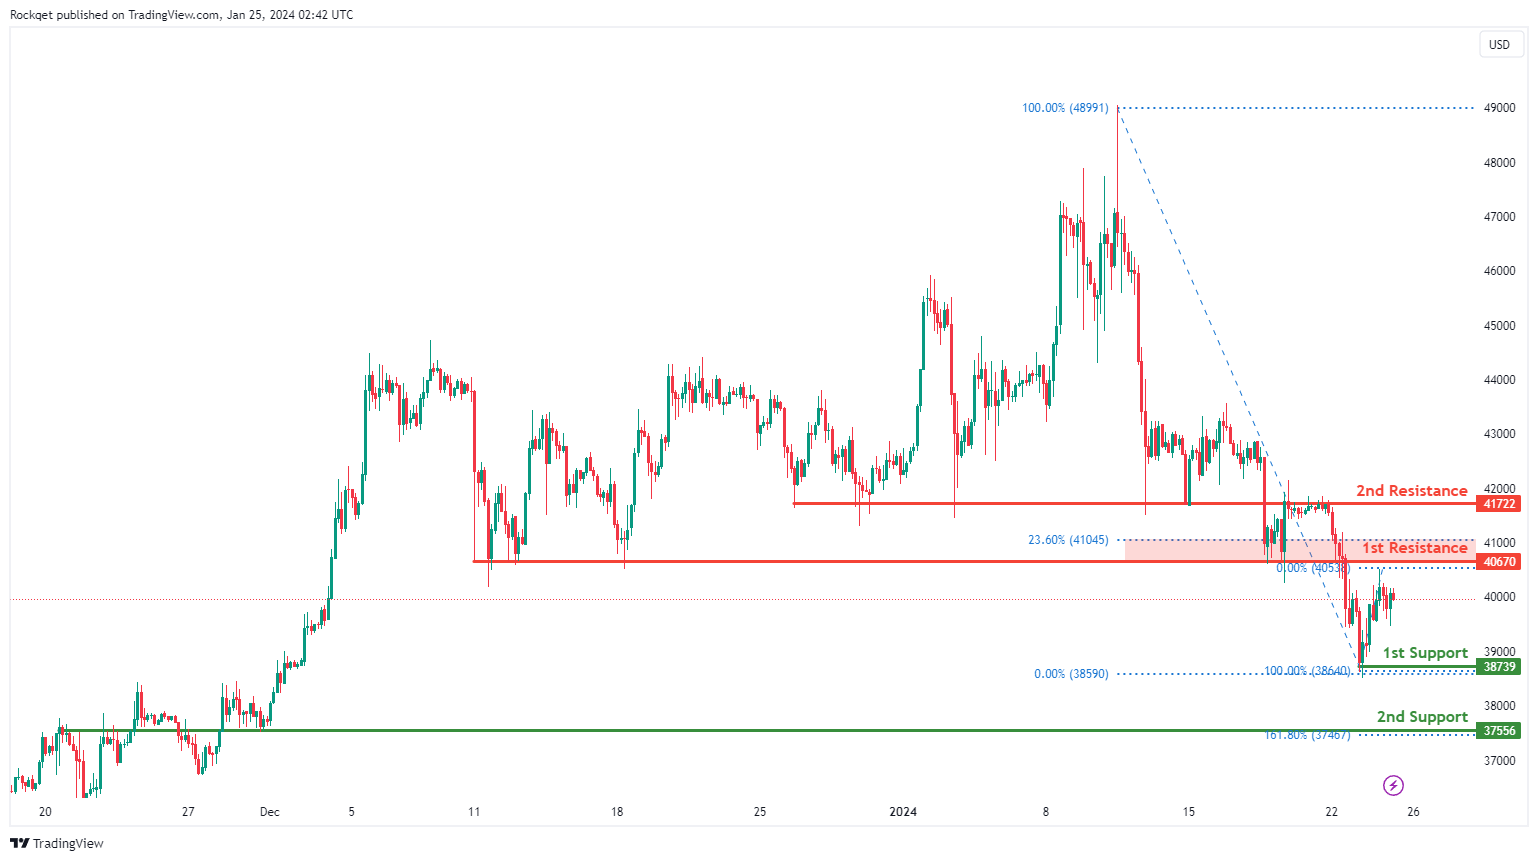
BTC/USD:
The BTC/USD chart currently reflects a weak bullish overall momentum with low confidence, indicating a tentative upward trend. Several factors contribute to this weak bullish sentiment, suggesting the potential for cautious upward movement in the price.
The 1st support at 38739 is considered favorable due to its identification as a swing low support, representing a historical level where buying interest has previously emerged.
Additionally, the 2nd support at 37556 is recognized as an overlap support, and it aligns with the 161.80% Fibonacci Extension, providing added strength to the support zone.
On the resistance side, the 1st resistance at 40670 is noteworthy for the presence of an overlap resistance and the 23.60% Fibonacci Retracement. This confluence adds significance to the potential resistance level, making it a crucial area to watch.
Furthermore, the 2nd resistance at 41722 is acknowledged as an overlap resistance, further reinforcing its importance.
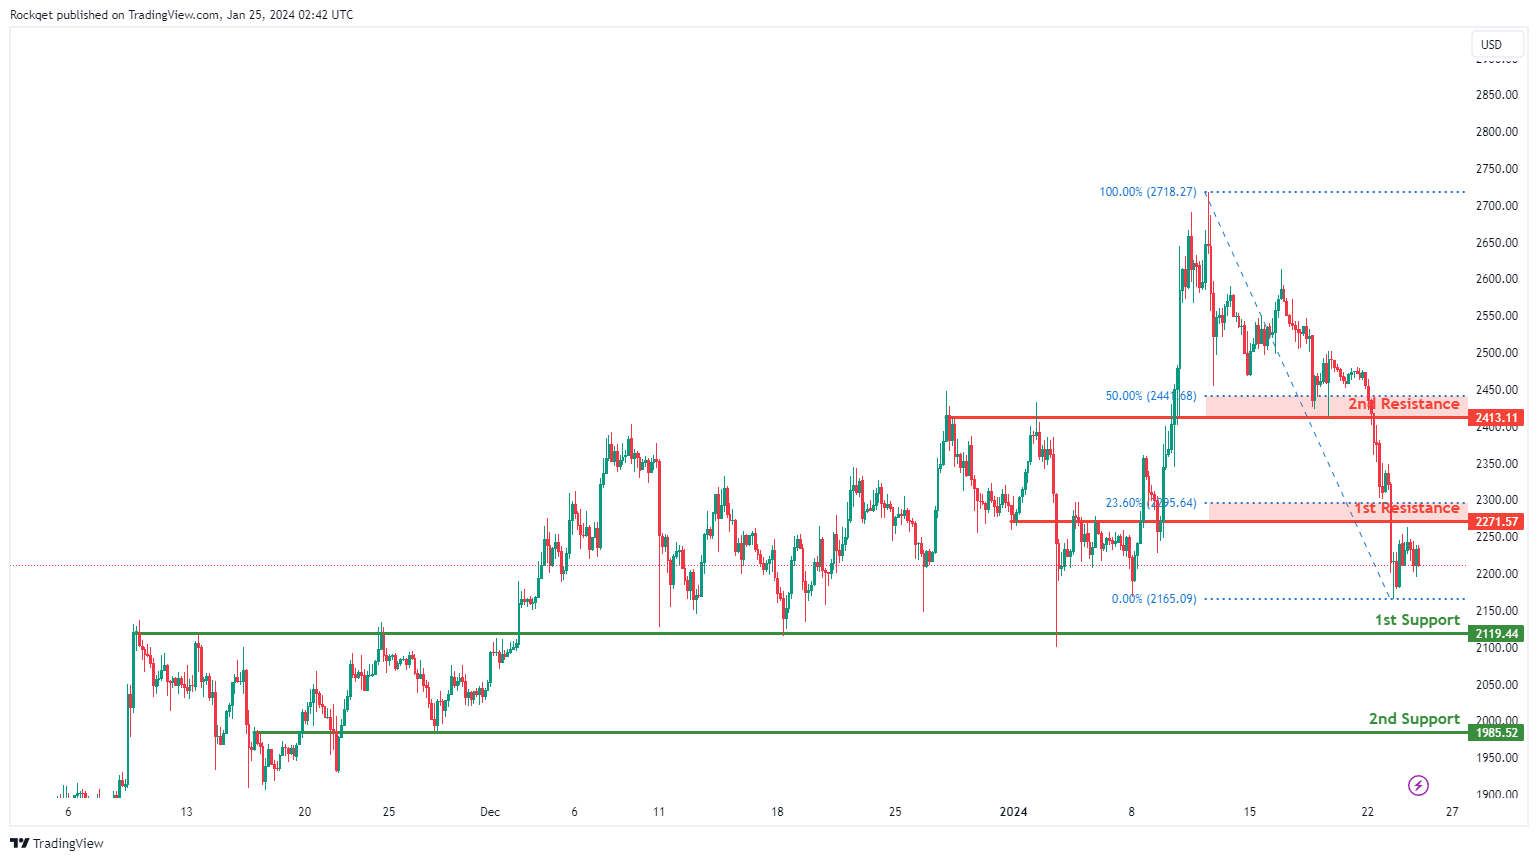
ETH/USD:
The ETH/USD chart currently demonstrates a neutral overall momentum, indicating a lack of a clear trend direction. The market sentiment suggests that the price could potentially experience fluctuations between the 1st resistance and 1st support levels.
The 1st support at 2119.44 is considered a significant level for several reasons. Firstly, it is identified as an overlap support, signifying a historical area where buying interest has previously emerged.
Additionally, the 2nd support at 1985.52 is recognized as another overlap support, adding further strength to the potential support zone.
On the resistance side, the 1st resistance at 2271.57 is noteworthy for the presence of an overlap resistance and the 23.60% Fibonacci Retracement. This confluence adds significance to the potential resistance level, making it a key area to monitor.
Furthermore, the 2nd resistance at 2413.11 is acknowledged as an overlap resistance, further reinforcing its importance.
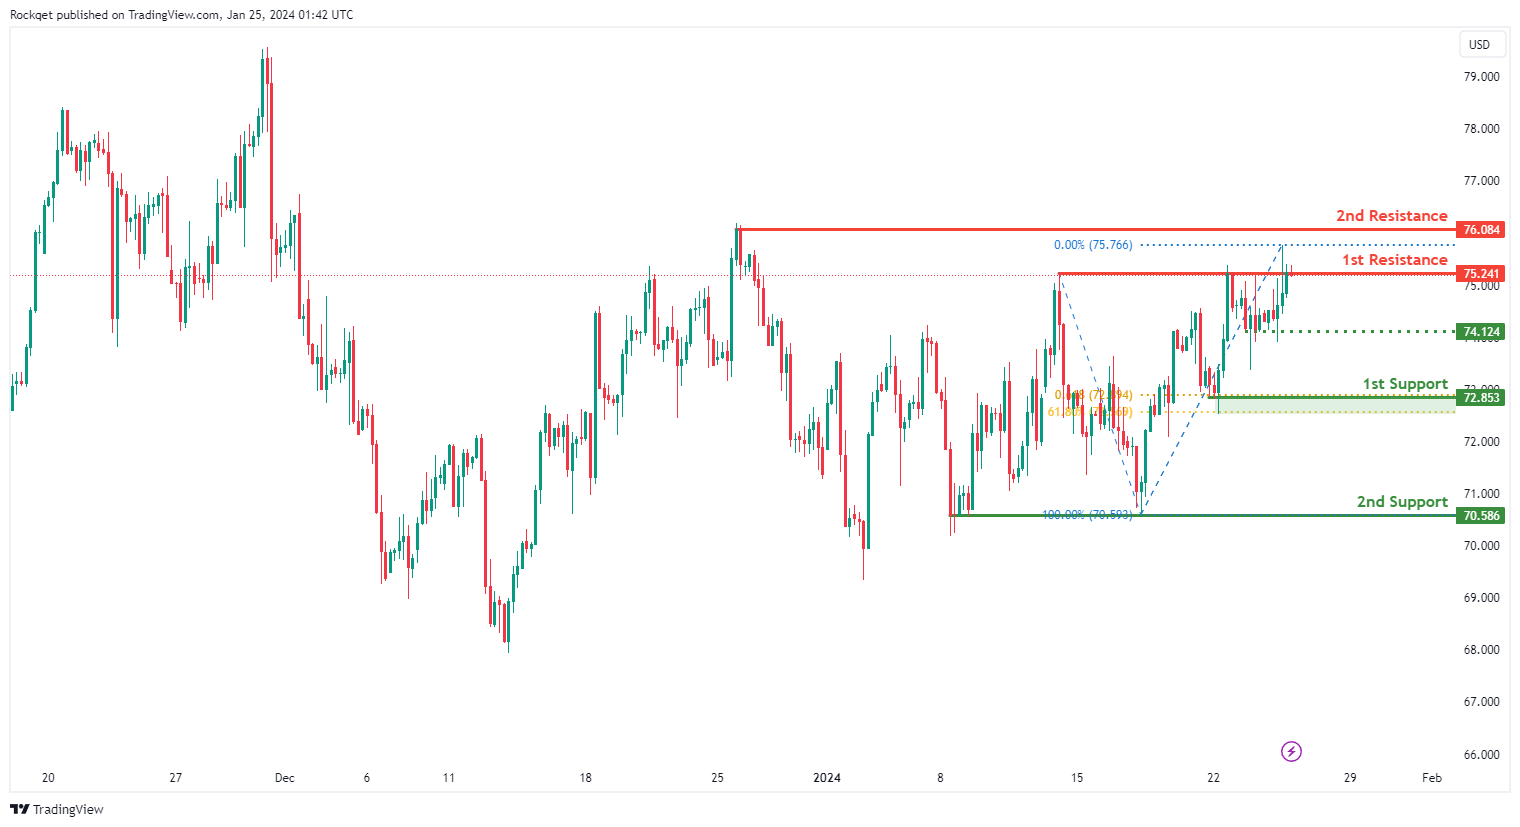
WTI/USD:
The WTI (West Texas Intermediate) chart currently exhibits a neutral bias. In this context, there is a potential scenario for price to fluctuate between the 1st resistance and the 1st support.
The 1st resistance level at 75.24 is identified as a pullback resistance. Higher up, the 2nd resistance level at 76.08 is also noted as a swing-high resistance, suggesting a potential barrier for further upside movement.
To the downside, the intermediate support level at 74.12 is identified as a pullback support while the 1st support level at 72.85 is noted as a pullback support that aligns with a confluence of Fibonacci levels i.e. the 61.8% retracement and the 61.80% projection. Further below, the 2nd support level at 70.58 is marked as a pullback support, further reinforcing its importance as a key support level.
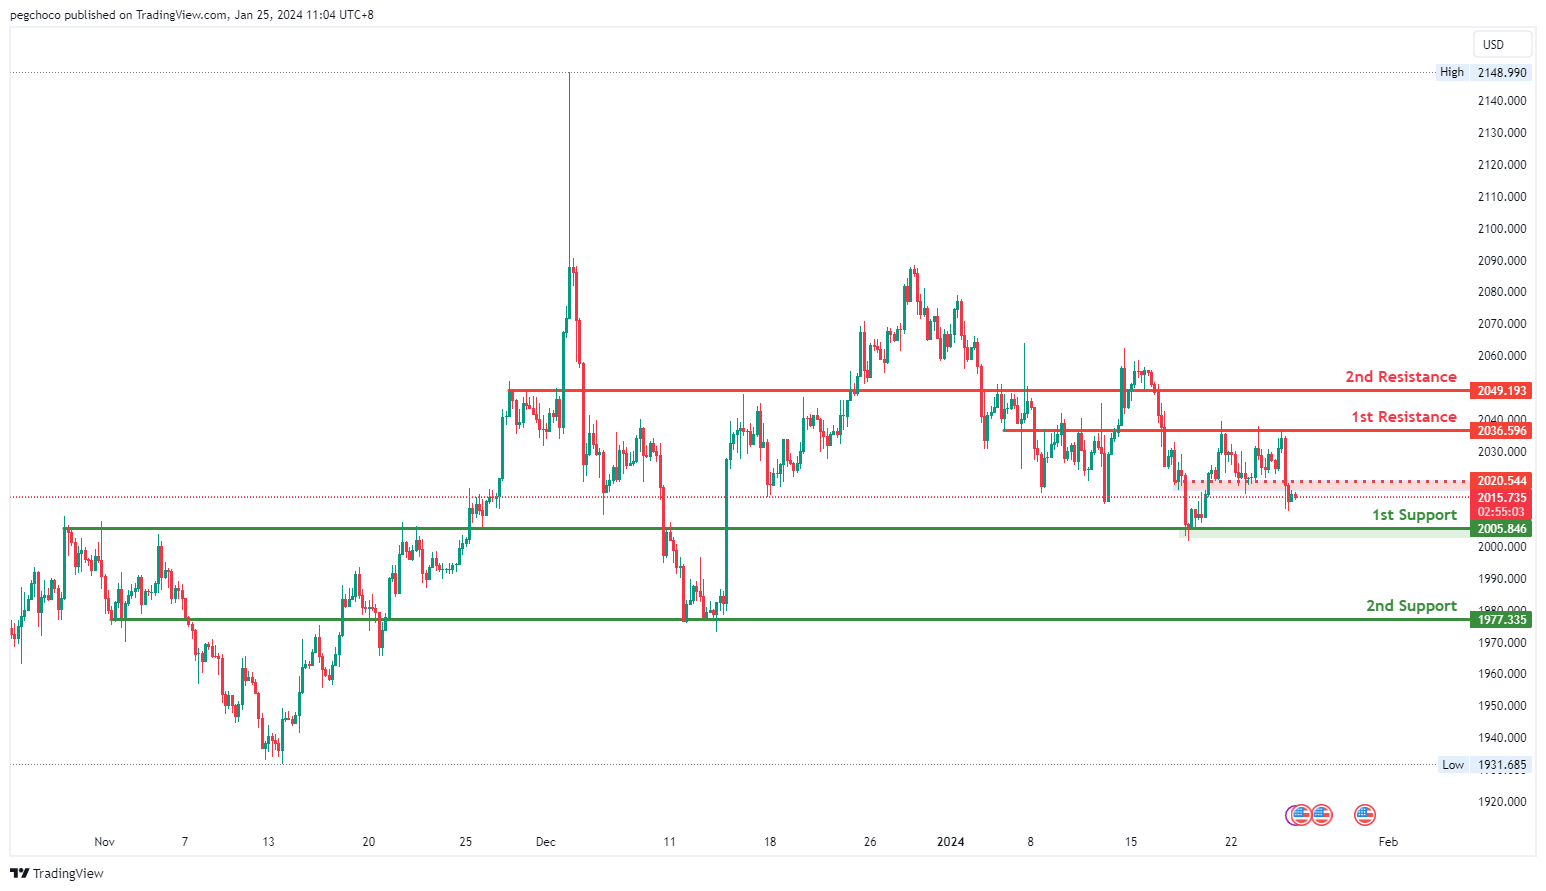
XAU/USD (GOLD):
The XAUUSD (Gold/US Dollar) chart is currently demonstrating a bearish overall momentum, indicating weakness in the price of gold. Your analysis suggests that there is potential for a bearish continuation in the price towards the 1st support level.
The 1st support level at 2005.84 is considered significant as it represents an overlap support and coincides with the 161.80% Fibonacci Extension level. This confluence of factors adds further significance to this support zone, suggesting it may serve as a strong area where price could potentially find support during a bearish move.
The 2nd support level at 1977.33 is identified as an overlap support, reinforcing its importance as a level where price has previously found both support and resistance.
On the resistance side, the 1st resistance level at 2036.59 is recognized as an overlap resistance, indicating that this price level has historically served as both support and resistance. This makes it a potential barrier where selling pressure could emerge.
The 2nd resistance level at 2049.19 is characterized as a pullback resistance, suggesting that it might act as a notable resistance point during price pullbacks.


