
DXY:
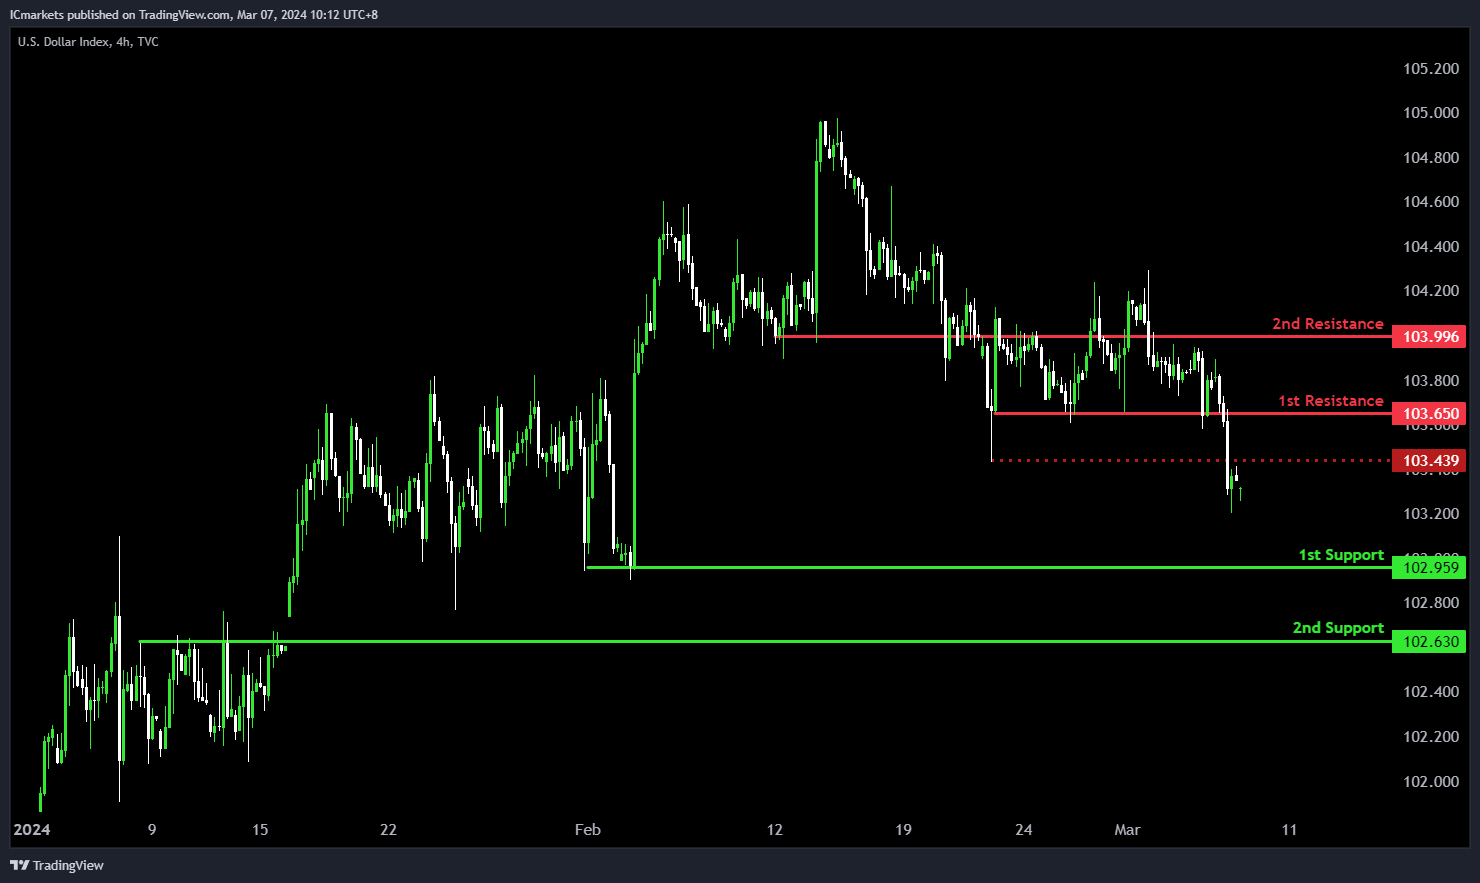
The DXY chart exhibits a bearish momentum, suggesting a potential continuation towards the 1st support level.
The 1st support at 102.95 is significant as a multi-swing low support, indicating its historical importance as a level where buying interest has emerged, potentially providing support to the price.
Furthermore, the 2nd support at 102.63 is characterized as a pullback support, reinforcing its significance as a level where buyers may intervene to prevent further decline.
On the resistance side, the 1st resistance level at 103.65 is identified as a pullback resistance, suggesting its historical importance as a barrier where selling pressure may increase, potentially limiting upward movement in the short term.
Additionally, the 2nd resistance at 103.99 is noted as an overlap resistance, further reinforcing its significance as a level where selling interest may intensify.
EUR/USD:
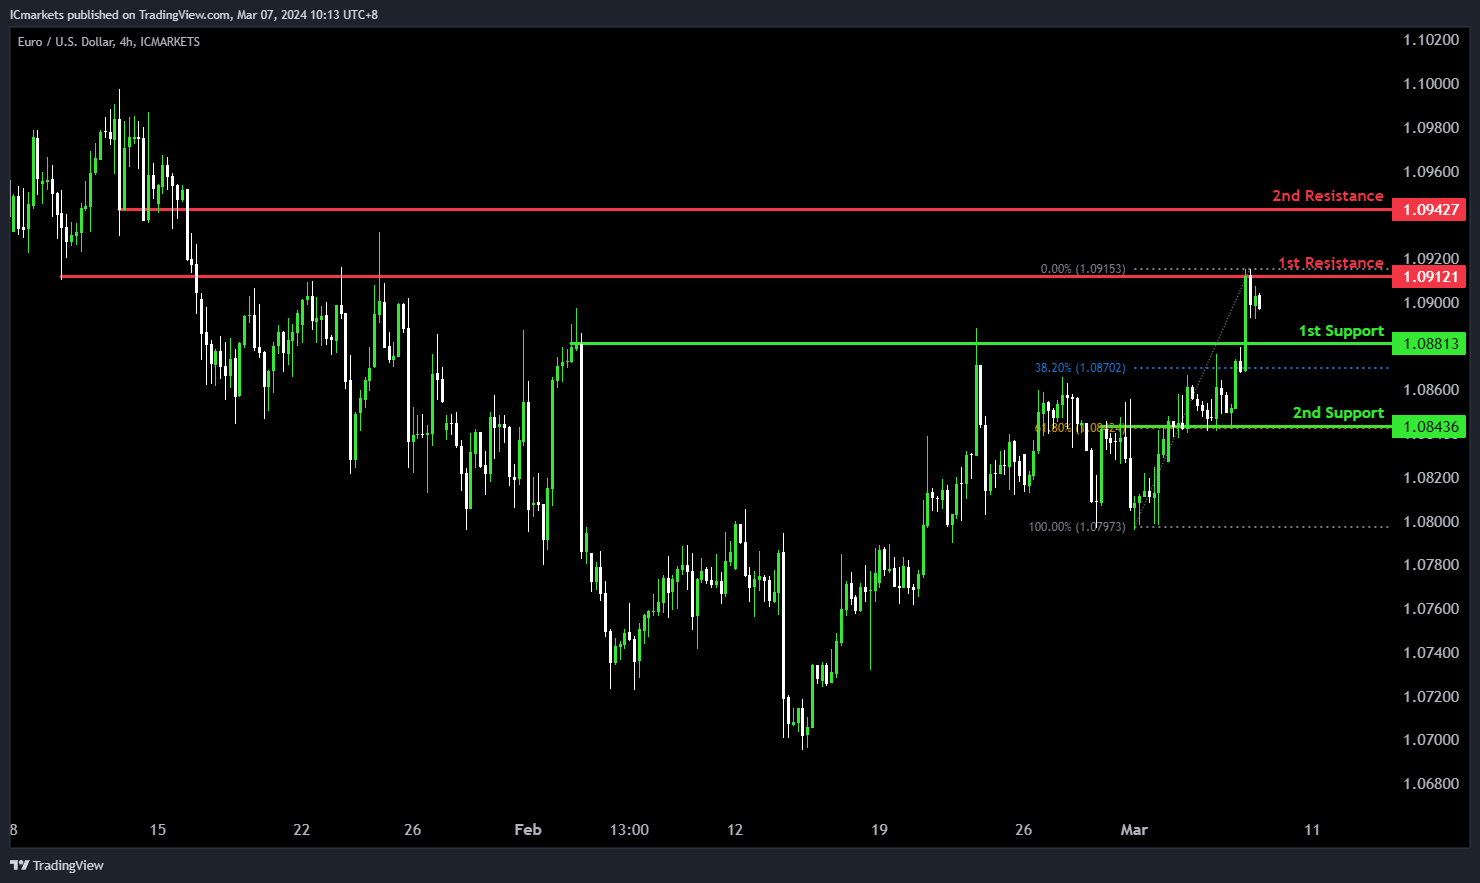
The EUR/USD chart currently demonstrates bullish momentum, suggesting a potential scenario where the price may drop further to the 1st support in the short term before bouncing from there and rising to the 1st resistance.
The 1st support level at 1.0881 is significant as a pullback support, coinciding with the 38.20% Fibonacci Retracement level, indicating its historical significance as a level where buying interest has emerged, potentially providing support to the price.
Additionally, the 2nd support at 1.0843 is identified as an overlap support, further reinforcing its importance as a level where buyers may intervene to prevent further decline, aligning with the 61.80% Fibonacci Retracement level.
On the resistance side, the 1st resistance level at 1.0912 is identified as an overlap resistance, suggesting its historical importance as a barrier where selling pressure may increase, potentially limiting upward movement in the short term.
Furthermore, the 2nd resistance at 1.0942 is noted as a pullback resistance, indicating its significance as a level where selling interest may intensify, potentially capping the upward movement of prices.
EUR/JPY:
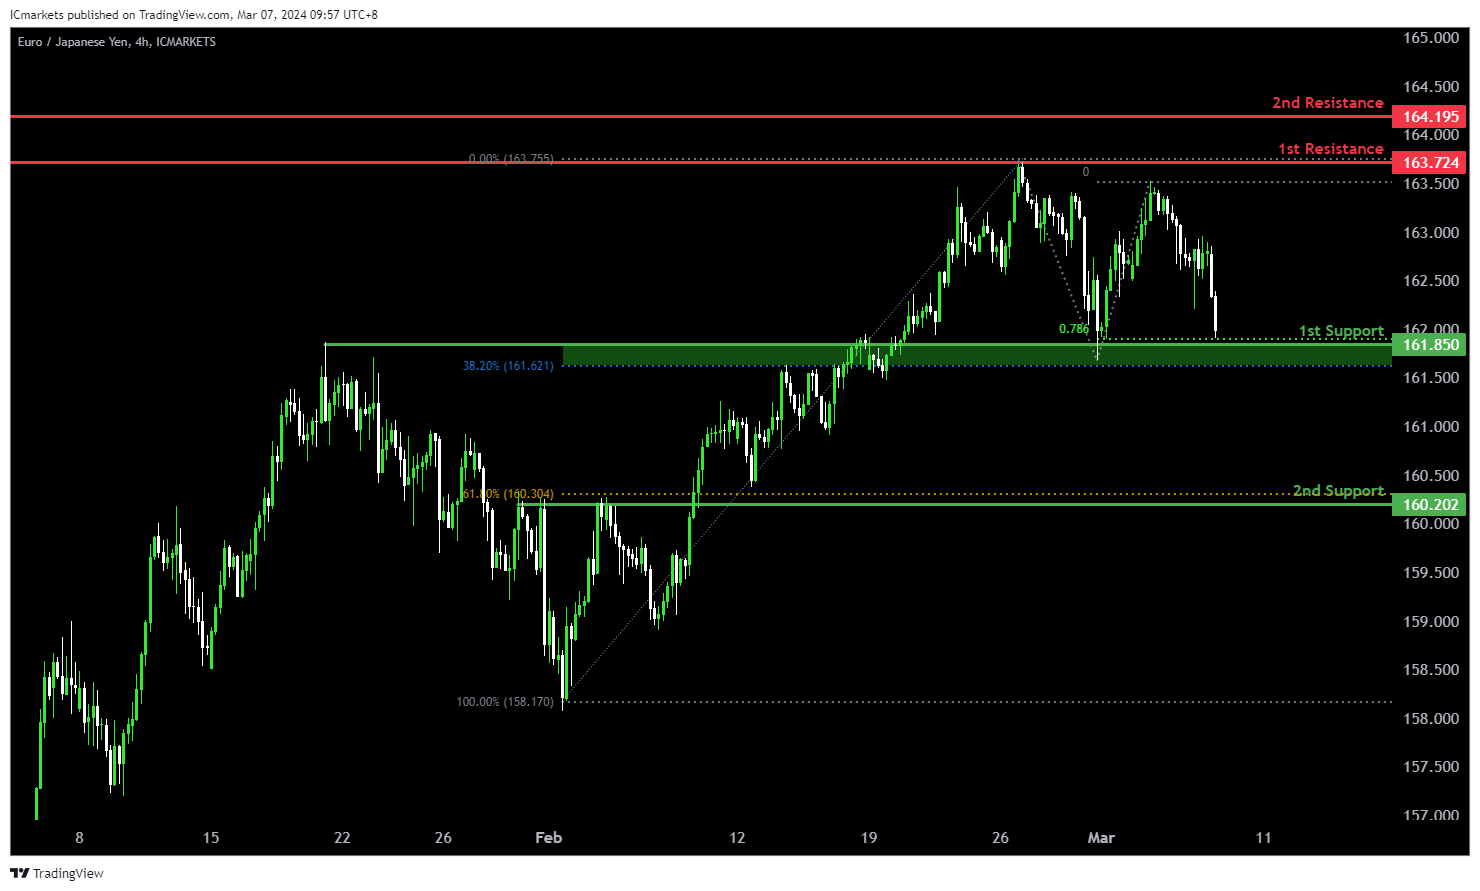
The EUR/JPY chart currently indicates a bearish momentum, suggesting a potential continuation of the downward trend. Several factors support the possibility of a bearish movement towards the 1st support level.
The 1st support at 161.850 aligns with an overlap support, the 78.60% Fibonacci Projection, and the 38.20% Fibonacci Retracement level, indicating a significant historical level where buying interest may emerge. Additionally, the 2nd support at 160.202 corresponds to a pullback support and the 61.80% Fibonacci Retracement, further reinforcing its importance as a potential area of support.
On the resistance side, the 1st resistance level at 163.724 is characterized by a multi-swing high resistance, suggesting a historical barrier to upward movement. Furthermore, the 2nd resistance level at 164.205 aligns with a swing high resistance, adding to its significance as a potential barrier to further bullish movement.
EUR/GBP:
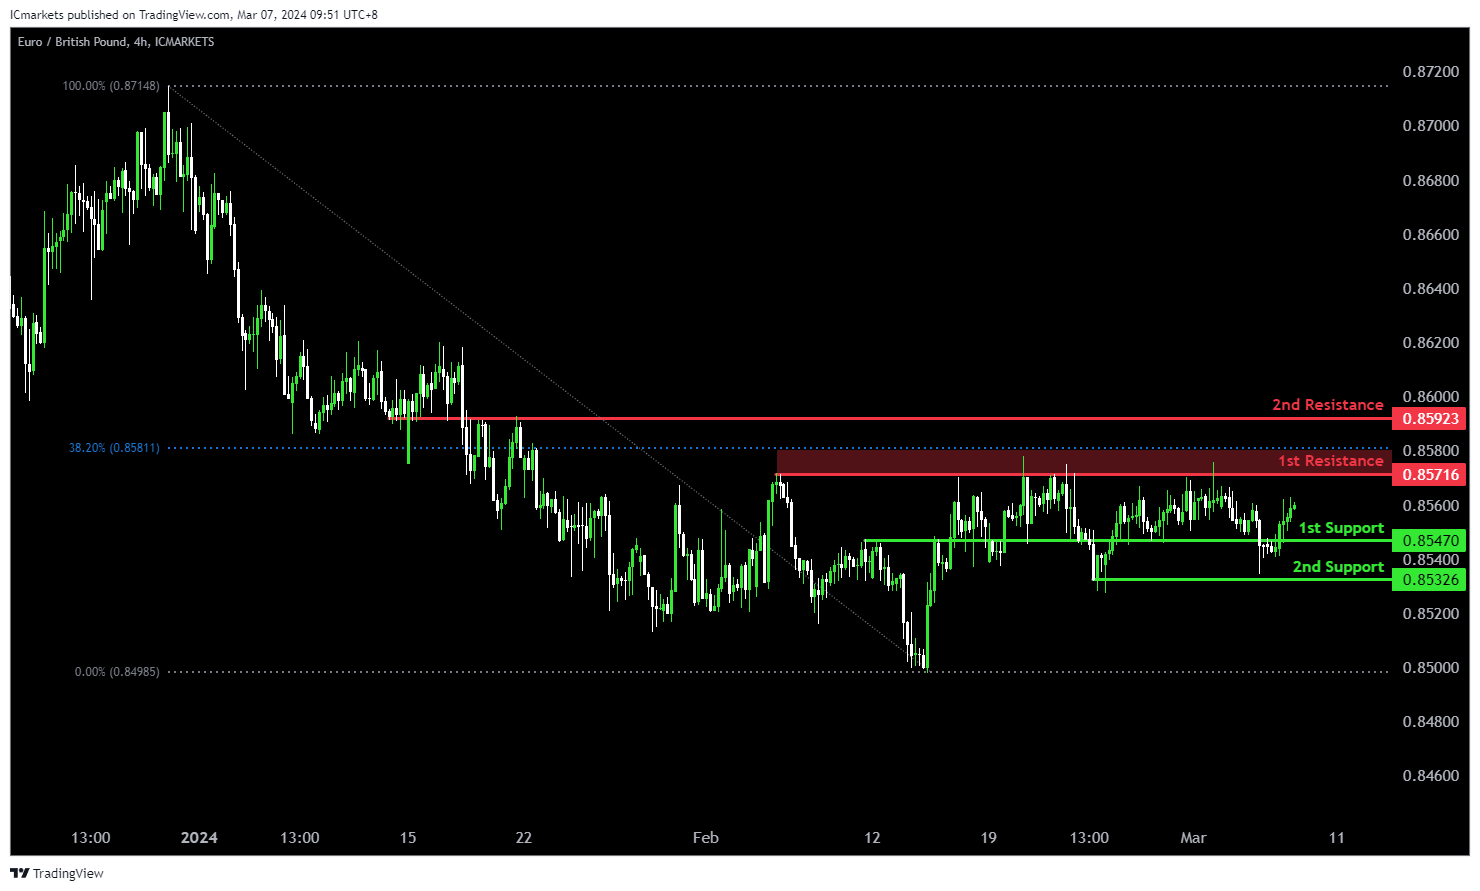
The EUR/GBP chart demonstrates a bullish momentum, indicating a potential continuation of the upward trend. Several factors support the possibility of a bullish movement towards the 1st resistance level.
The 1st support at 0.85470 is identified as a pullback support, suggesting a historical level where buying interest may emerge. Additionally, the 2nd support at 0.85326 corresponds to a swing low support, further reinforcing its importance as a potential area of support.
On the resistance side, the 1st resistance level at 0.85716 aligns with a swing high resistance and the 38.20% Fibonacci Retracement level, indicating a historical barrier to upward movement. Furthermore, the 2nd resistance level at 0.85923 is characterized by an overlap resistance, adding to its significance as a potential barrier to further bullish movement.
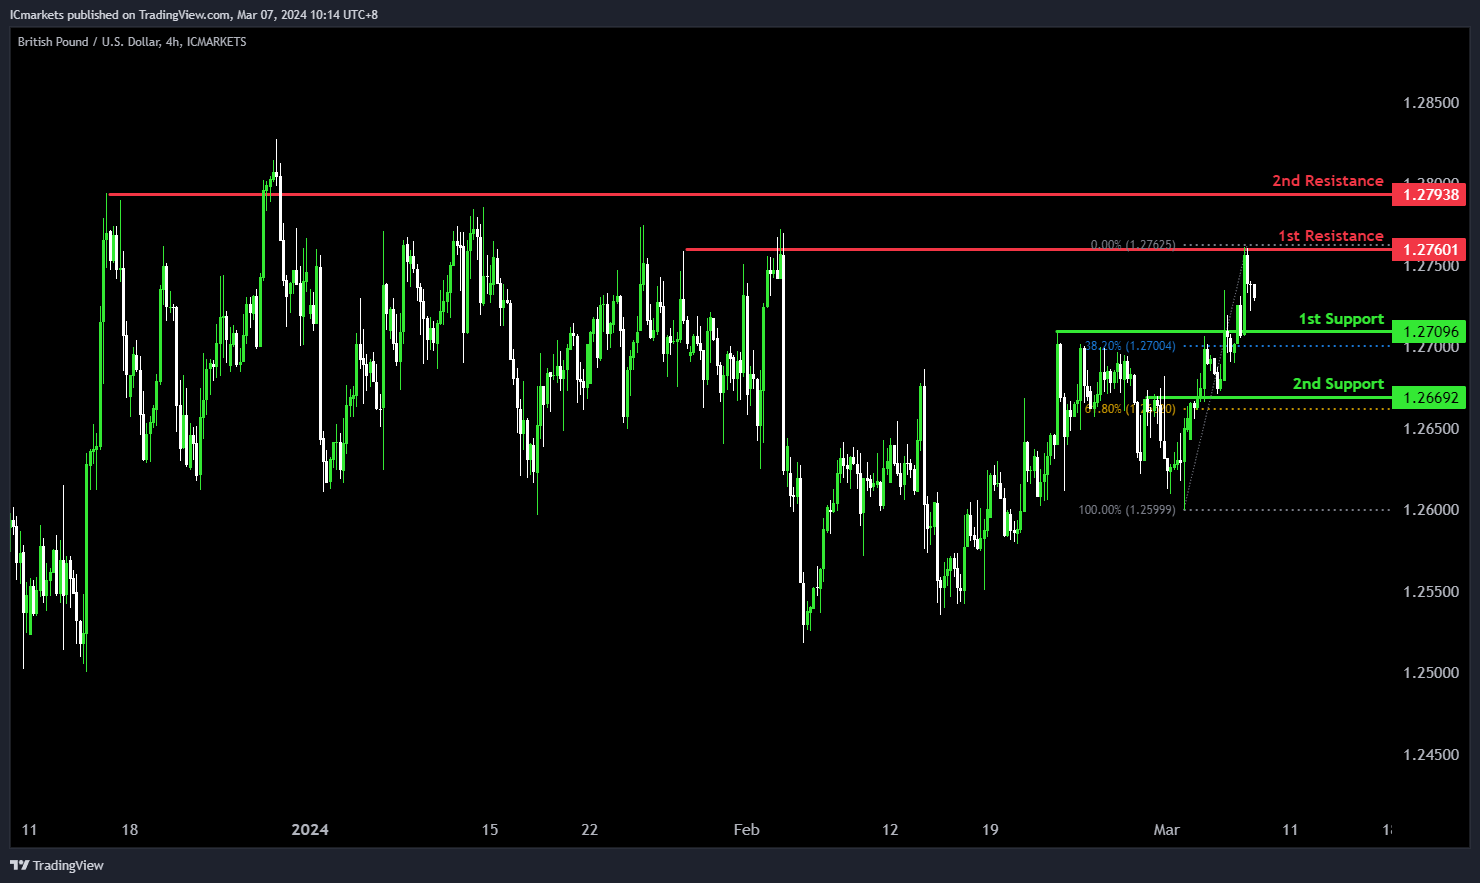
GBP/USD:
The GBP/USD chart currently exhibits bullish momentum, indicating a potential scenario where the price may drop further to the 1st support in the short term before bouncing from there and rising to the 1st resistance.
The 1st support level at 1.2709 is identified as a pullback support, suggesting its historical significance as a level where buying interest has emerged to support the price.
Additionally, the 2nd support at 1.2669 is characterized as an overlap support, reinforcing its importance as a level where buyers may intervene to prevent further decline.
On the resistance side, the 1st resistance level at 1.2760 is identified as a multi-swing high resistance, indicating its historical importance as a barrier where selling pressure may increase, potentially limiting upward movement in the short term.
Furthermore, the 2nd resistance at 1.2793 is noted as a pullback resistance, suggesting its significance as a level where selling interest may intensify, potentially capping the upward movement of prices.
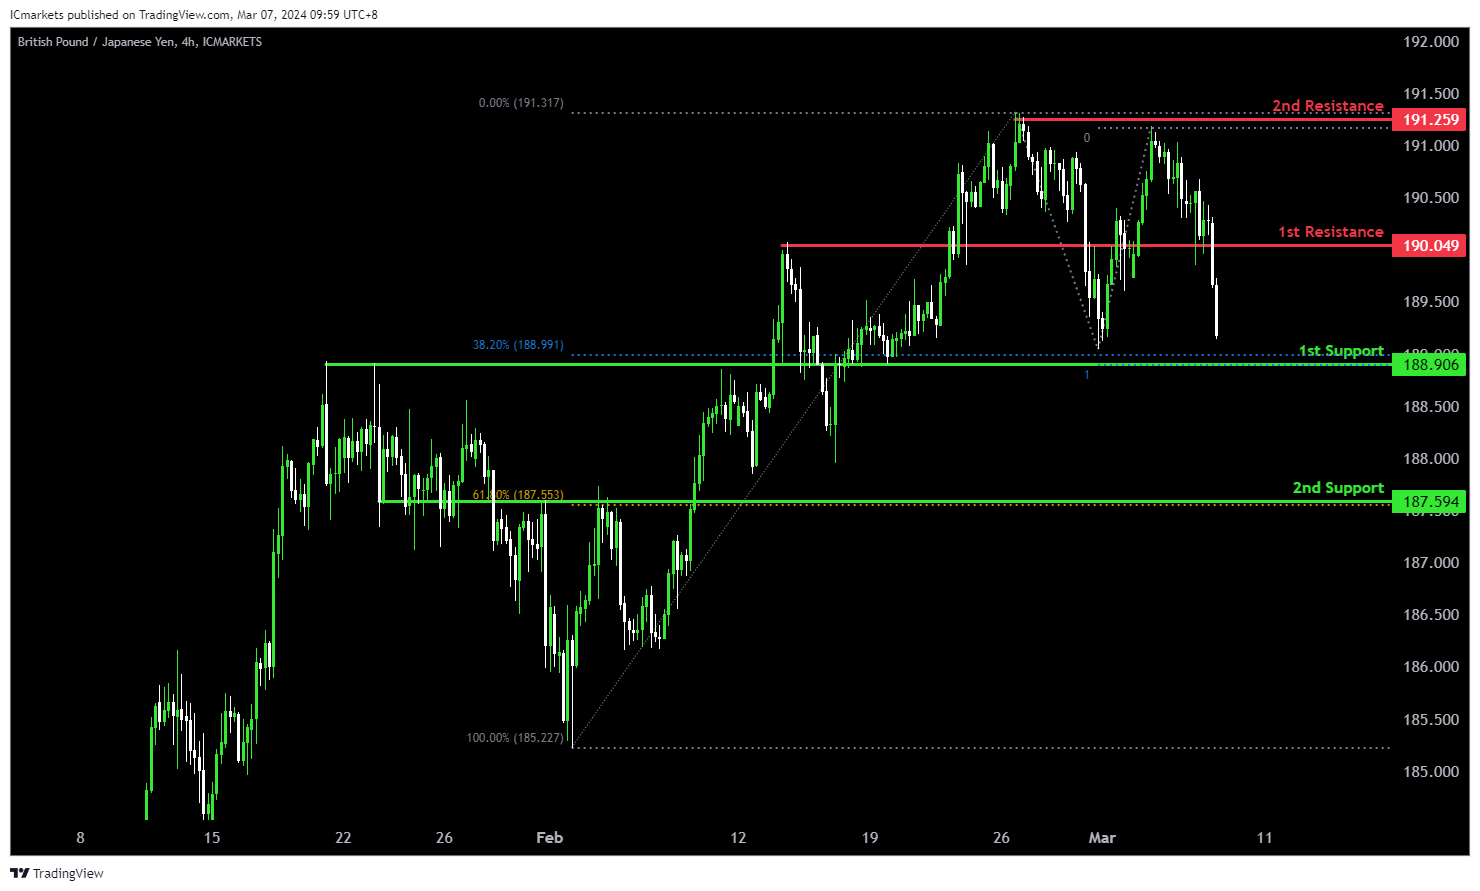
GBP/JPY:
The GBP/JPY chart currently exhibits a bearish momentum, suggesting a potential continuation of the downward trend. Several factors support the possibility of a bearish movement towards the 1st support level.
The 1st support at 188.906 aligns with a pullback support and the 38.20% Fibonacci Retracement level, indicating a significant historical level where buying interest could emerge. Additionally, the confluence with the 100% Fibonacci Projection strengthens this support zone.
Moreover, the 2nd support at 187.594 corresponds to an overlap support and the 61.80% Fibonacci Retracement level, further reinforcing its importance as a potential area of support.
On the resistance side, the 1st resistance level at 190.049 is identified as a pullback resistance, suggesting a historical barrier to upward movement. Additionally, the 2nd resistance level at 191.259 aligns with a swing high resistance, adding to its significance as a potential barrier to further bullish movement.
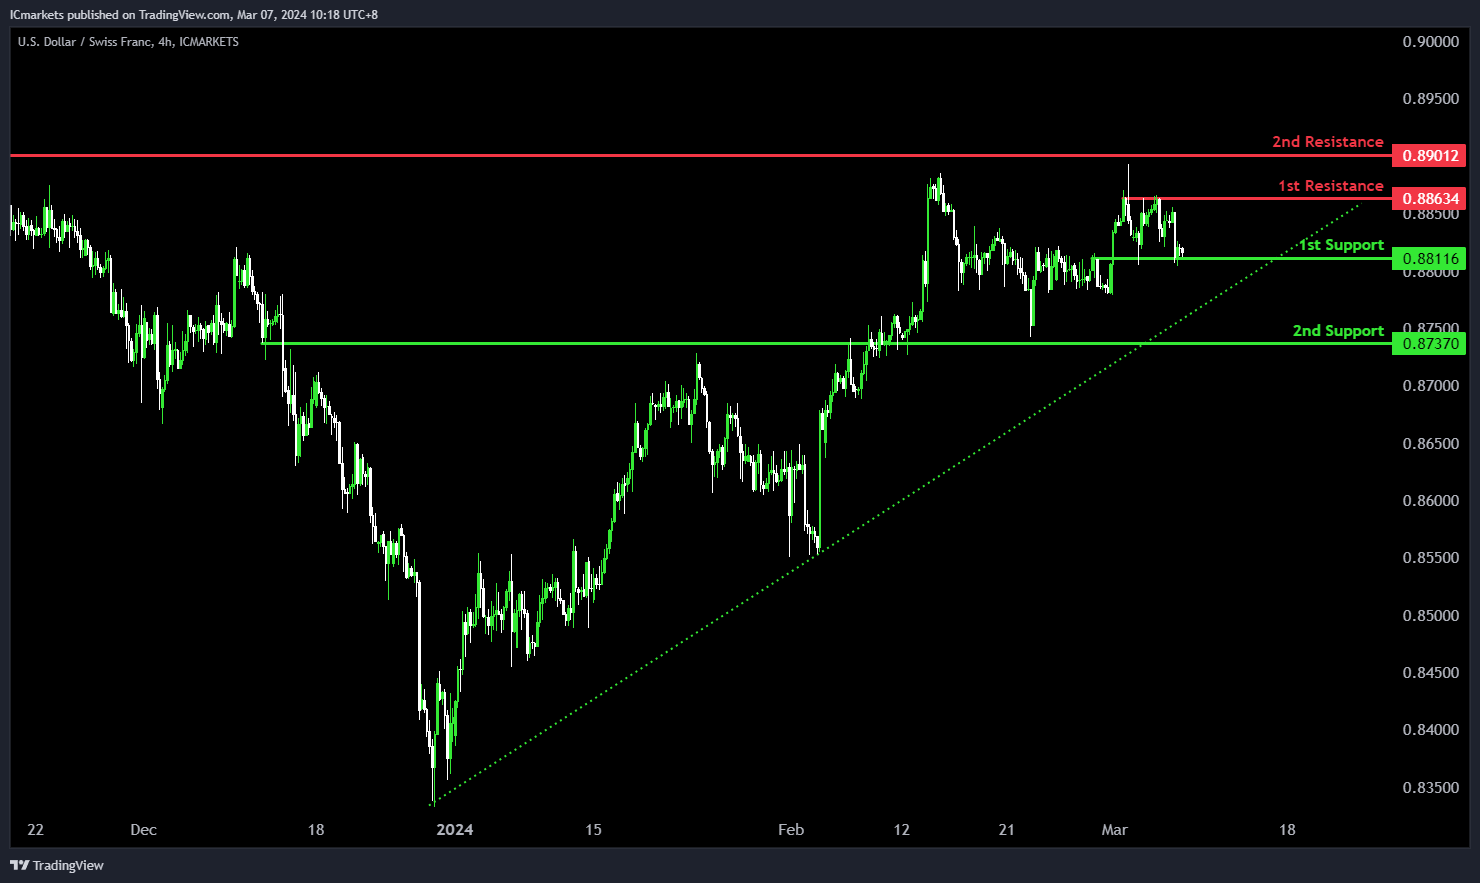
USD/CHF:
The USD/CHF chart maintains a bullish momentum, attributed to its presence within a bullish ascending channel.
There’s a potential scenario where the price could decline further to the 1st support in the short term before rebounding and ascending towards the 1st resistance.
The 1st support level at 0.8811 is identified as an overlap support, signifying its historical significance as a level where buying interest has emerged to support the price.
Furthermore, the 2nd support at 0.8737 is characterized as another overlap support, reinforcing its importance as a level where buyers may intervene to prevent further decline.
On the resistance side, the 1st resistance level at 0.8863 is identified as a multi-swing high resistance, suggesting its historical importance as a barrier where selling pressure may increase, potentially limiting upward movement in the short term.
Additionally, the 2nd resistance at 0.8901 is noted as an overlap resistance, indicating its significance as a level where selling interest may intensify.
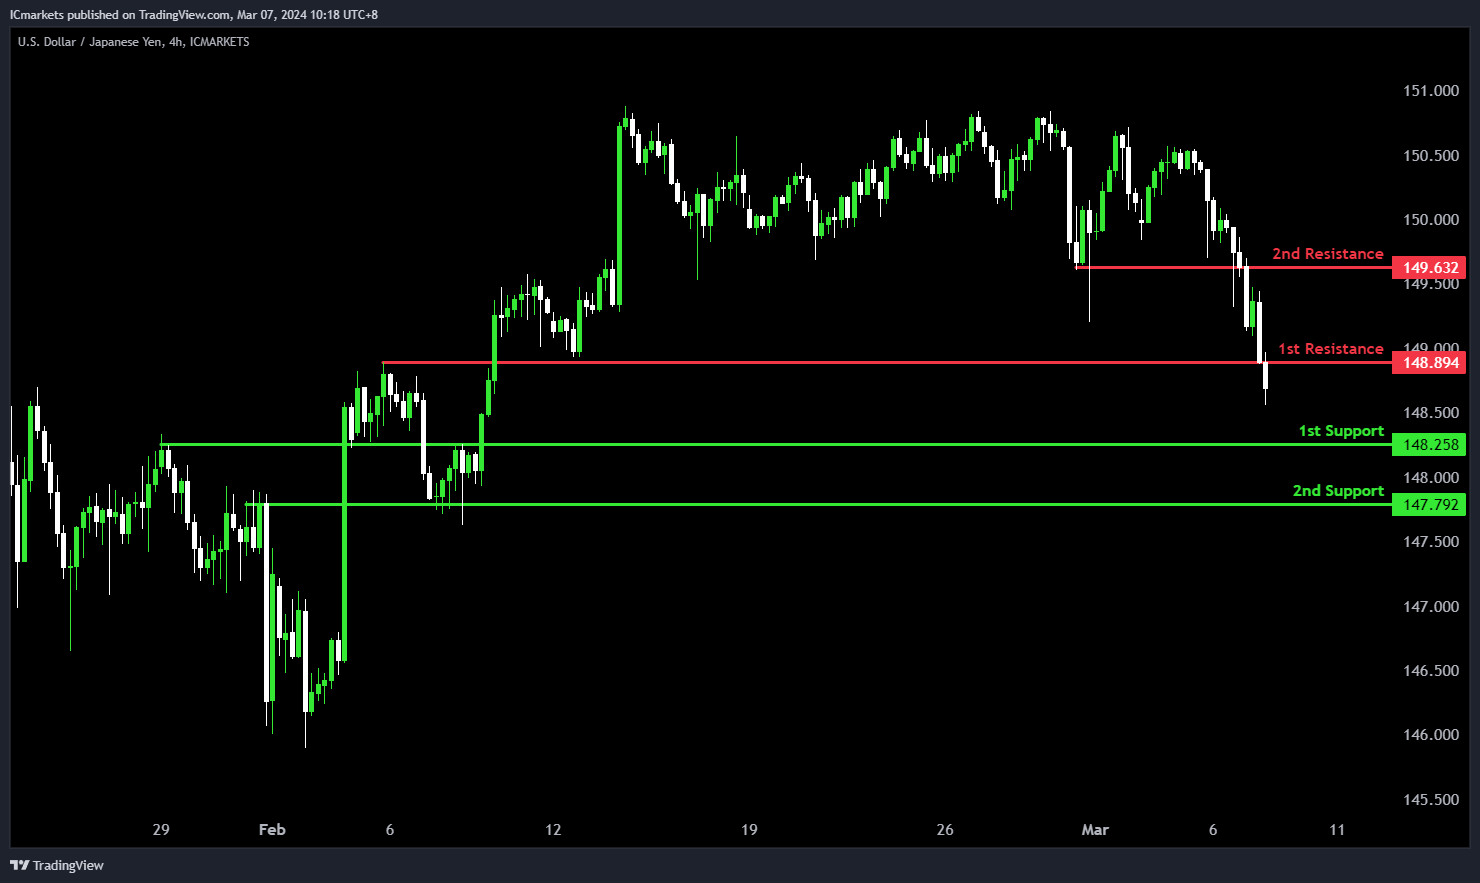
USD/JPY:
The USD/JPY chart currently exhibits a bearish momentum, suggesting a potential scenario of a bearish continuation towards the 1st support.
The 1st support level at 148.25 is identified as a pullback support, indicating its historical significance as a level where buying interest has emerged to support the price.
Additionally, the 2nd support at 147.79 is characterized as an overlap support, reinforcing its importance as a level where buyers may intervene to prevent further decline.
On the resistance side, the 1st resistance level at 148.89 is identified as a pullback resistance, suggesting its historical importance as a barrier where selling pressure may increase, potentially limiting upward movement in the short term.
Furthermore, the 2nd resistance at 149.63 is noted as another pullback resistance, indicating its significance as a level where selling interest may intensify.
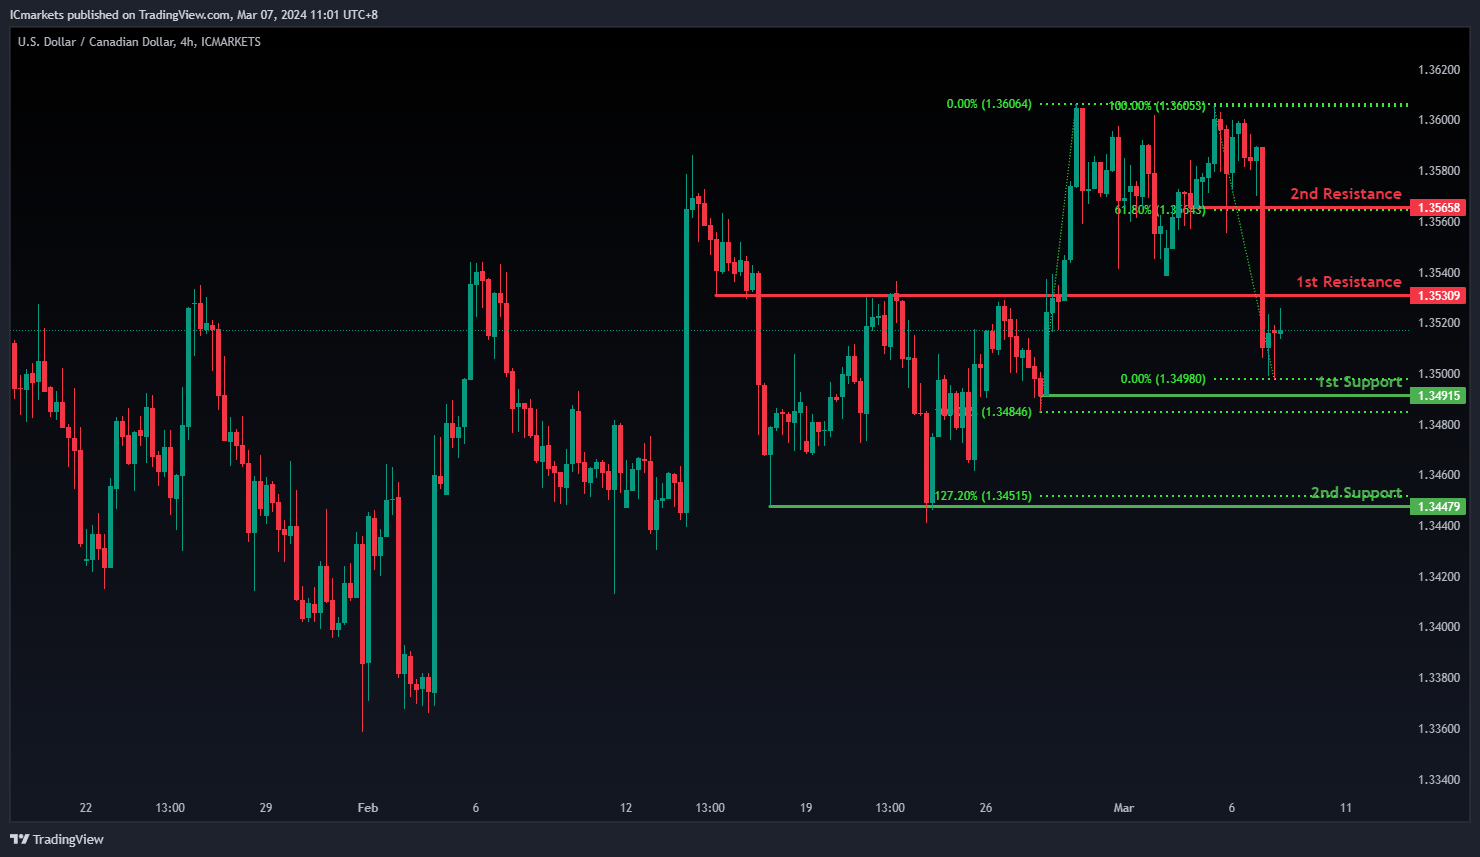
USD/CAD:
The USD/CAD chart currently exhibits an overall bearish momentum. In this context, there is a potential scenario for price to fall towards the 1st support.
The 1st support level at 1.3491 is identified as a pullback support. Further below, the 2nd support level at 1.3447 is also marked as a pullback support that aligns close to the 127.20% Fibonacci Extension level, reinforcing its significance as a key support level.
To the upside, the 1st resistance level at 1.3530 is identified as an overlap resistance. Higher up, the 2nd resistance level at 1.3565 is marked as a pullback resistance that aligns with the 61.80% Fibonacci retracement level, further highlighting its importance as a potential resistance zone.
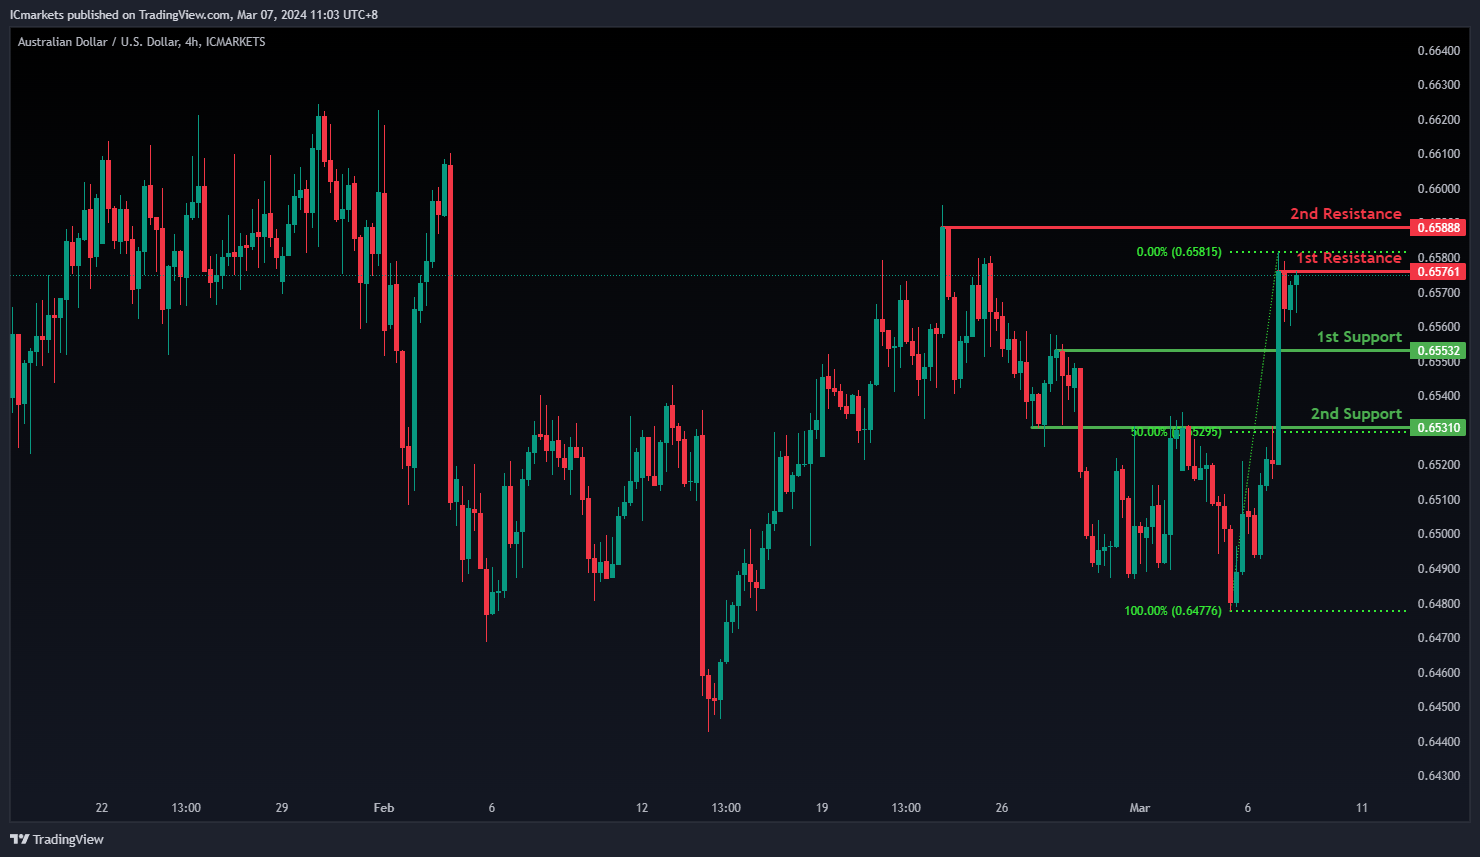
AUD/USD:
The AUD/USD chart currently exhibits an overall bullish momentum. In this context, there is a potential scenario for price to break above the 1st resistance and rise towards the 2nd resistance.
The 1st resistance level at 0.6576 is identified as a pullback resistance. Higher up, the 2nd resistance level at 0.6588 is also noted as a swing-high resistance, further highlighting its importance as a potential resistance zone.
To the downside, the 1st support level at 0.6553 is identified as a pullback support. Further below, the 2nd support level at 0.6531 is marked as an overlap support that aligns with the 50.00% Fibonacci Retracement level, further emphasizing its importance as a potential support zone.
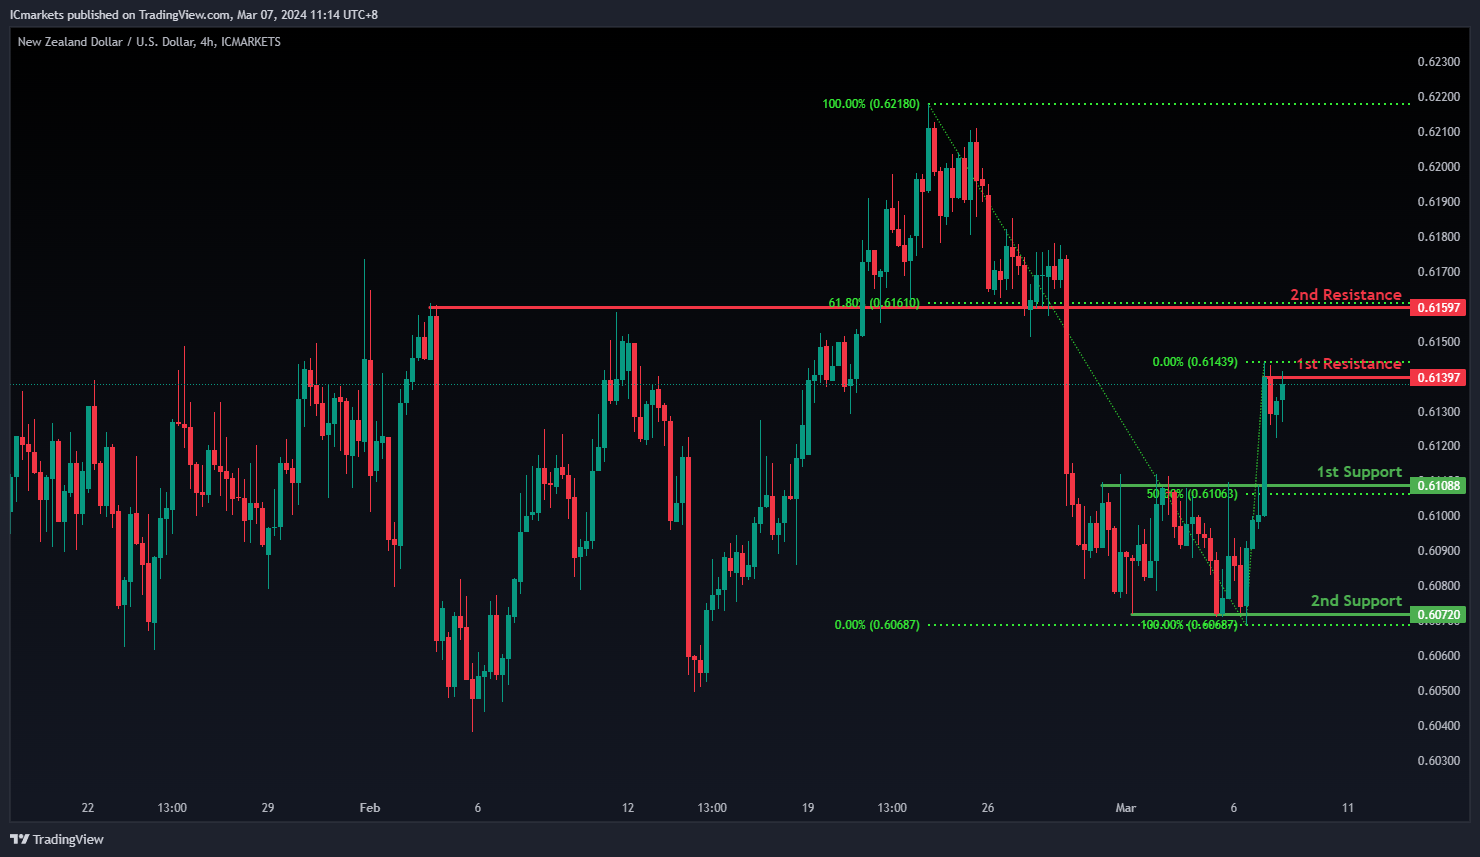
NZD/USD
The NZD/USD chart currently exhibits an overall bullish momentum. In this context, there is a potential scenario for price to break above the 1st resistance and rise towards the 2nd resistance.
The 1st resistance level at 0.6139 is identified as a pullback resistance. Higher up, the 2nd resistance level at 0.6159 is noted as an overlap resistance that aligns with the 61.80% Fibonacci Retracement level, further highlighting its importance as a potential resistance zone.
To the downside, the 1st support level at 0.6108 is identified as a pullback support that aligns with the 50.00% Fibonacci Retracement level. Further below, the 2nd support level at 0.6072 is also marked as a pullback support, further emphasizing its importance as a potential support zone.
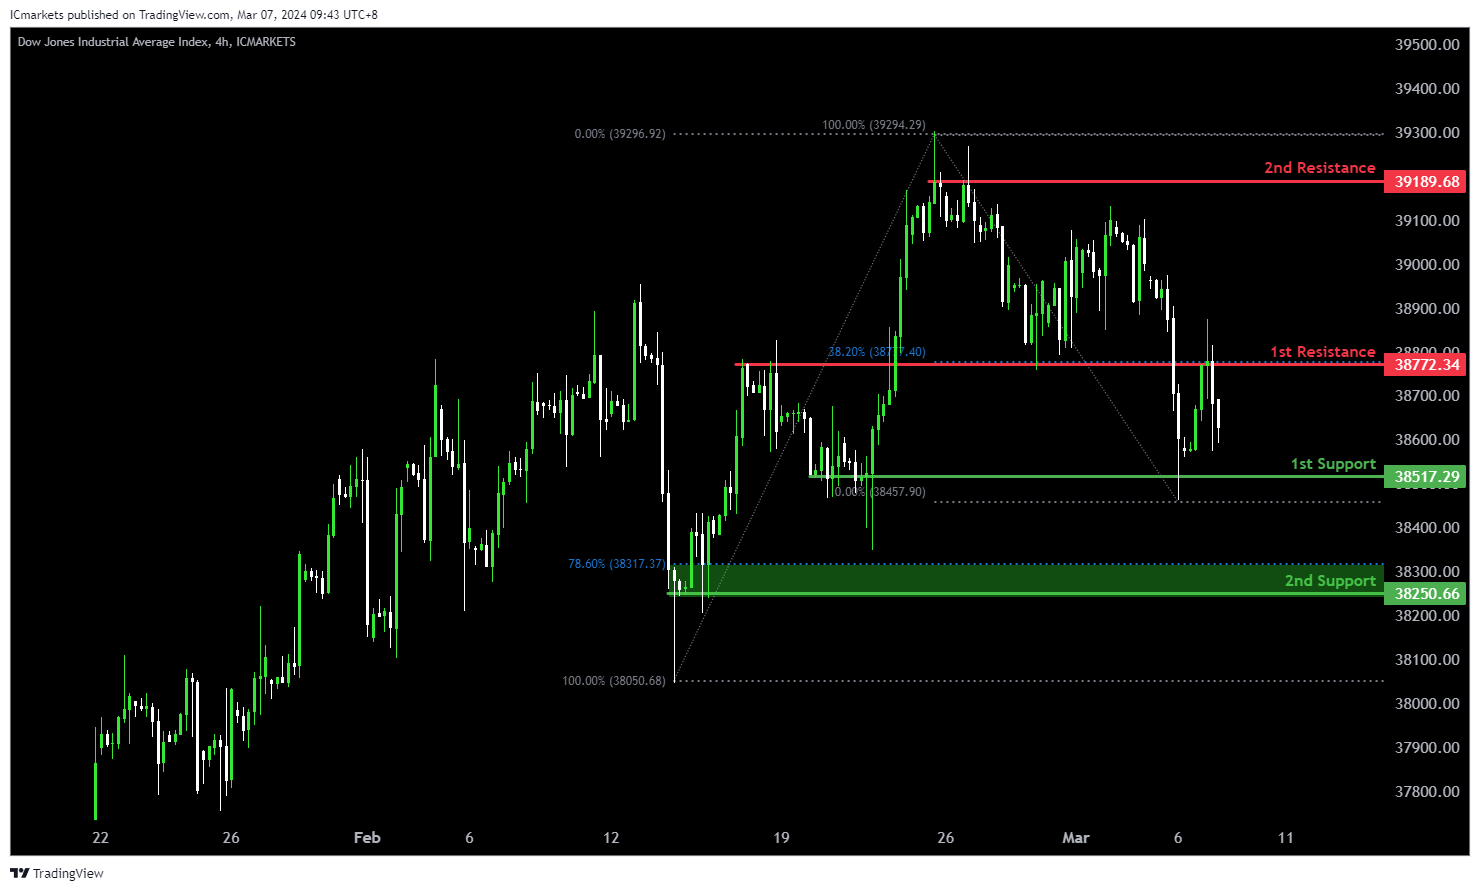
DJ30:
The DJ30 chart currently demonstrates a bearish momentum, indicating a potential continuation of the downward trend. Several factors support the possibility of a bearish movement towards the 1st support level.
The 1st support at 38517.29 corresponds to a swing low support, suggesting a significant historical level where buying interest might emerge. Additionally, the 2nd support at 38250.66 aligns with another swing low support and the 78.60% Fibonacci Retracement level, further reinforcing its significance as a potential area of support.
On the resistance side, the 1st resistance level at 38772.34 is characterized as an overlap resistance, indicating a historical barrier to upward movement. Furthermore, the confluence with the 38.20% Fibonacci Retracement adds to its significance as a potential barrier to further bullish movement.
GER40:
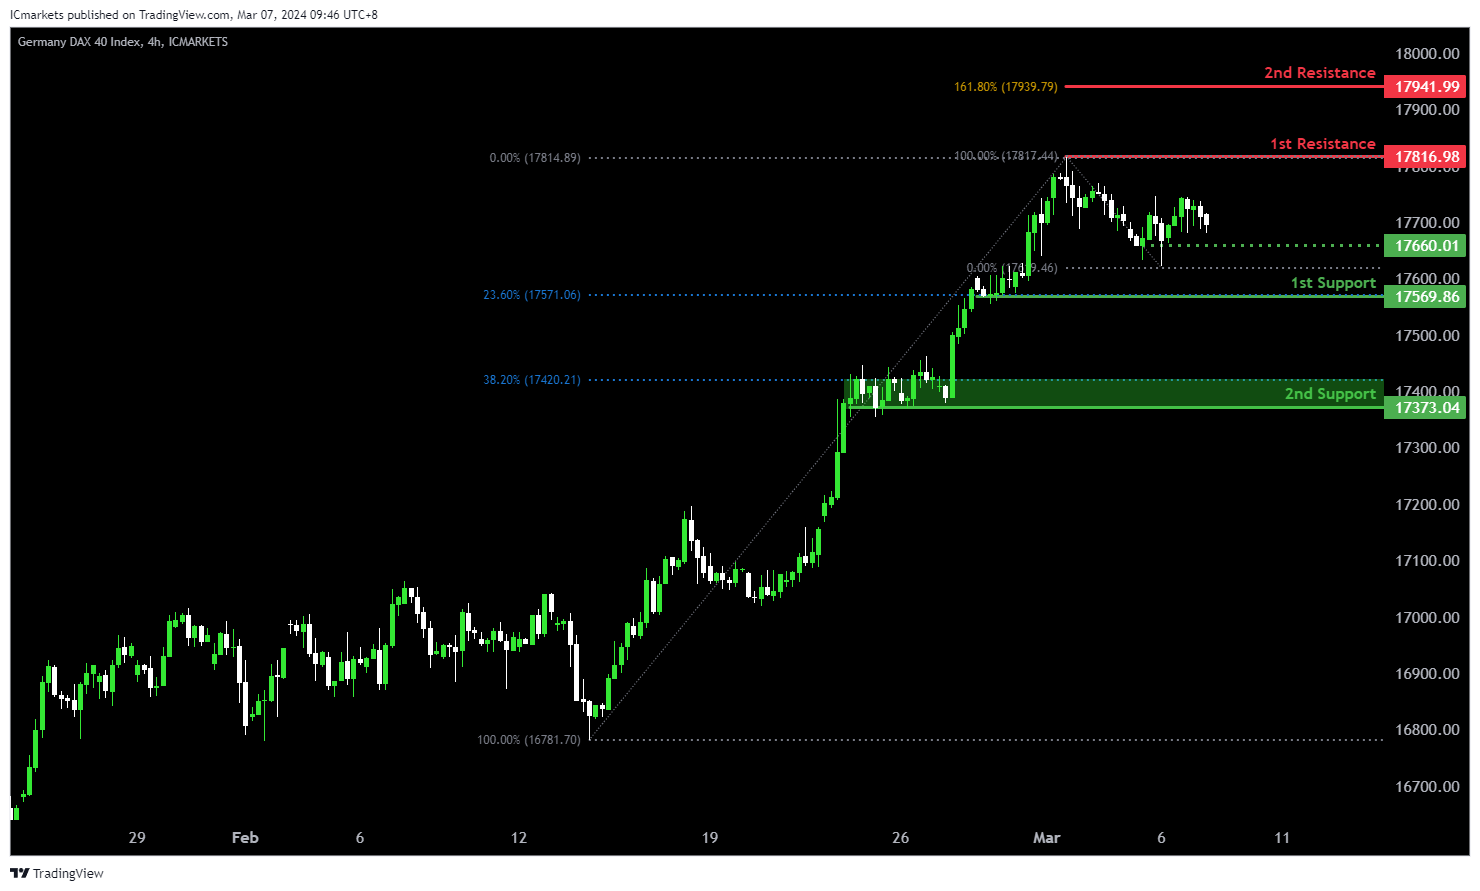
The GER40 chart currently demonstrates a bearish momentum, suggesting a potential continuation of the downward trend. Several factors support the possibility of a bearish movement towards the 1st support level.
The 1st support at 17569.86 corresponds to a swing low support, indicating a significant historical level where buying interest might emerge. Additionally, the 2nd support at 17373.04 aligns with another swing low support and the 38.20% Fibonacci Retracement level, further reinforcing its significance as a potential area of support.
On the resistance side, the 1st resistance level at 17816.98 is characterized as a swing high resistance, suggesting a historical barrier to upward movement. Furthermore, the confluence with the 161.80% Fibonacci Extension adds to its significance as a potential barrier to further bullish movement.
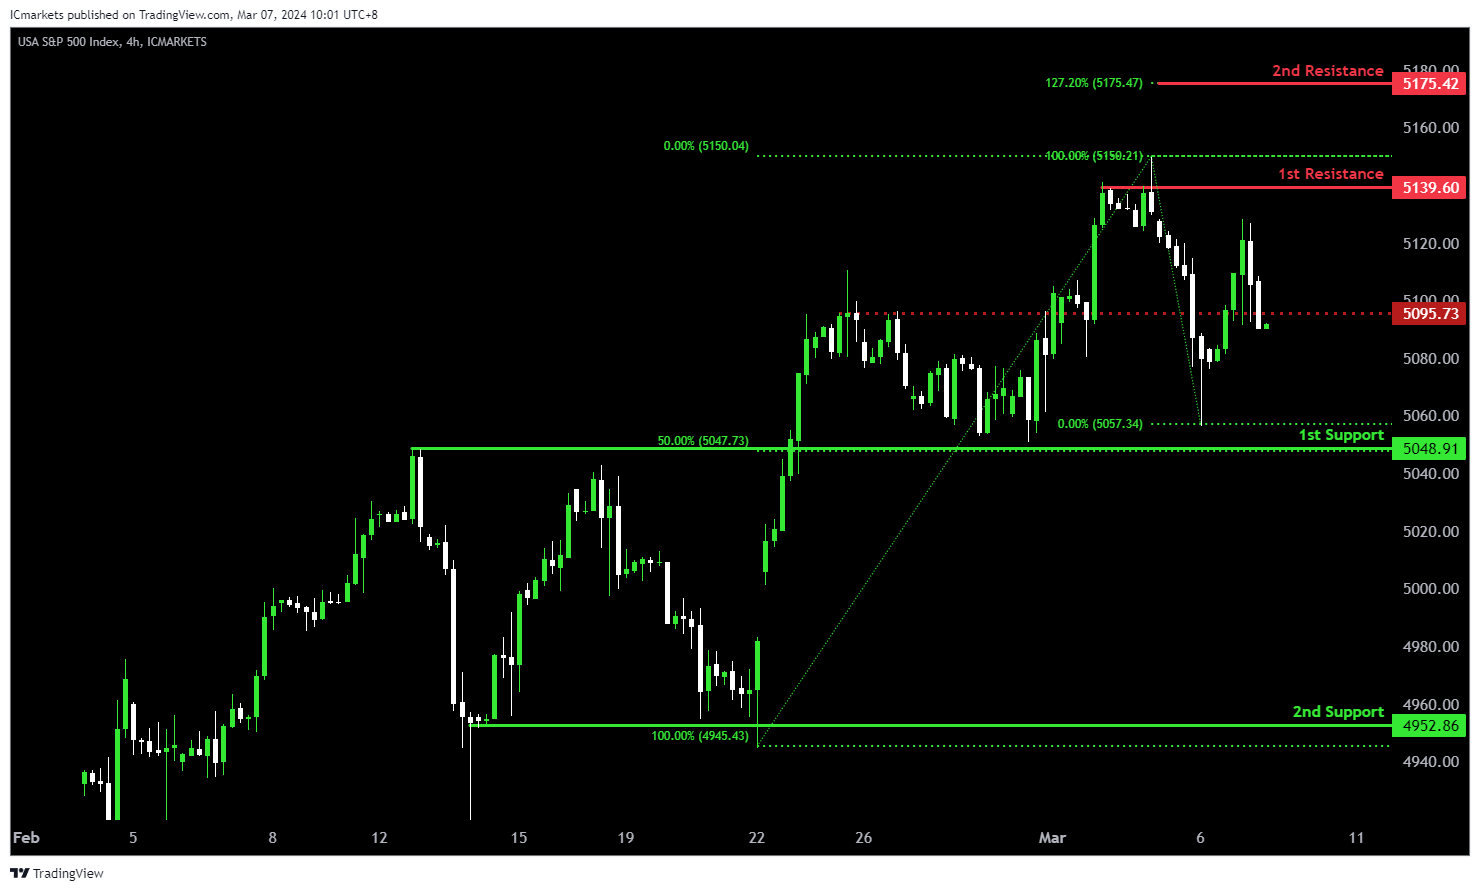
US500:
The US500 chart currently reflects a bearish momentum, suggesting a potential continuation of the downward trend. Several factors support the possibility of a bearish movement towards the 1st support level.
The 1st support at 5048.91 aligns with a pullback support and the 50% Fibonacci Retracement level, indicating a significant historical level where buying interest may emerge. Additionally, the 2nd support at 4952.86 corresponds to a swing low support, further reinforcing its importance as a potential area of support.
On the resistance side, the 1st resistance level at 5139.60 is identified as a swing high resistance, suggesting a historical barrier to upward movement. Furthermore, the 2nd resistance level at 5175.42 coincides with the 127.20% Fibonacci Extension, adding to its significance as a potential barrier to further bullish movement. Additionally, the intermediate resistance at 5095.7 is characterized as a swing high resistance, providing additional reinforcement to the resistance structure.
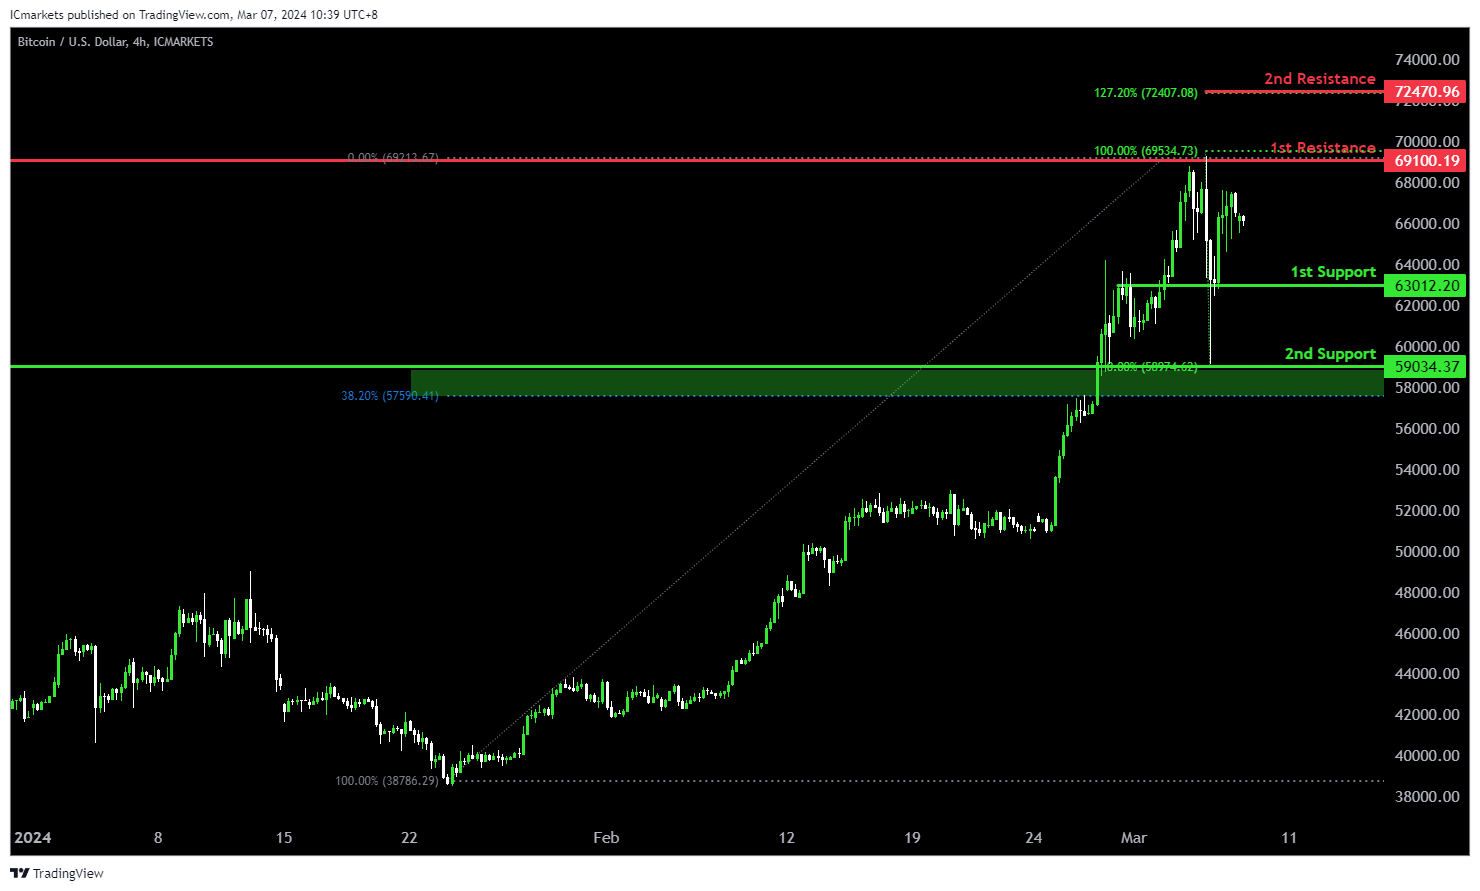
BTC/USD:
The BTC/USD chart currently indicates a bullish momentum, suggesting a potential continuation of the upward trend. Several factors support the possibility of a bullish movement towards the 1st resistance level.
The 1st support at 63012.20 aligns with an overlap support, indicating a significant historical level where buying interest may emerge. Additionally, the 2nd support at 59034.37 corresponds to a pullback support and the 38.20% Fibonacci Retracement level, further reinforcing its importance as a potential area of support.
On the resistance side, the 1st resistance level at 69100.19 is identified as a swing high resistance, suggesting a historical barrier to upward movement. Moreover, the 2nd resistance level at 72470.96 coincides with the 127.20% Fibonacci Extension, adding to its significance as a potential barrier to further bullish movement.
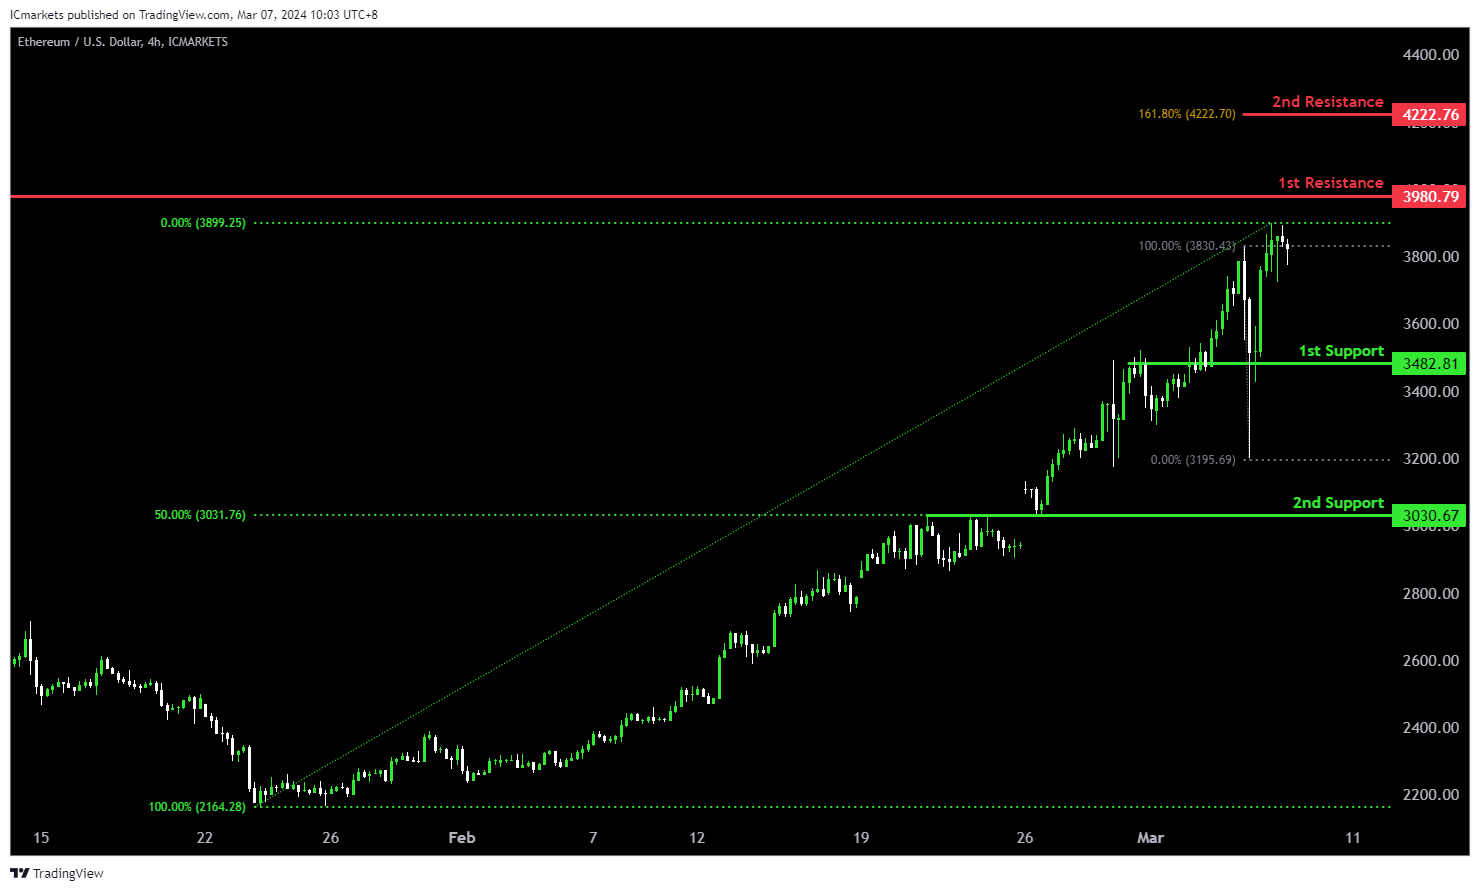
ETH/USD:
The ETH/USD chart currently exhibits bullish momentum, supported by several factors contributing to the upward movement.
The 1st support at 3482.81 aligns with an overlap support, indicating a significant historical level where buying interest is present. Additionally, the 2nd support at 3030.67 corresponds to another overlap support and coincides with the 50% Fibonacci Retracement level, further reinforcing its significance as a potential area of support.
On the resistance side, the 1st resistance level at 3980.79 is characterized as an overlap resistance, suggesting a historical barrier to upward movement. Furthermore, the 2nd resistance level at 4222.76 aligns with the 161.80% Fibonacci Extension, adding to its significance as a potential barrier to further bullish movement.
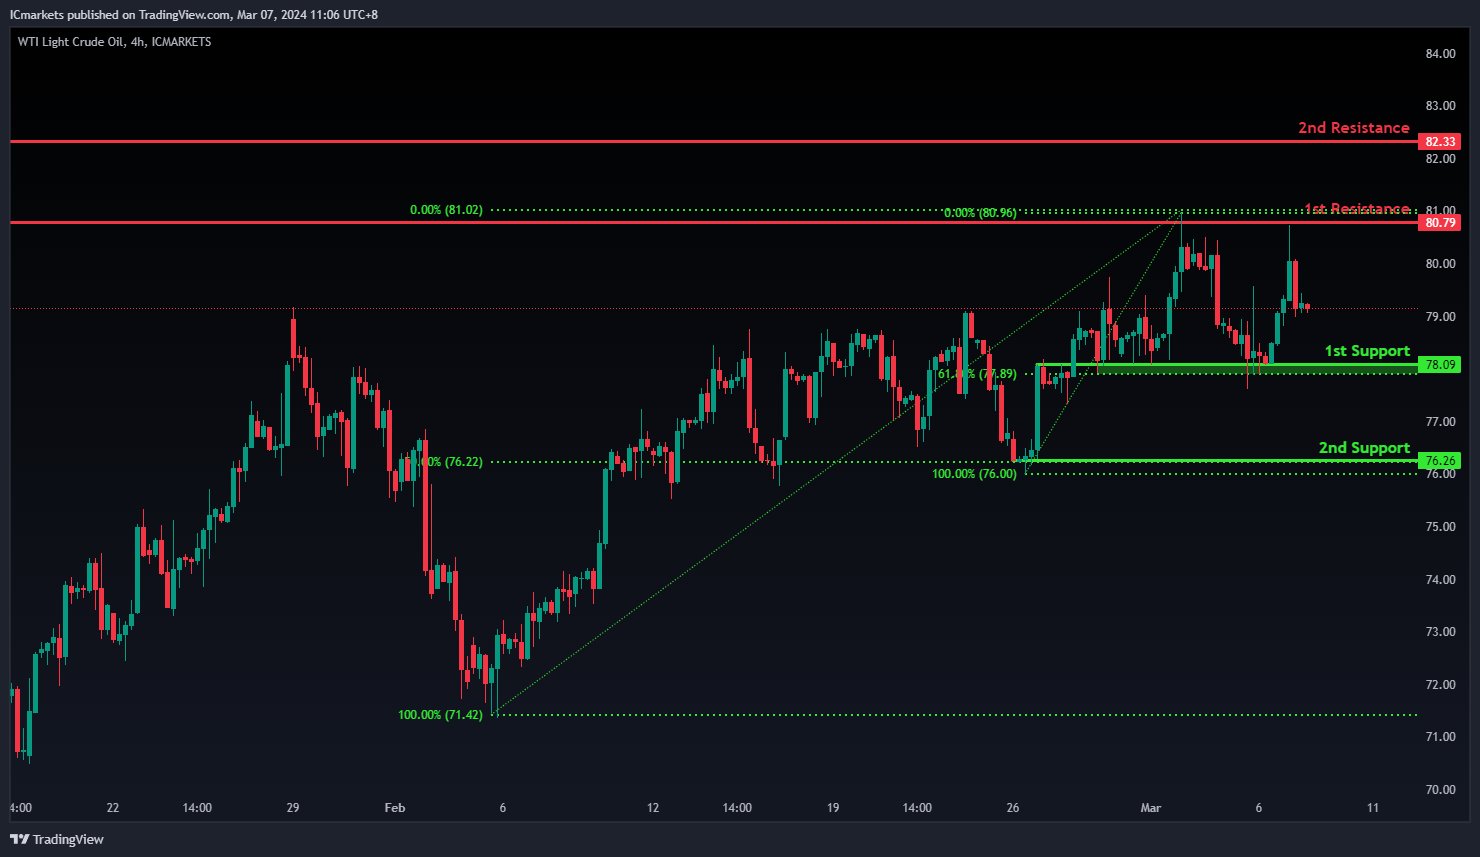
WTI/USD:
The WTI (West Texas Intermediate) oil chart currently exhibits an overall bullish momentum. However, there is a potential scenario for price to fall towards the 1st support before making a bullish bounce and rise towards the 1st resistance.
The 1st support level at 78.09 is identified as an overlap support that aligns with the 61.80% Fibonacci Retracement level. Further below, the 2nd support level at 76.26 is marked as a pullback support that aligns with the 50.00% Fibonacci Retracement level, reinforcing its significance as a key support level.
To the upside, the 1st resistance level at 80.79 is identified as an overlap resistance. Higher up, the 2nd resistance level at 82.33 is marked as a pullback resistance, further highlighting its importance as a potential resistance zone.
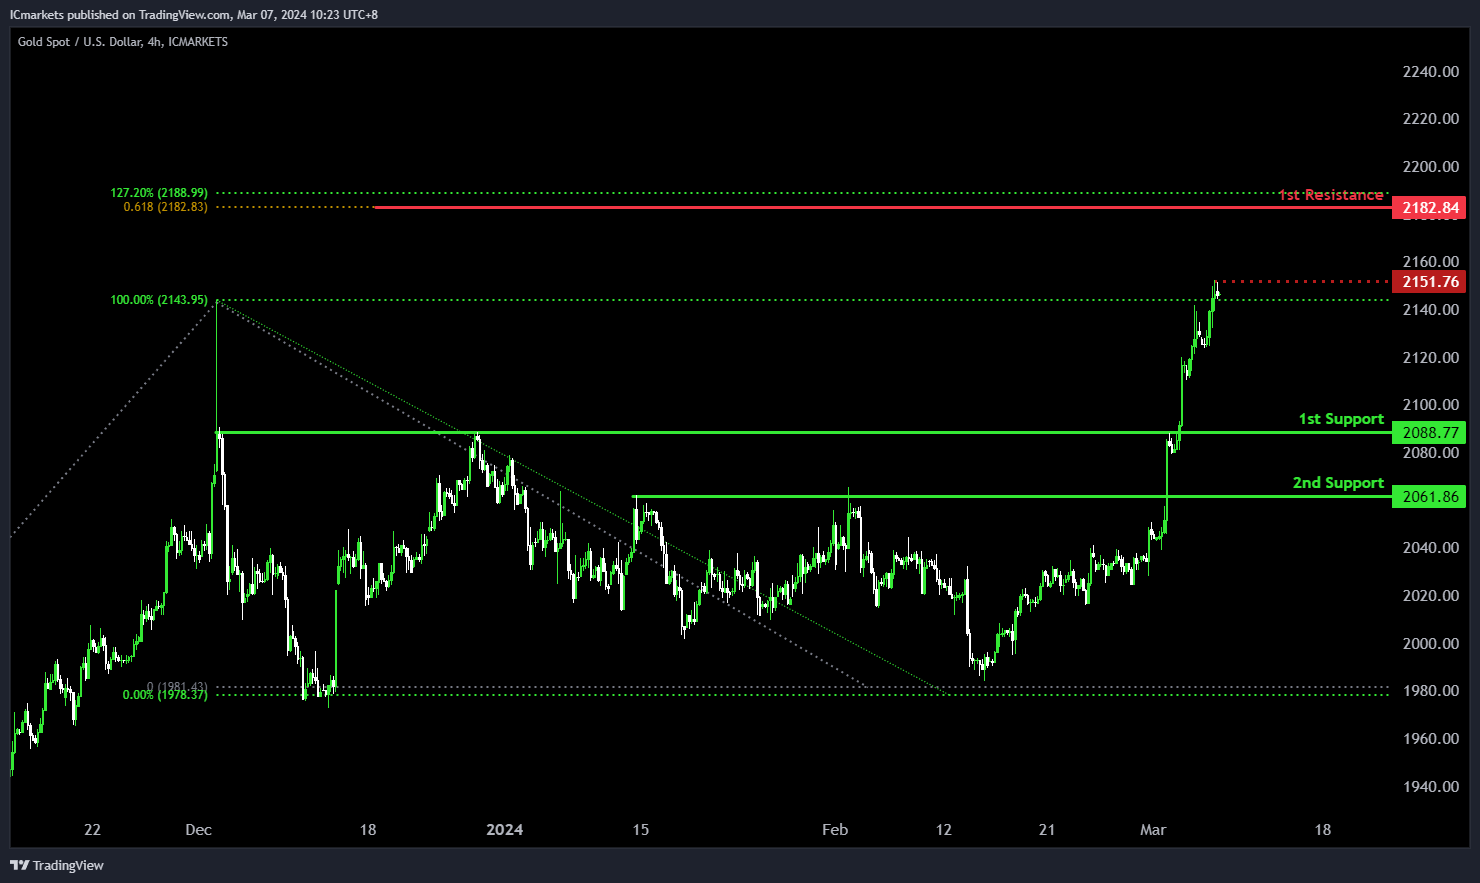
XAU/USD (GOLD):
The XAUUSD (Gold) chart currently demonstrates bullish momentum, suggesting a potential scenario of a drop further to the 1st support in the short term before bouncing from there and rising to the 1st resistance.
The 1st support level at 2088.77 is identified as a pullback support, indicating its historical significance as a level where buying interest has emerged to support the price.
Furthermore, the 2nd support at 2061.86 is characterized as another pullback support, reinforcing its importance as a level where buyers may intervene to prevent further decline.
On the resistance side, the 1st resistance level at 2182.84 is highlighted, corresponding to the 61.80% Fibonacci Projection. This level may act as a barrier where selling pressure could increase, potentially limiting upward movement.
Additionally, the intermediate resistance at 2151.76 is noted as a swing high resistance, further solidifying its significance as a level where selling interest may intensify.


