
DXY:
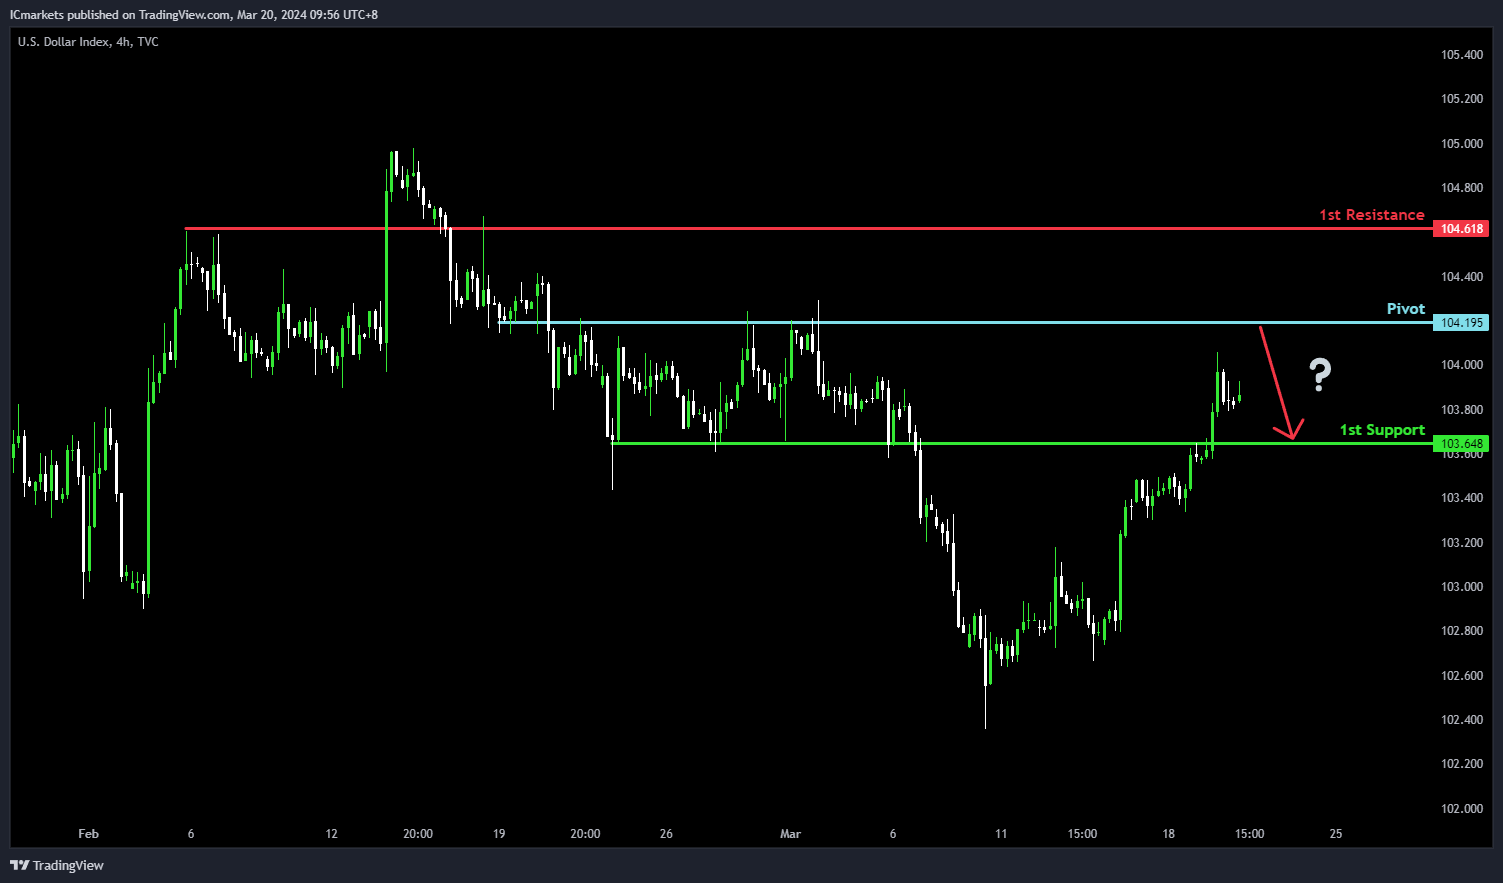
For DXY, aligning with the overall bullish momentum, there’s potential for a bearish reaction from the pivot level, possibly leading to a drop towards the 1st support.
The pivot at 104.19 acts as an overlap resistance, suggesting a pivotal level where selling pressure may arise, supported by its historical significance. Additionally, the 1st support at 103.64 serves as pullback support, reinforcing its importance as a level where buyers have intervened.
On the resistance side, the 1st resistance at 104.61 presents another overlap resistance, potentially capping further upward movement.
EUR/USD:
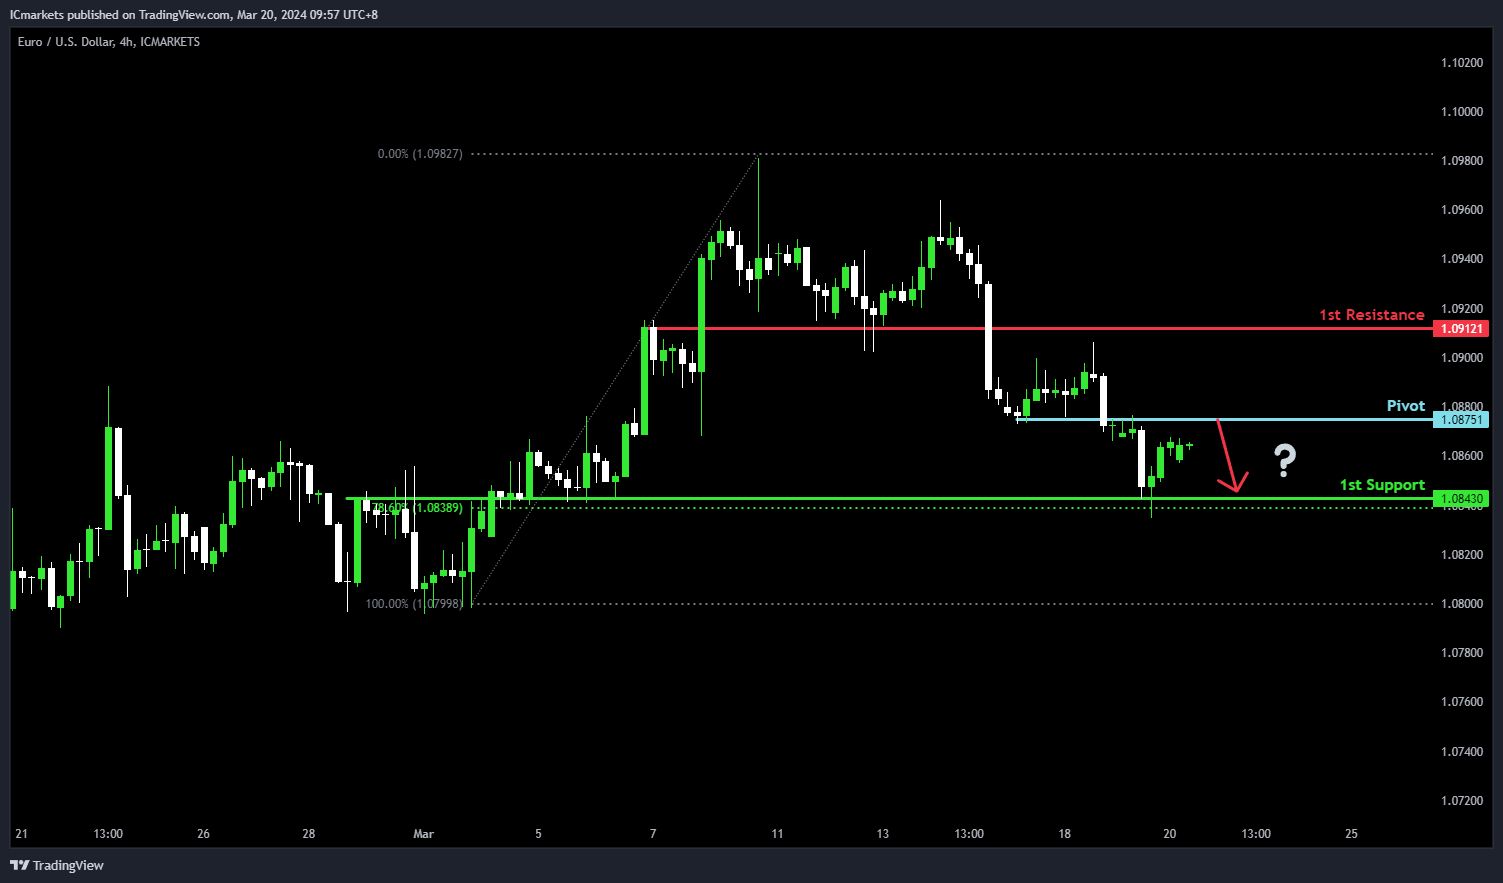
For EUR/USD, aligning with the overall bearish momentum, there’s a potential scenario indicating a bearish reaction from the pivot level, possibly leading to a drop towards the 1st support.
The pivot at 1.0875 acts as an overlap resistance, indicating a significant level where selling pressure might intensify. Additionally, the 1st support at 1.0843 serves as an overlap support, reinforced by the 78.60% Fibonacci Retracement, suggesting a level where buying interest could emerge.
On the resistance side, the 1st resistance at 1.0912 is noted as pullback resistance, potentially limiting further upward movement.
EUR/JPY:
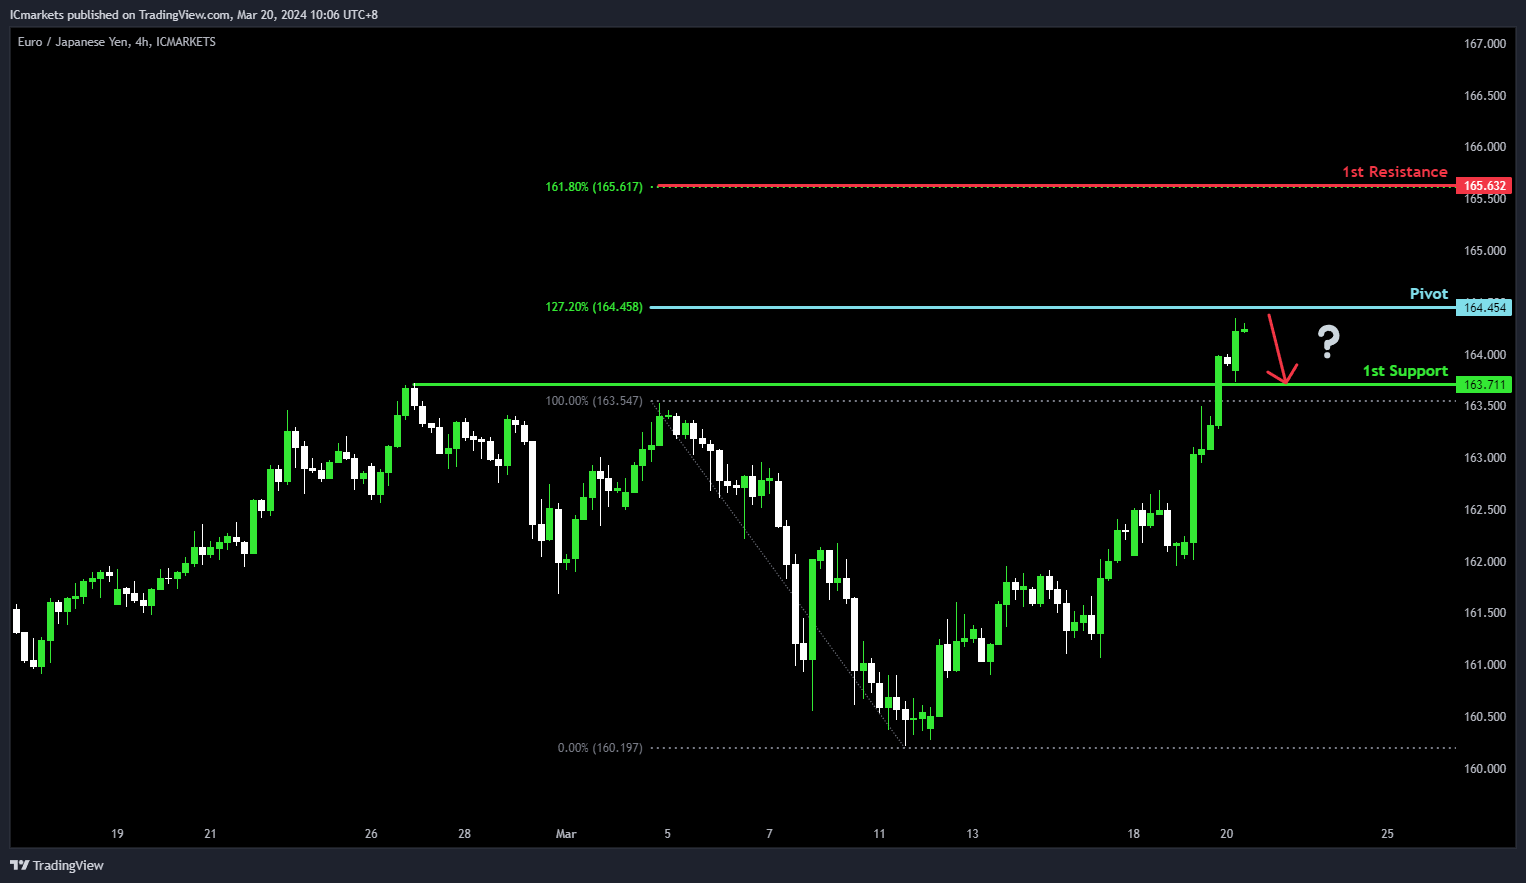
For EUR/JPY, although the overall momentum of the chart remains bullish, there’s a potential for a bearish reaction off the pivot level, suggesting a move towards the 1st support.
The pivot at 164.45 aligns with the 127.20% Fibonacci Extension level, indicating a significant resistance area where selling pressure might increase. This suggests a potential reversal point for the bullish trend.
On the support side, the 1st support at 163.71 acts as an overlap support, historically significant as a level where buyers have intervened before, potentially providing a floor for the price decline.
On the resistance side, the 1st resistance at 165.63 coincides with the 161.80% Fibonacci Extension, forming a barrier to further upward movement and reinforcing the potential bearish sentiment.
EUR/GBP:
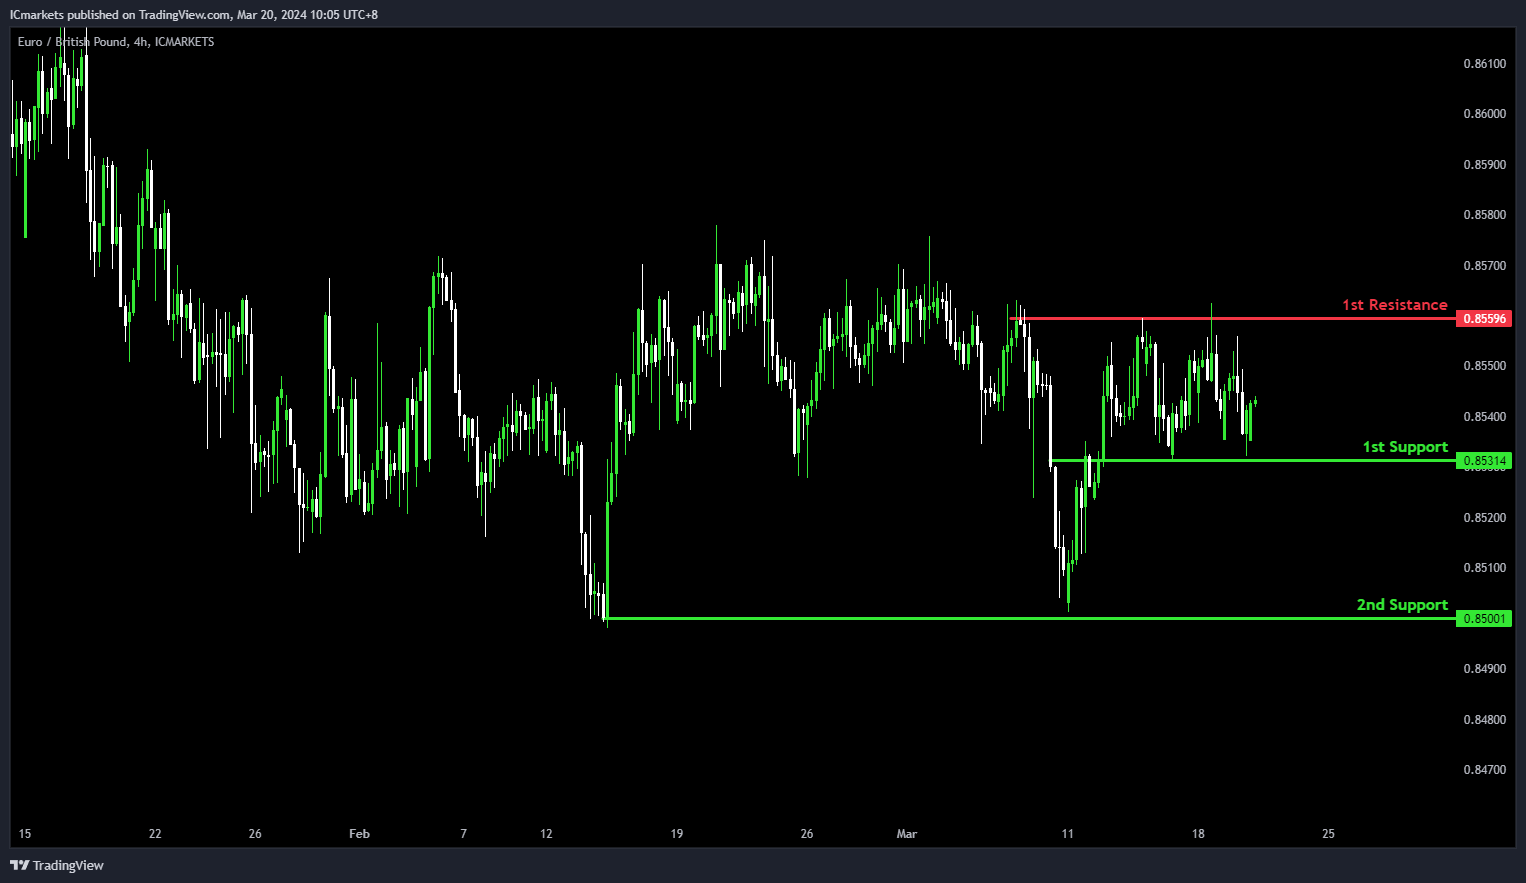
For EUR/GBP, with a neutral outlook and momentum, there’s a likelihood of price oscillating between the 1st resistance and 1st support levels.
The 1st support at 0.8531 is marked by an overlap support, indicating historical significance where buying interest has emerged previously. Additionally, the 2nd support at 0.8500 serves as a swing low support, potentially reinforcing the level where buyers might intervene.
On the resistance side, the 1st resistance at 0.8559 presents a barrier to upward movement, supported by multi-swing high resistance.
GBP/USD:
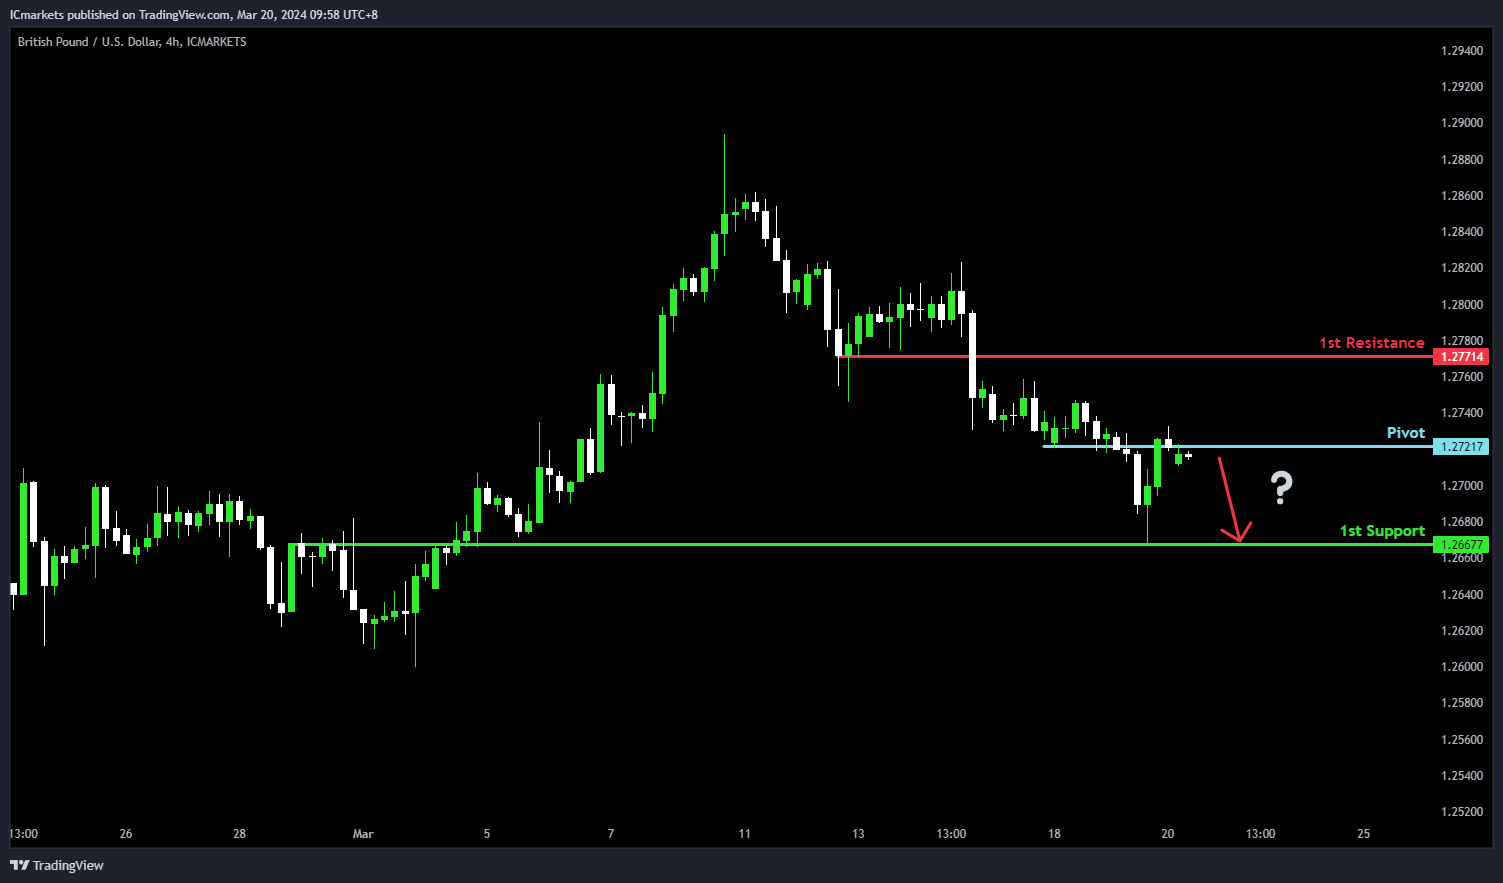
For GBP/USD, reflecting the prevailing bearish momentum, there’s a potential for a bearish reaction from the pivot level, possibly leading to a decline towards the 1st support.
The pivot at 1.2721 serves as an overlap resistance, indicating a significant level where selling pressure might intensify. Conversely, the 1st support at 1.2667 acts as an overlap support, historically significant for attracting buying interest.
On the resistance side, the 1st resistance at 1.2771 is identified as pullback resistance, potentially limiting further upward movement.
GBP/JPY:
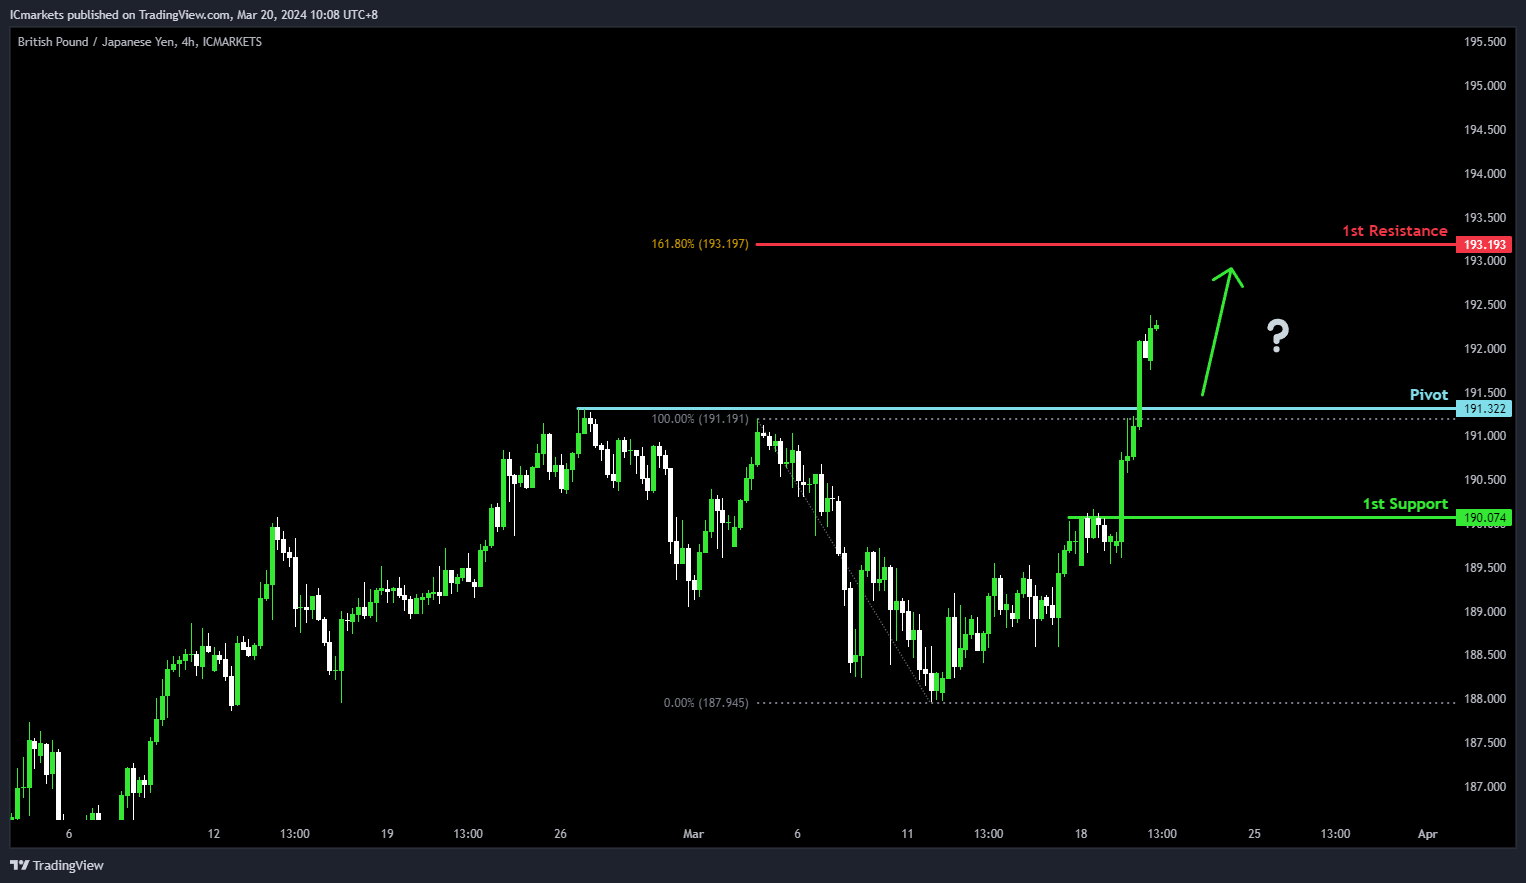
For GBP/JPY, in line with the bullish momentum of the chart, there’s a potential for bullish continuation towards the 1st resistance.
The pivot at 191.32 serves as a significant pullback support, indicating a level where buying interest may emerge, potentially fueling upward momentum.
The 1st support at 190.07 reinforces this sentiment, acting as another level of pullback support, suggesting historical significance as a point where buyers have intervened previously.
On the upside, the 1st resistance at 193.19 aligns with the 161.80% Fibonacci Extension, forming a potential barrier to further upward movement. However, if breached, it could signal continued bullish momentum, potentially leading to further upside targets.
USD/CHF:
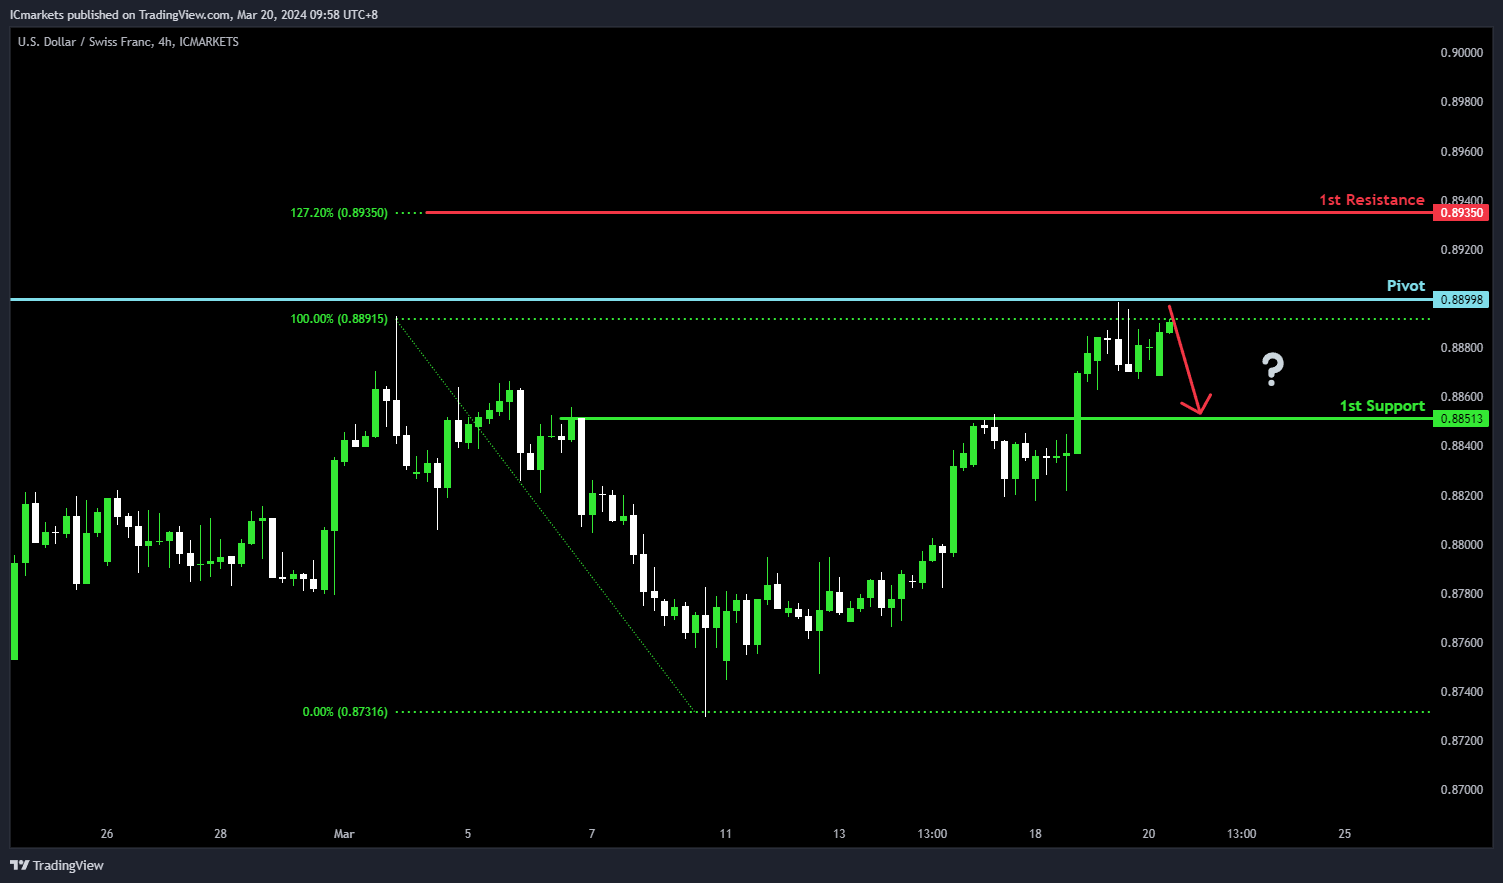
For USD/CHF, in alignment with the prevailing bearish momentum, there’s a potential for a bearish reaction from the pivot level, signaling a decline towards the 1st support.
The pivot at 0.8899 is significant, acting as an overlap resistance, suggesting a level where selling pressure might intensify. Conversely, the 1st support at 0.8851 serves as pullback support, indicating a historical level where buyers have intervened.
On the resistance side, the 1st resistance at 0.8935 is reinforced by the 127.20% Fibonacci Extension, potentially acting as a barrier to upward movement.
USD/JPY:
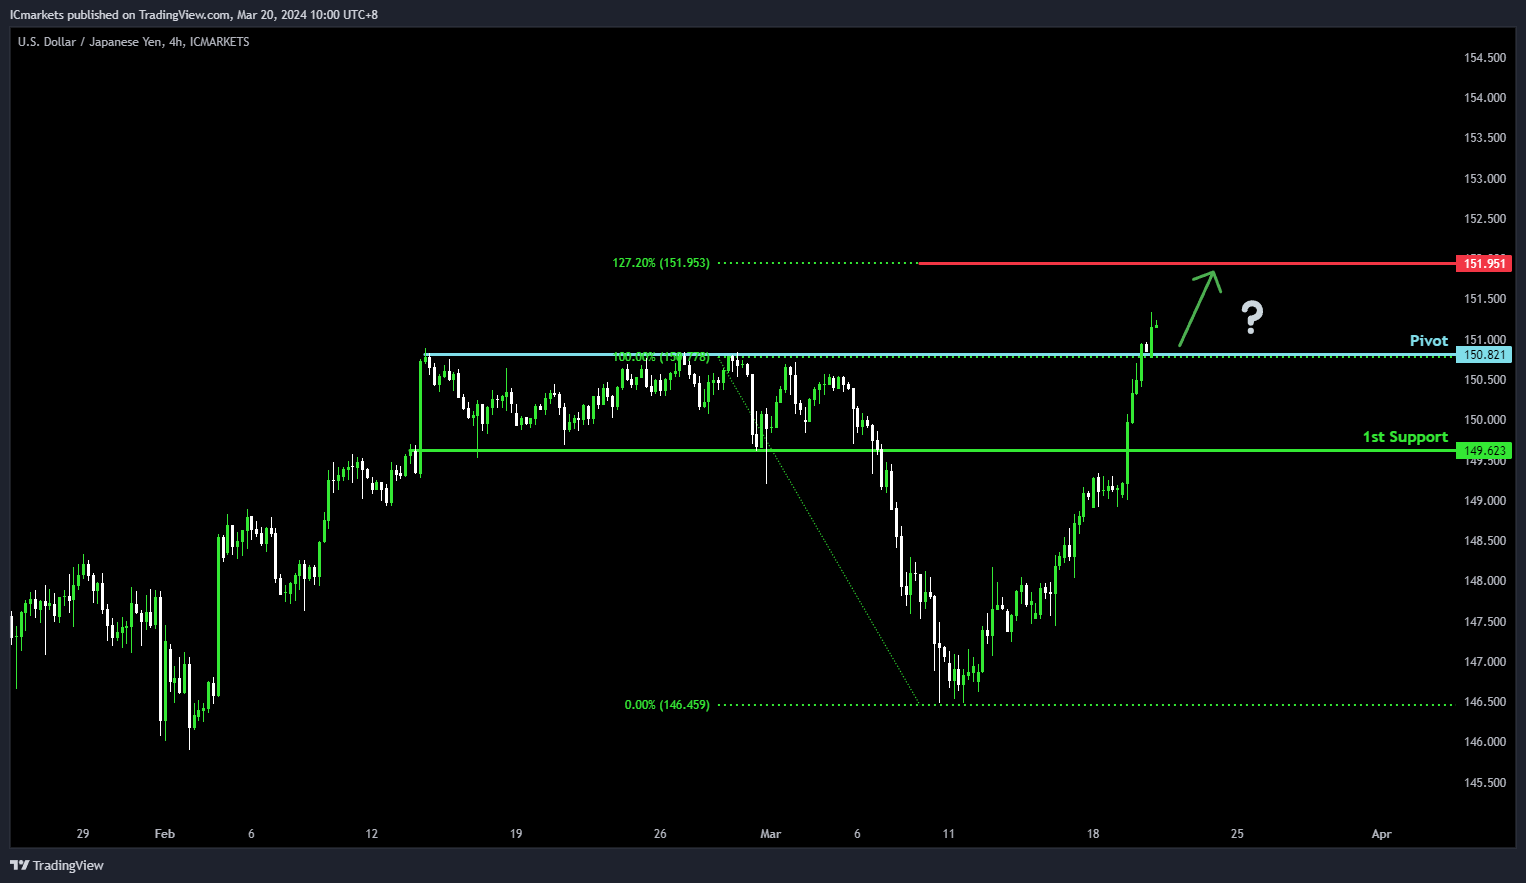
FFor USD/JPY, with the overall bullish momentum intact, there’s potential for a bullish bounce from the pivot towards the 1st resistance.
The pivot at 150.82 acts as pullback support, indicating a level where buying interest may emerge. Additionally, the 1st support at 149.62 reinforces this notion, serving as another level where buyers could intervene, supported by historical data.
On the upside, the 1st resistance at 151.95 is significant, backed by the 127.20% Fibonacci Extension, suggesting a potential barrier to further upward movement.
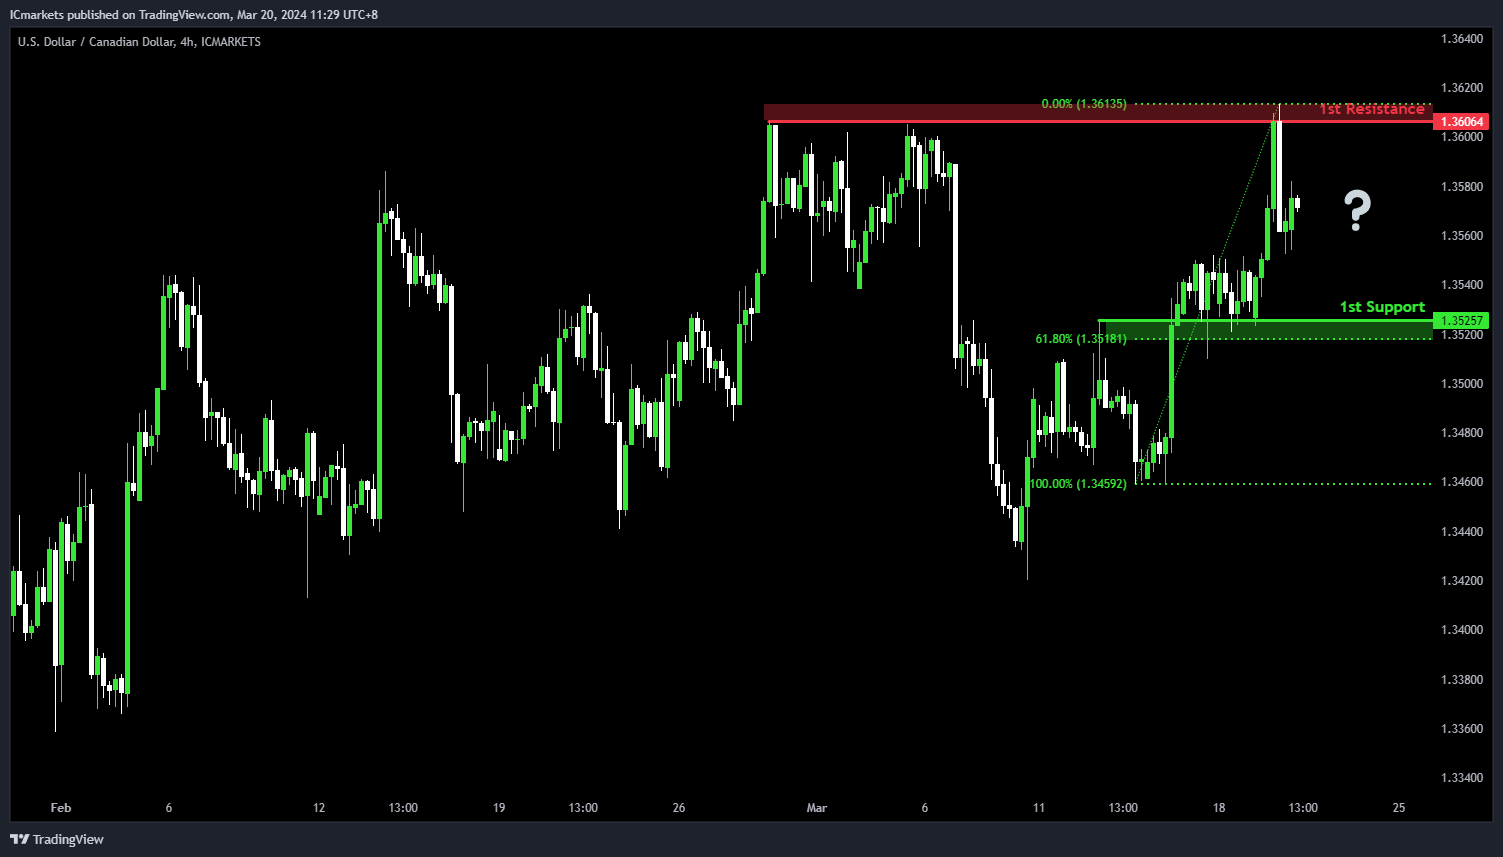
USD/CAD:
The USD/CAD chart currently demonstrates an overall bullish momentum. However, there is a potential scenario for price to fluctuate between the 1st support and the 1st resistance.
The 1st support level at 1.3525 is identified as an overlap support that aligns close to the 61.80% Fibonacci Retracement level, reinforcing its significance as a key support level. Meanwhile the 1st resistance level at 1.3606 is noted as a pullback resistance, further highlighting its importance as a potential resistance zone.
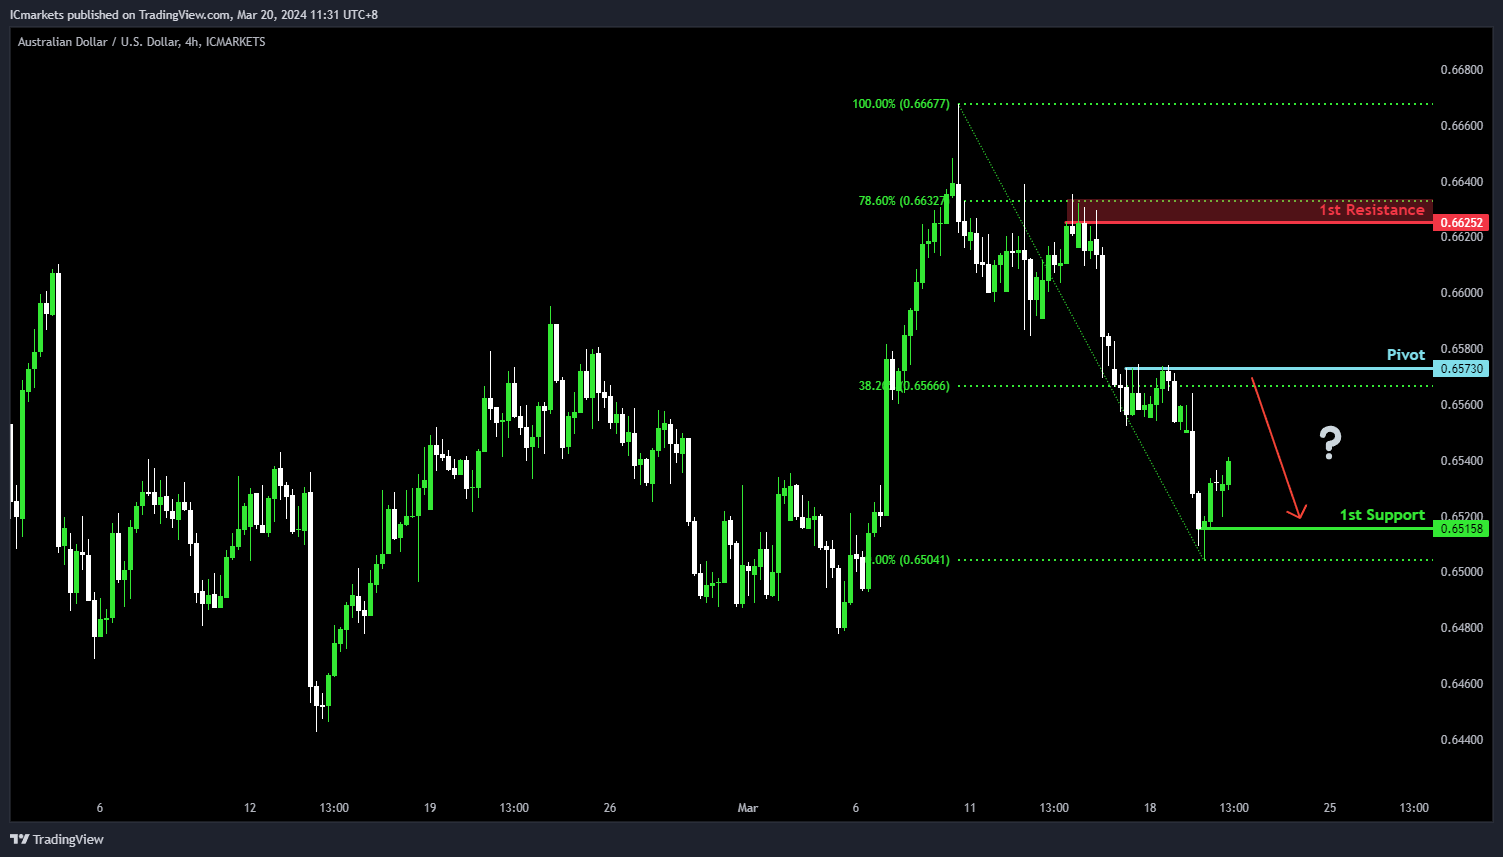
AUD/USD:
The AUD/USD chart currently demonstrates an overall bearish momentum. However, there is a potential scenario for price to rise towards the pivot before potentially resuming the downtrend.
The pivot level at 0.6573 is identified as a pullback resistance that aligns close to the 38.20% Fibonacci Retracement level where price could potentially reverse from to drop lower. The 1st support level at 0.6515 is marked as a pullback support, reinforcing its significance as a key support level.
On the resistance side, the 1st resistance level at 0.6625 is noted as a pullback resistance that aligns close to the 78.60% Fibonacci Retracement level, potentially limiting any further upward movement.
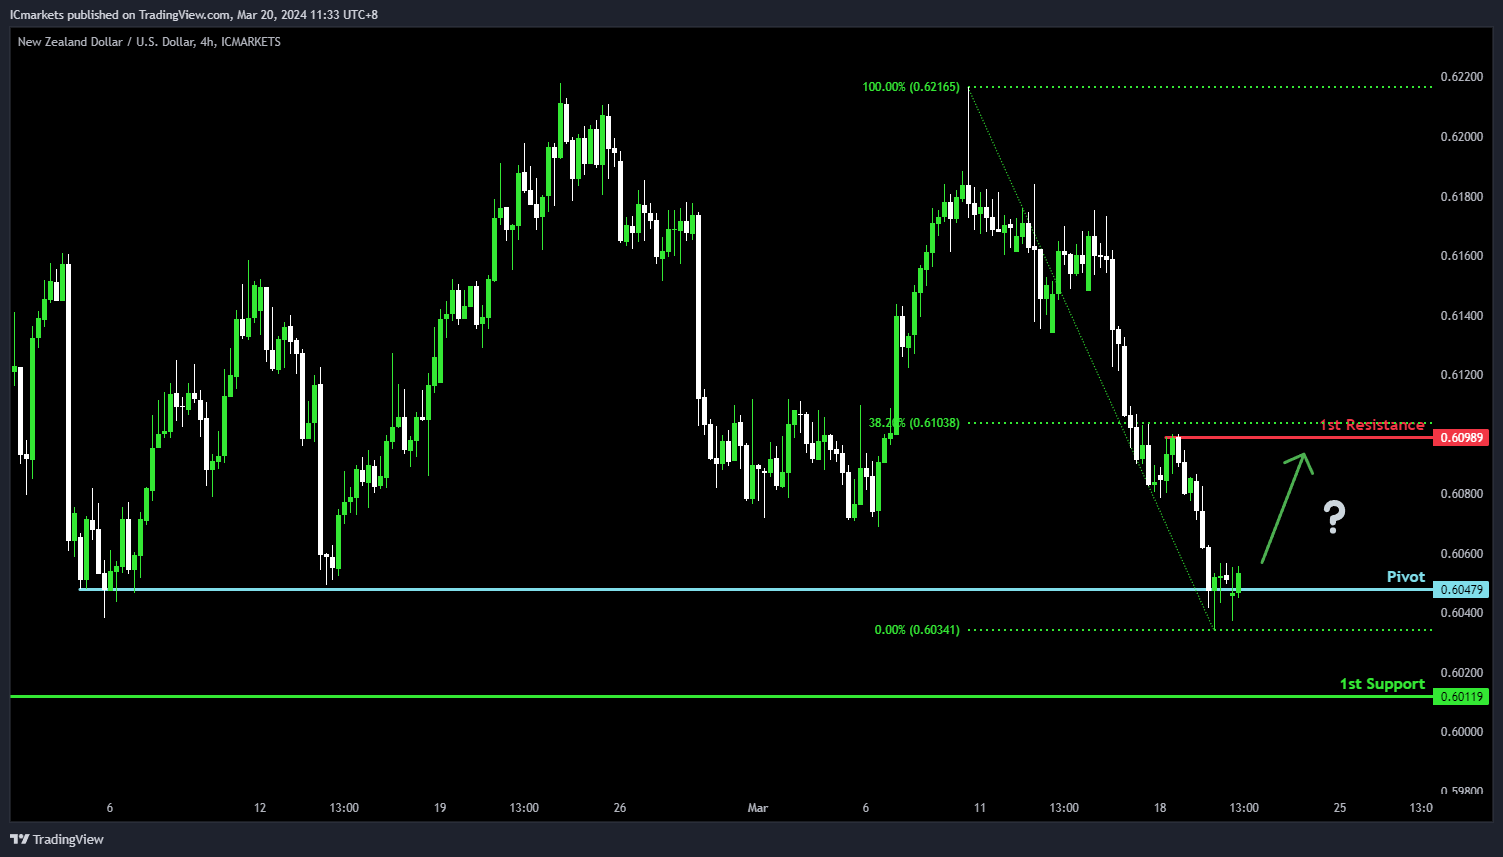
NZD/USD
The NZD/USD chart currently demonstrates an overall bearish momentum. However, there is a potential scenario for price to bounce off the pivot and rise towards the 1st resistance.
The pivot level at 0.6047 is identified as a multi-swing-low support where price could potentially bounce off to climb higher. The 1st resistance level at 0.6098 is noted as a pullback resistance that aligns close to the 38.20% Fibonacci Retracement level, potentially limiting any further upward movement.
On the support side, the 1st support level at 0.6011 is marked as a pullback support, reinforcing its significance as a key support level.
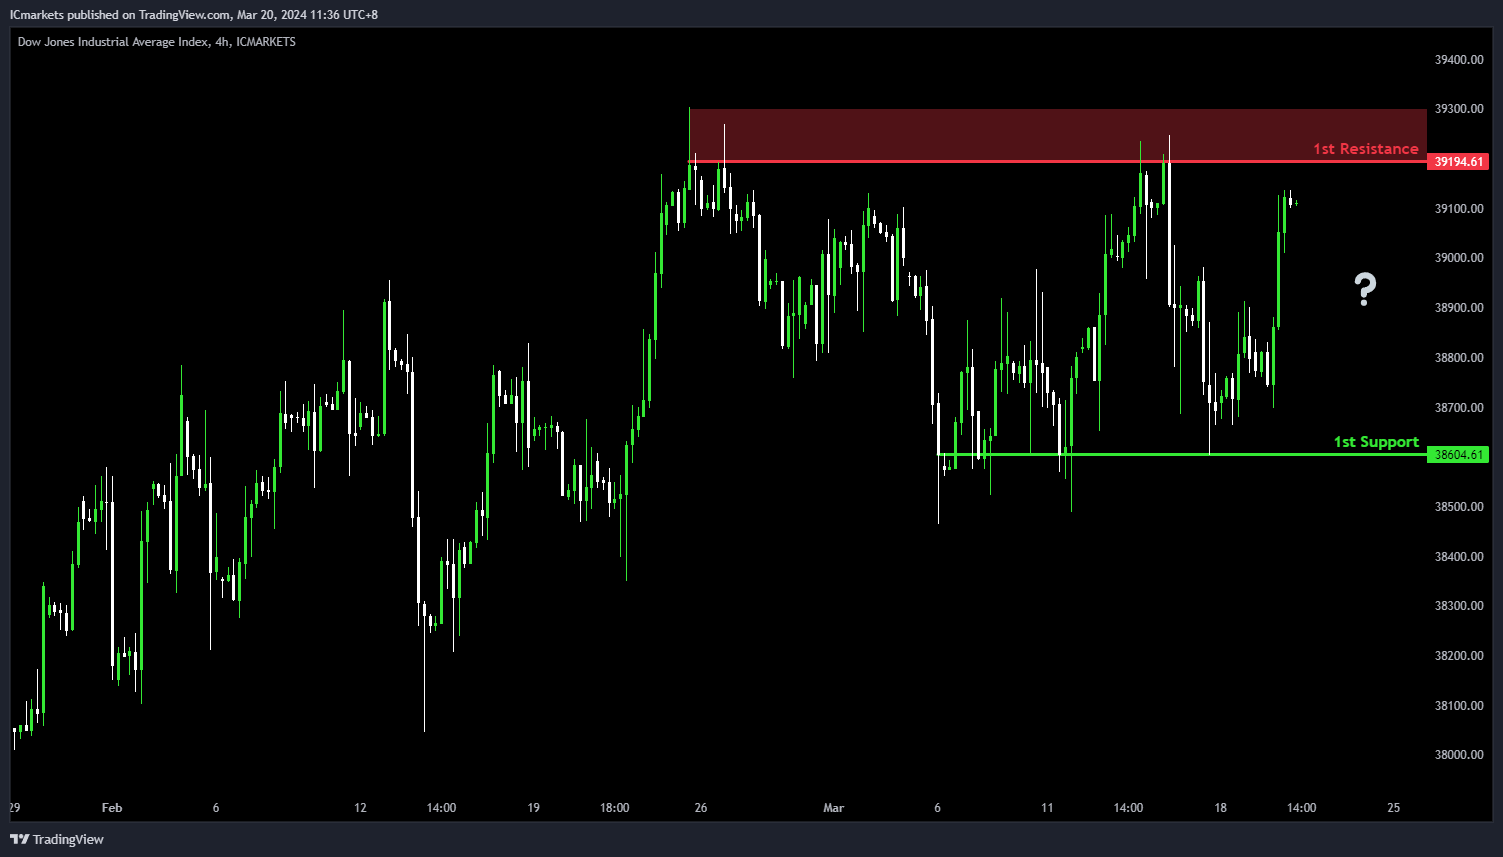
DJ30:
The Dow Jones chart (DJ30) currently exhibits a neutral bias. In this context, there is a potential scenario for price to fluctuate between the 1st support and the 1st resistance.
The 1st resistance level at 39,194.61 is identified as a pullback resistance, potentially impeding any further bullish movement. Meanwhile, the 1st support level at 38,604.61 is noted as a pullback support, reinforcing its significance as a key support level.
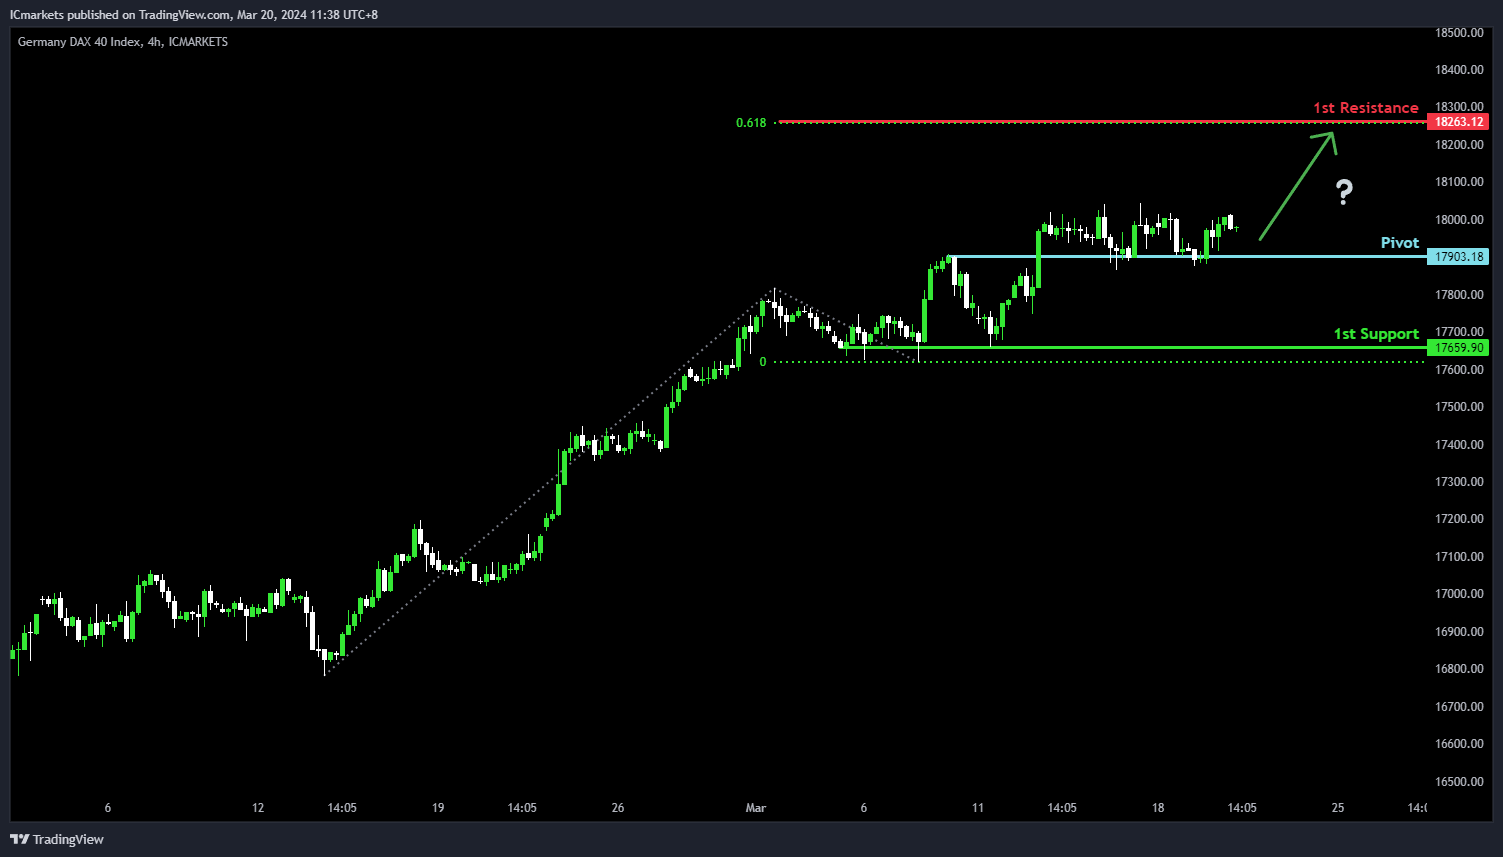
GER40:
The DAX chart (GER40) currently exhibits an overall bullish momentum. In this context, there is a potential scenario for price to bounce off the pivot and rise towards the 1st resistance.
The pivot level at 17,903.18 is identified as an overlap support where price could potentially bounce off to climb higher. The 1st resistance level at 18,263.12 is noted as a resistance level that aligns with the 61.80% Fibonacci Projection level, potentially limiting any further upward movement.
On the support side, the 1st support level at 17,659.90 is marked as a pullback support, reinforcing its significance as a key support level.
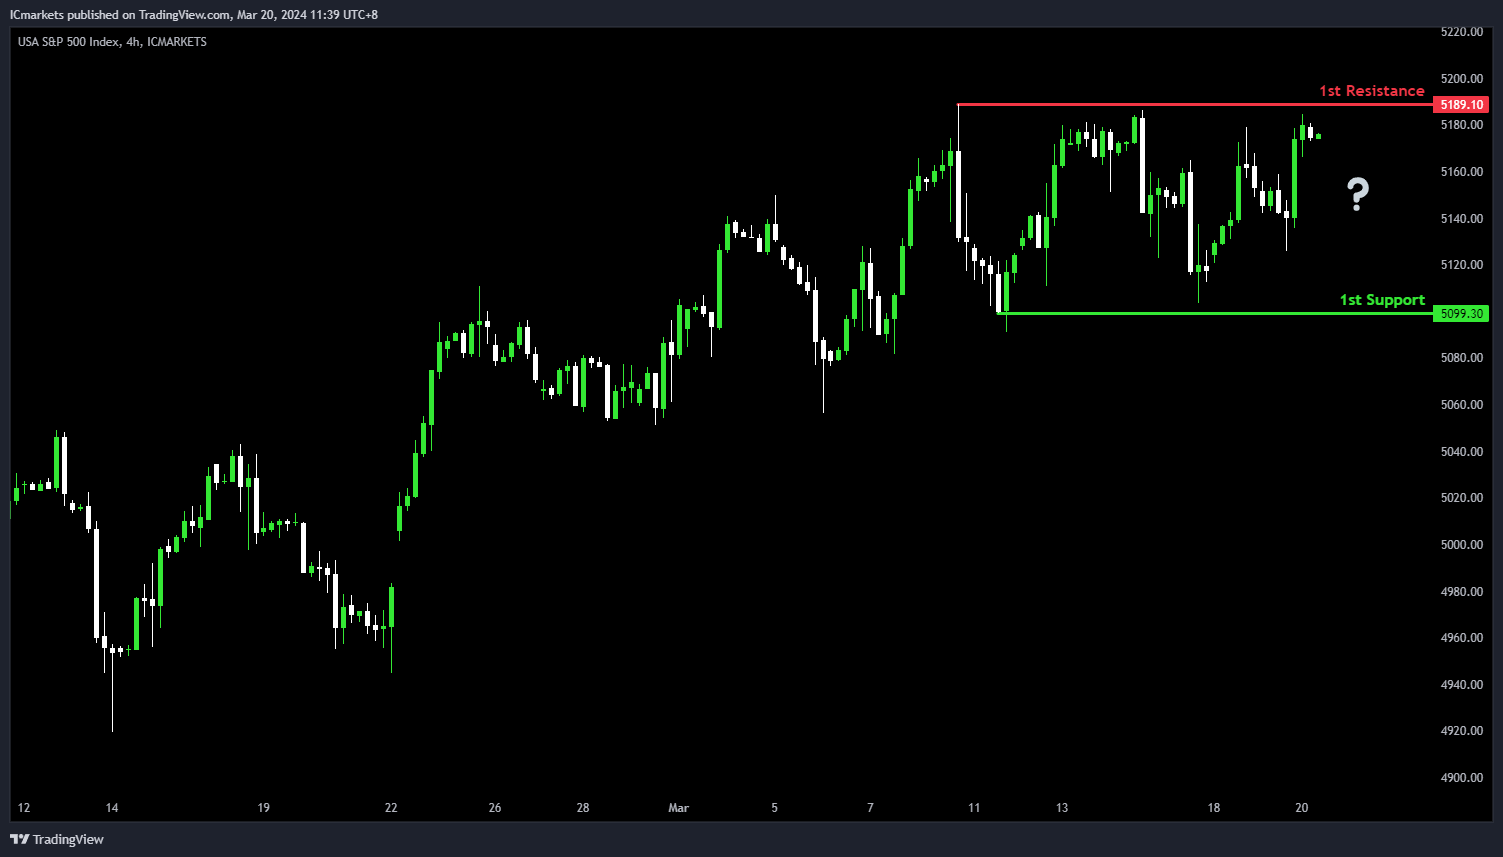
US500:
The S&P 500 chart (US500) currently exhibits a neutral bias. In this context, there is a potential scenario for price to fluctuate between the 1st support and the 1st resistance.
The 1st resistance level at 5,189.10 is identified as a pullback resistance, potentially impeding any further bullish movement. Meanwhile, the 1st support level at 5,099.30 is noted as a pullback support, reinforcing its significance as a key support level.
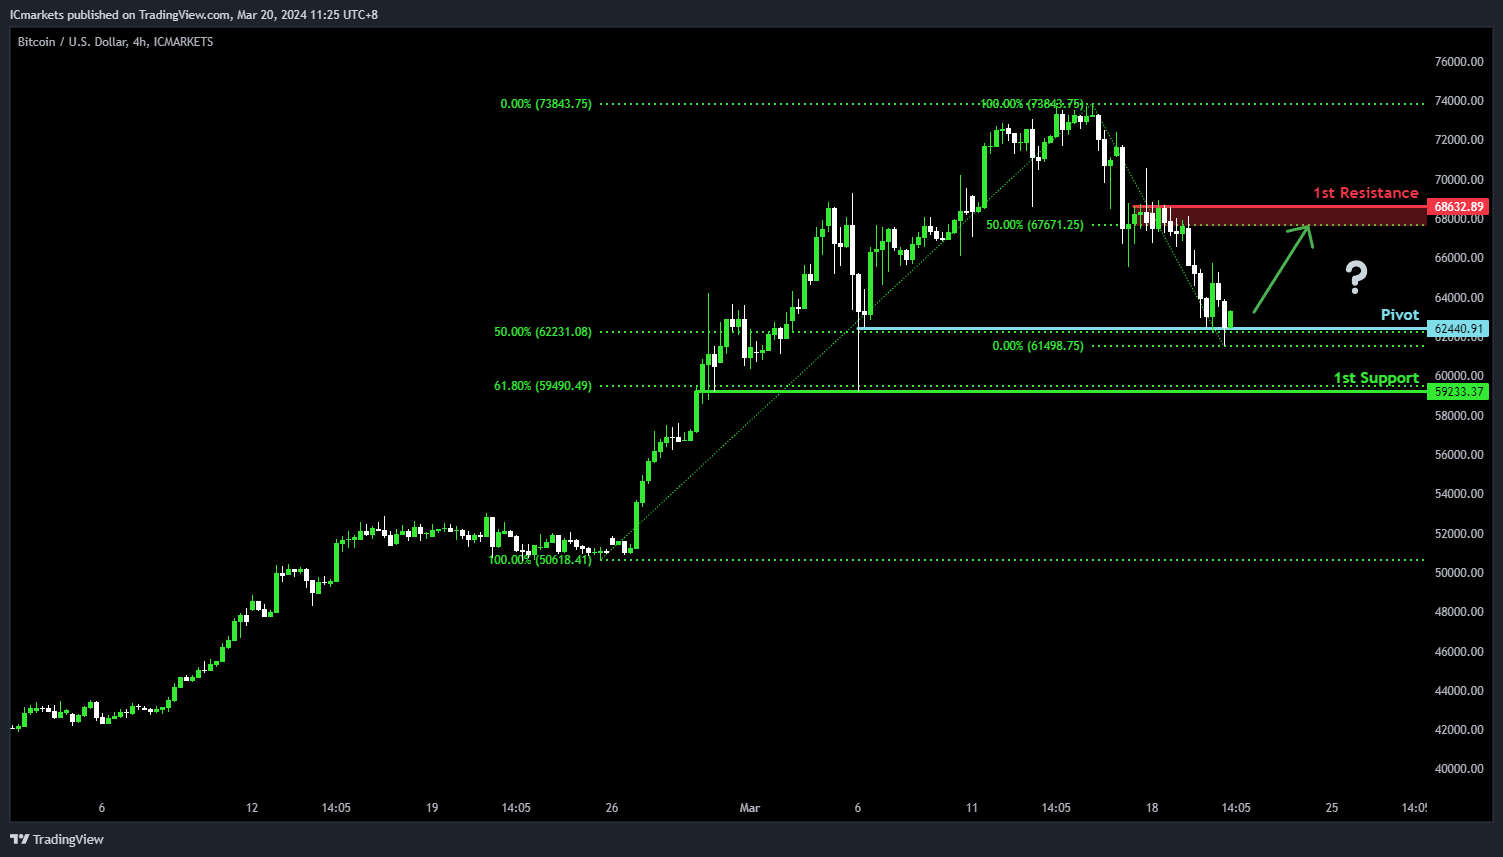
BTC/USD:
The Bitcoin chart (BTC/USD) currently demonstrates an overall bearish momentum. However, there is a potential scenario for price to bounce off the pivot and rise towards the 1st resistance.
The pivot level at 62,440.91 is identified as a pullback support that aligns with the 50.00% Fibonacci Retracement level where price could potentially make a bullish bounce. The 1st resistance level at 68,632.89 is noted as a pullback resistance that aligns close to the 50.00% Fibonacci Retracement level, further reinforcing its significance as a potential barrier to further bullish movement.
To the downside, the 1st support level at 59,233.37 is marked as a pullback support that aligns with the 61.80% Fibonacci Retracement level, reinforcing its significance as a key support level.
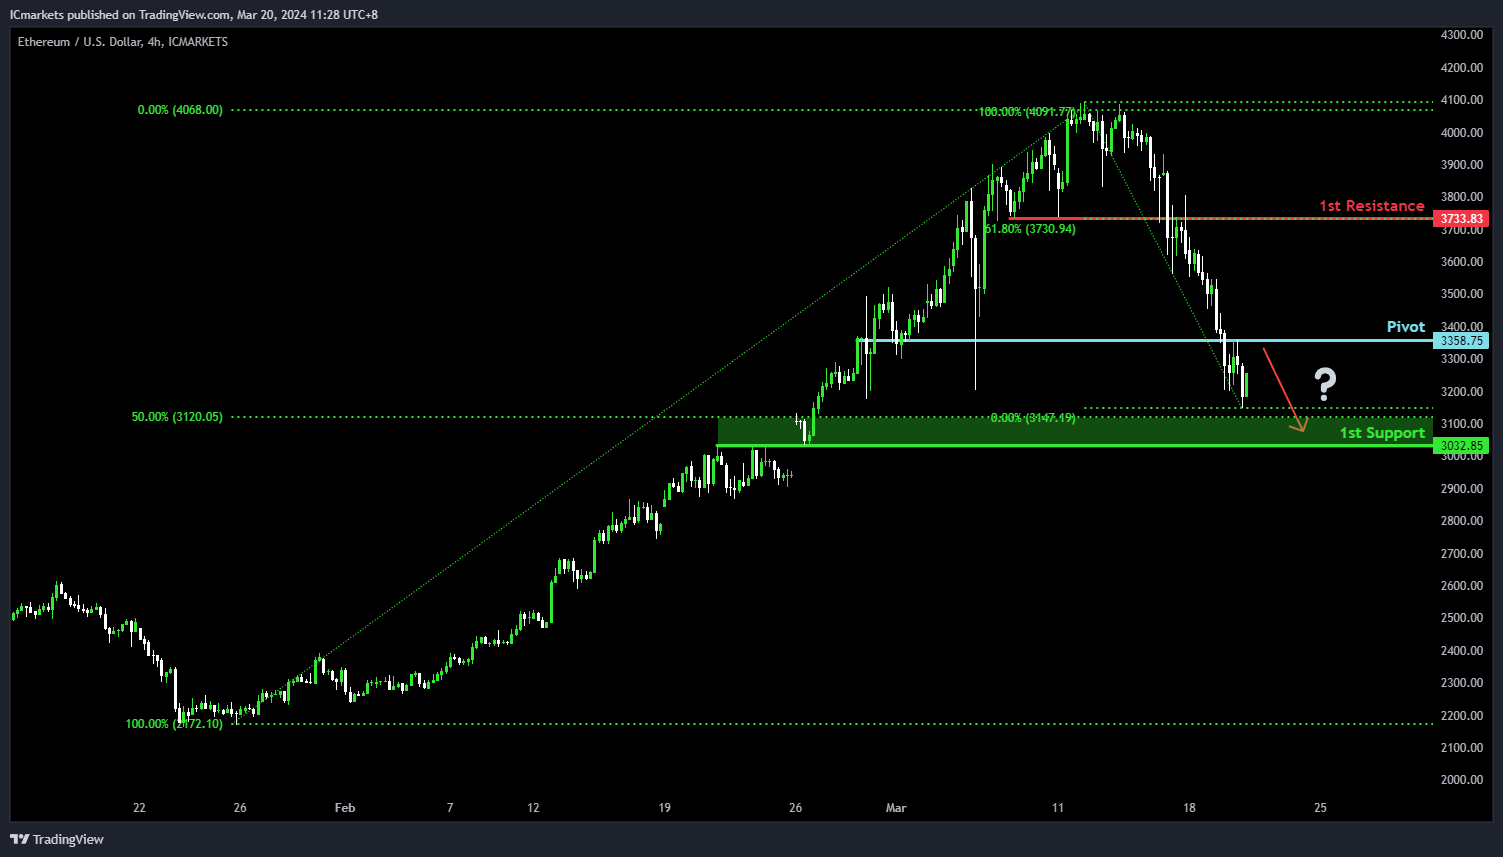
ETH/USD:
The Ethereum chart (ETH/USD) currently demonstrates an overall bearish momentum. However, there is a potential scenario for price to rise towards the pivot before potentially reversing to drop towards the 1st support.
The pivot level at 3,358.75 is identified as an overlap resistance where price could potentially make a bearish reversal. The 1st support level at 3,032.85 is marked as an overlap support that aligns close to the 50.00% Fibonacci Retracement level, reinforcing its significance as a key support level.
To the upside, the 1st resistance level at 3,733.83 is noted as an overlap resistance that aligns with the 61.80% Fibonacci Retracement level, further reinforcing its significance as a potential barrier to further bullish movement.
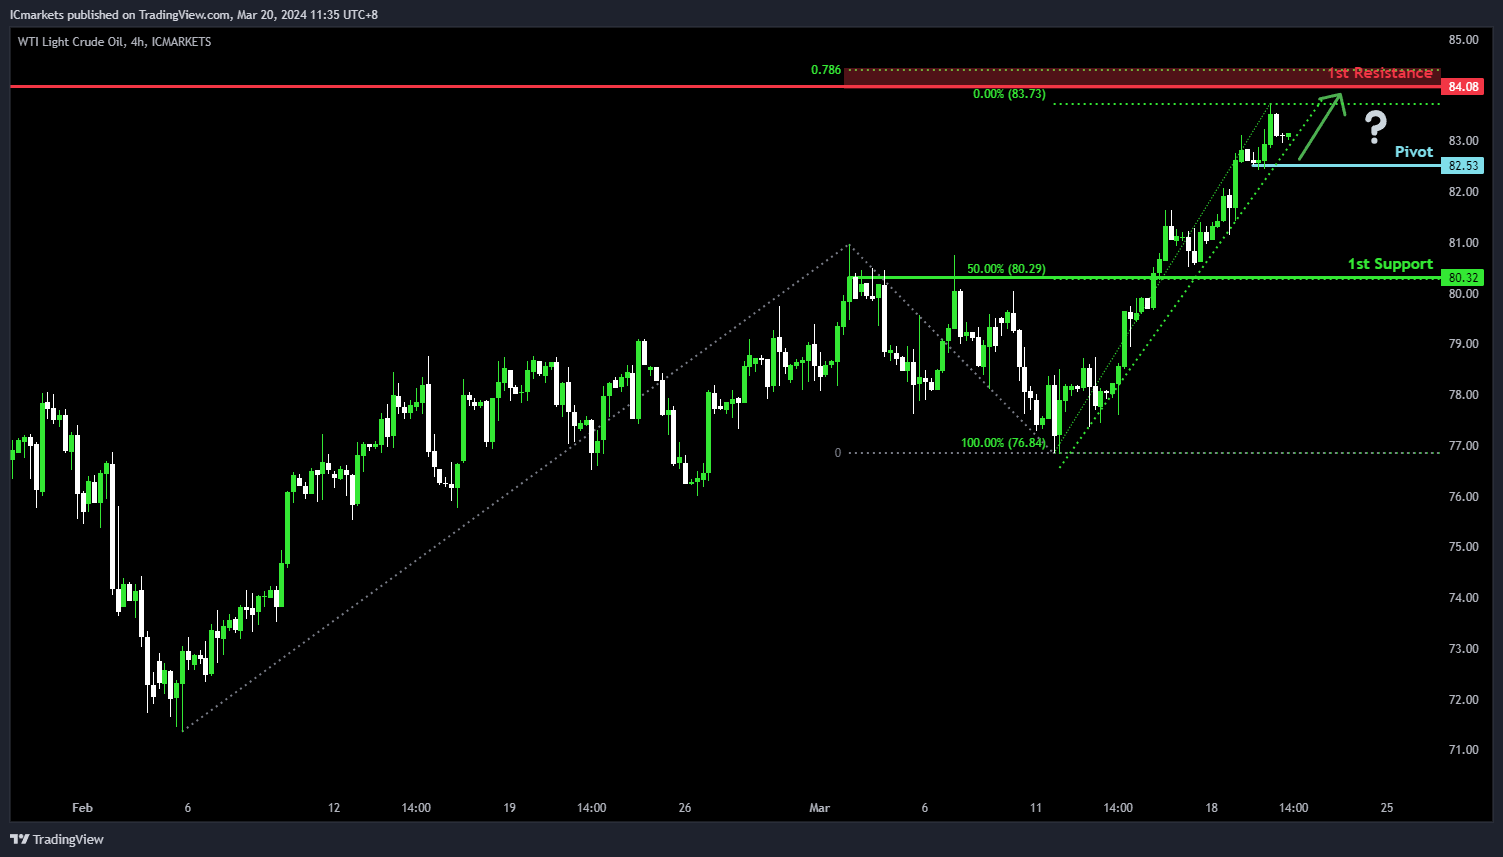
WTI/USD:
The WTI (West Texas Intermediate) oil chart currently demonstrates an overall bullish momentum as supported by the ascending trendline. Howere, there is a potential scenario for price to fall towards the pivot before making a bullish bounce to rise towards the 1st resistance.
The pivot level at 82.53 is identified as a pullback support where price could potentially make a bullish bounce. The 1st resistance level at 84.08 is noted as an overlap resistance that aligns close to the 78.60% Fibonacci Projection level, further reinforcing its significance as a potential barrier to further bullish movement.
To the downside, the 1st support level at 80.32 is marked as a pullback support that aligns with the 50.00% Fibonacci Retracement level, reinforcing its significance as a key support level.
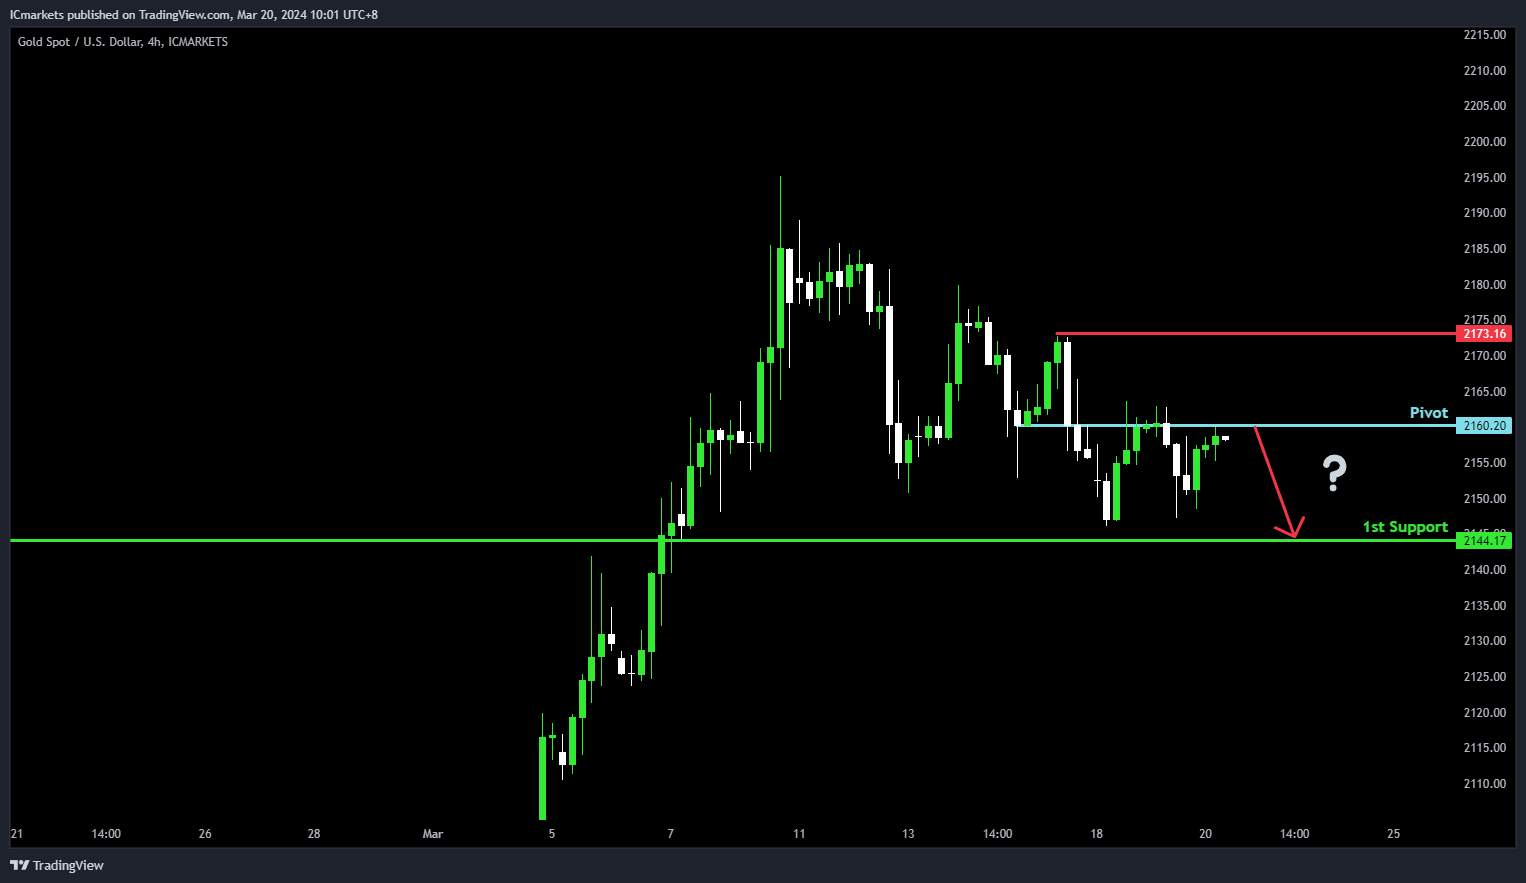
XAU/USD (GOLD):
For XAU/USD, despite the overall bullish momentum, there’s a potential for a bearish reaction from the pivot towards the 1st support.
The pivot at 2160.20 serves as an overlap support, indicating a level where buyers have historically intervened. Additionally, the 1st support at 2144.17 reinforces this notion, acting as a pullback support level where buying interest may increase.
On the other hand, the 1st resistance at 2173.16 forms a significant barrier, backed by swing high resistance, potentially limiting further upward movement.


