
It isn’t typical to see as much FX volatility ahead of such a key FOMC.
Currency Markets had been particularly slow throughout August after some post-NFP correction in the US Dollar – Despite having reasons to sell the USD further, particularly after Powell’s dovish speech at Jackson Hole, end-summer slow trading largely contained volatility for fiat majors.
To catch up with the volatility seen in Equities (which kept flying higher throughout that entire period), the US Dollar took a two-day downward train to start this week.
The greenback saw close to 1% moves in Monday and yesterday’s consecutive sessions against European currencies particularly – The widest range throughout the whole FX Market between the 12th of August to last Friday had been ~0.50%.
As explained in our previous piece, except for a huge switch of fundamentals and/or a leak to an upcoming decision, it is rare that players accelerate such volatility ahead of the FOMC.
The only reasoning would be strong and sudden hedging that corroborates with Miran entering the FOMC meeting right before its start.
Anyways, let’s have a look at technical levels for all FX major pairs as the market gets ready for the FOMC decision (and the Bank of Canada rate decision, releasing very soon – we will update the levels on a new piece).
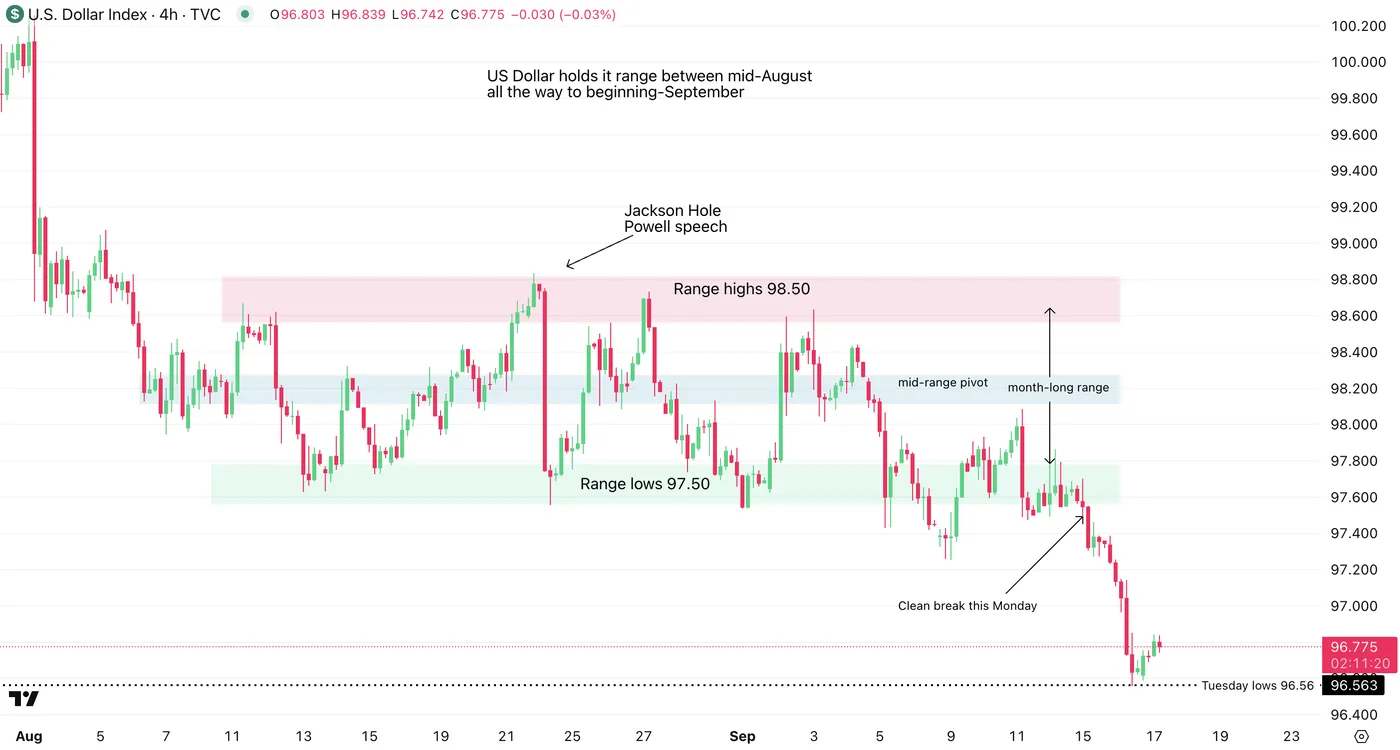
DXY 4H Chart, September 17, 2025 – Source: TradingView
All FX Majors Charts with the key levels in play for the September FOMCNZDUSD 8H Chart and levels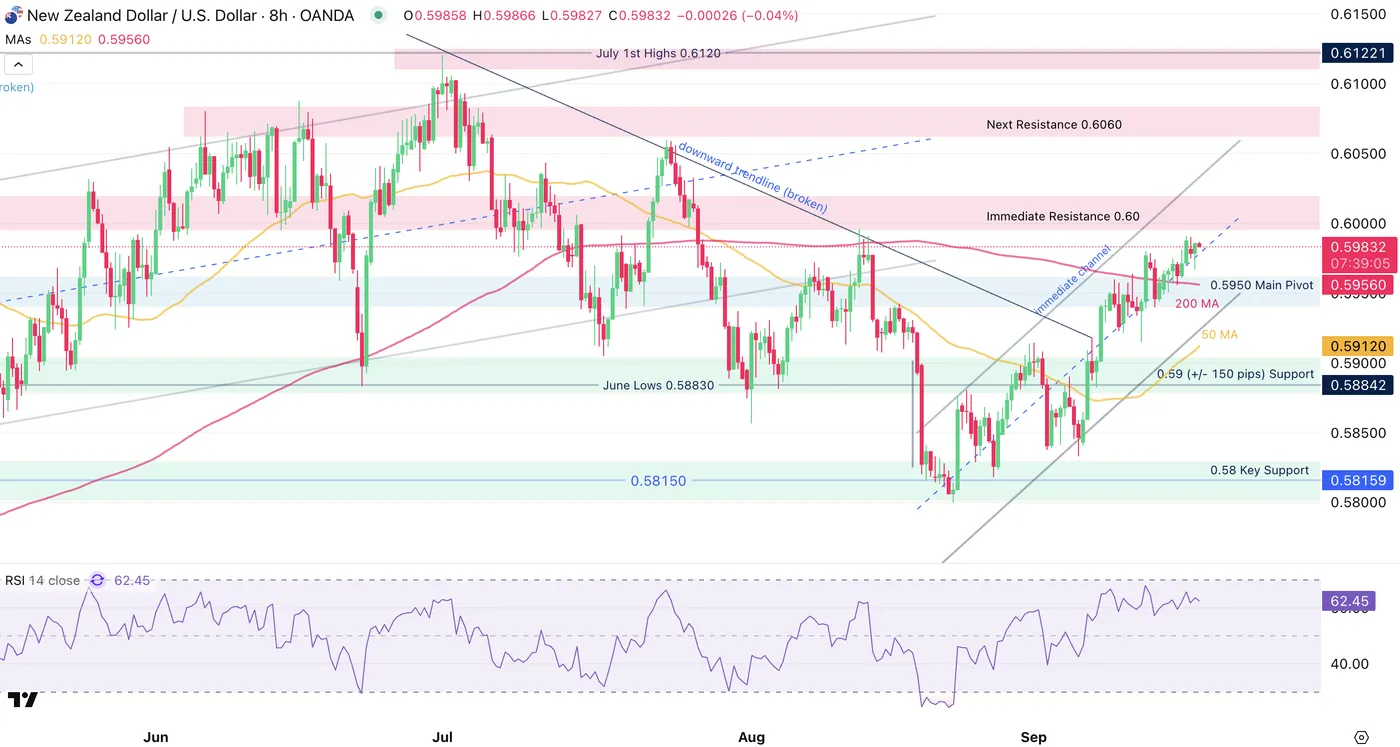 NZDUSD 8H Chart, September 17, 2025, Source: TradingView
Trading Levels for NZDUSD:
Resistance Levels
- Immediate Resistance 0.60
- Next Resistance 0.6060
- July 1st Highs 0.6120
Support Levels
- 0.5950 Main Pivot (acting as immediate support)
- 0.59 (+/- 150 pips) Support
- 0.58 Key Support
USDJPY 8H Chart and levels (testing support)
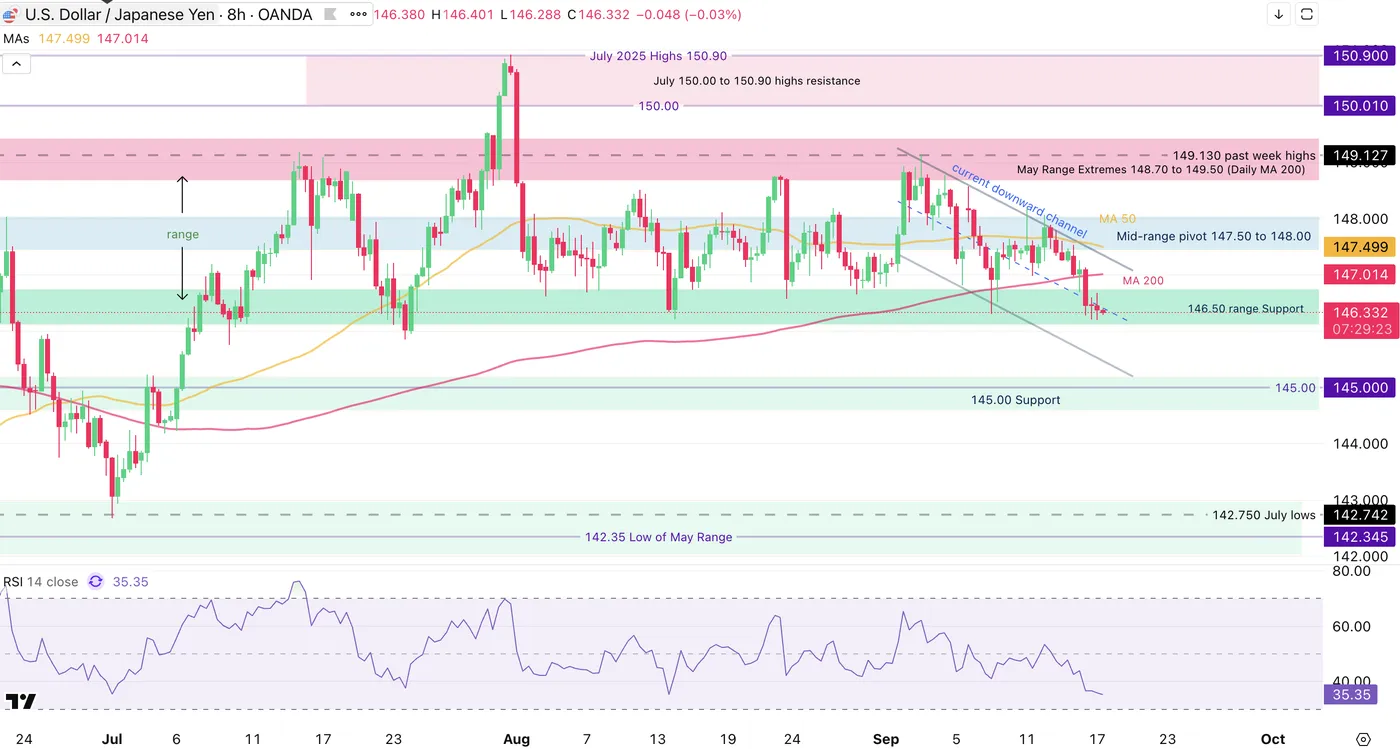
USDJPY 8H Chart, September 17, 2025, Source: TradingView
You can access an in-depth USDJPY analysis right here, released earlier today!
Levels to watch for USDJPY:
Resistance Levels
- Mid-range pivot 147.50 to 148.00
- May Range Extremes 148.70 to 149.50
- 150.00 psychological resistance
- 150.90 July highs
Support Levels
- 146.50 range support (testing)
- 145.00 psychological support
- 142.35 low of the May range, main support
AUDUSD – A sharp rebound from the prior week selloff
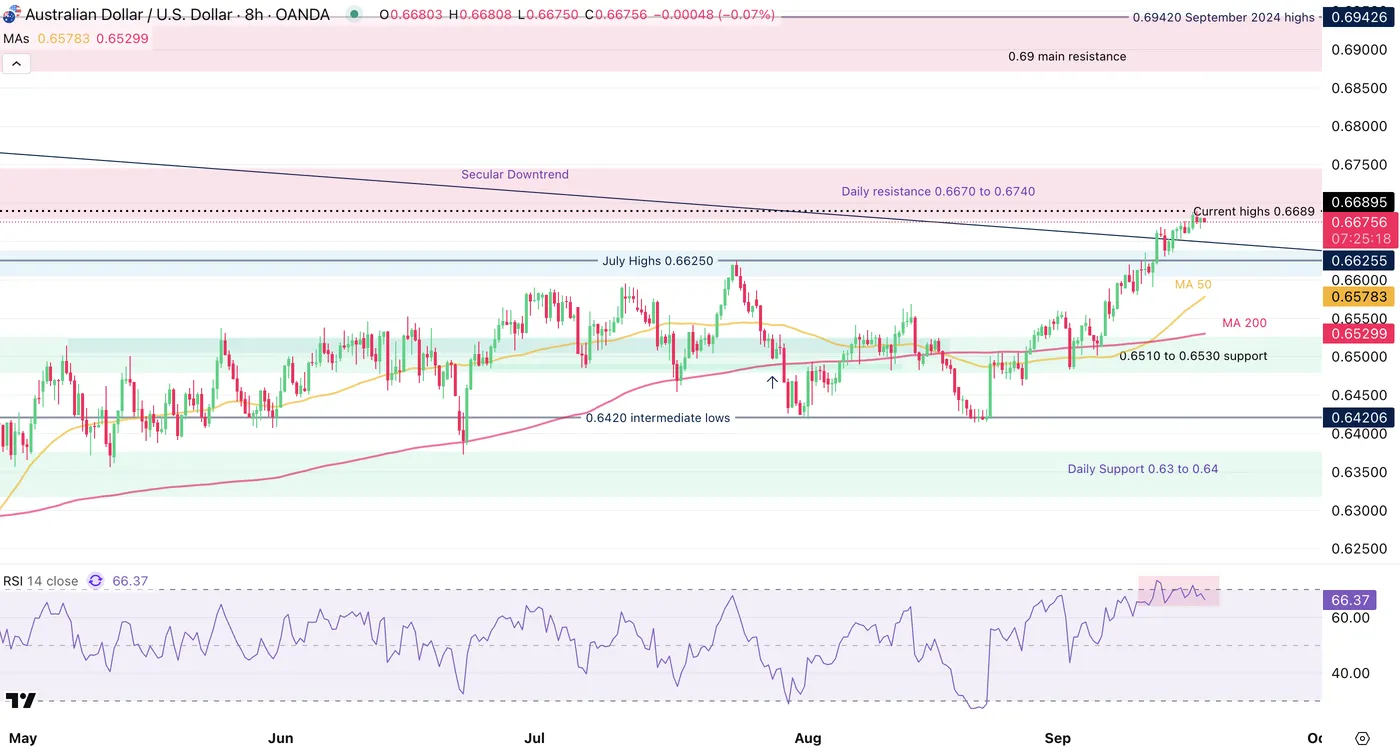
AUDUSD 8H Chart, September 17, 2025, Source: TradingView
AUDUSD Trading Levels:
Resistance Levels
- US CPI highs 0.6690 (2025 highs)
- Daily resistance 0.6670 to 0.6740
- 0.69 zone main resistance (+/- 150 pips)
Support Levels
- July Highs 0.66250 (+/- 100 pips) acting as key pivot and support
- 0.6510 to 0.6530 support (confluence with 50-day MA)
- 0.6420 August 22, 2025 lows (pre-Jackson Hole conference)
- Daily Support 0.63 to 0.64
EURUSD 8H Chart and levels
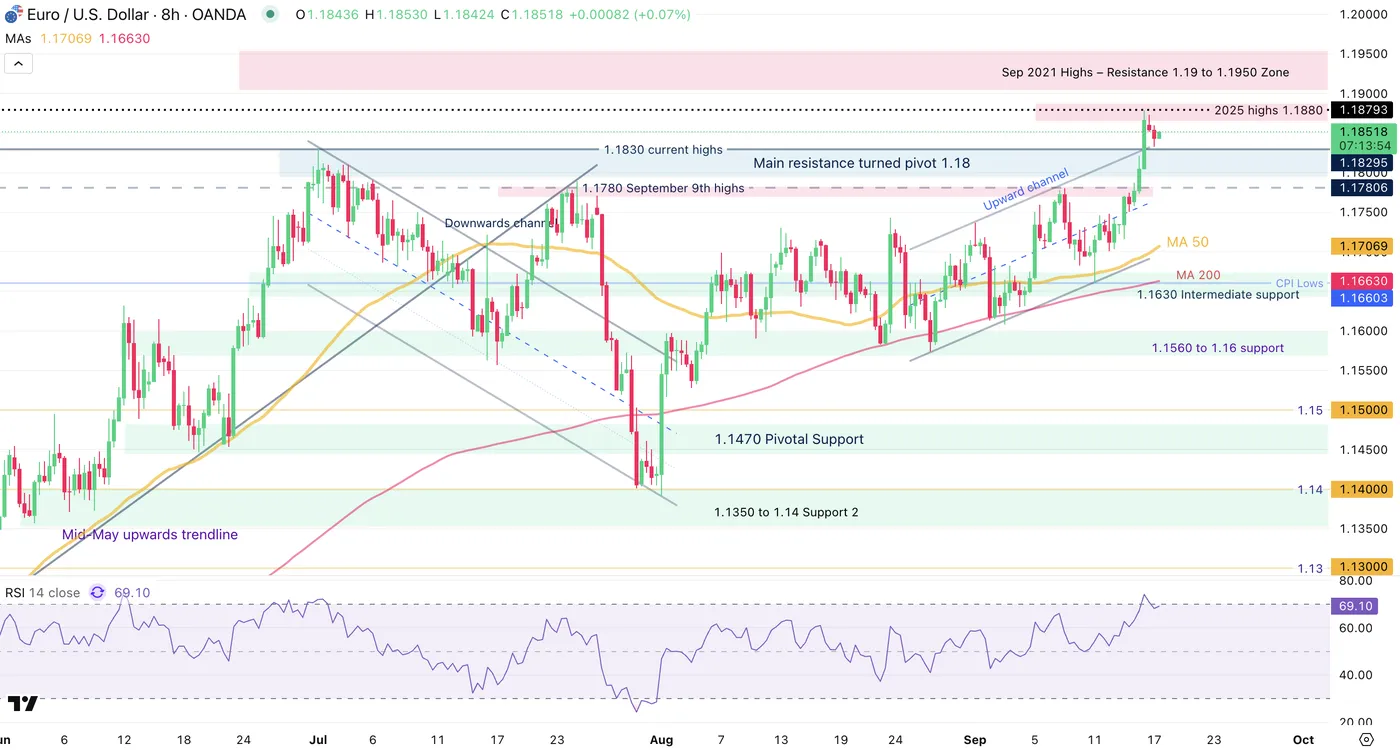
EURUSD 8H Chart, September 17, 2025, Source: TradingView
Levels to watch for EURUSD:
Resistance Levels:
- 2025 highs 1.1880
- Main resistance turned pivot 1.18 to 1.1830 (yearly highs)
- 1.20 psychological level and 2021 highs
Support Levels:
- 1.1750 Intermediate Pivot (+/- 150 pips)
- 1.1650 Key support
- 1.16 Main support
- 1.1470 Pivotal Support (bearish below this)
The Swissie regains some strength – USDCHF
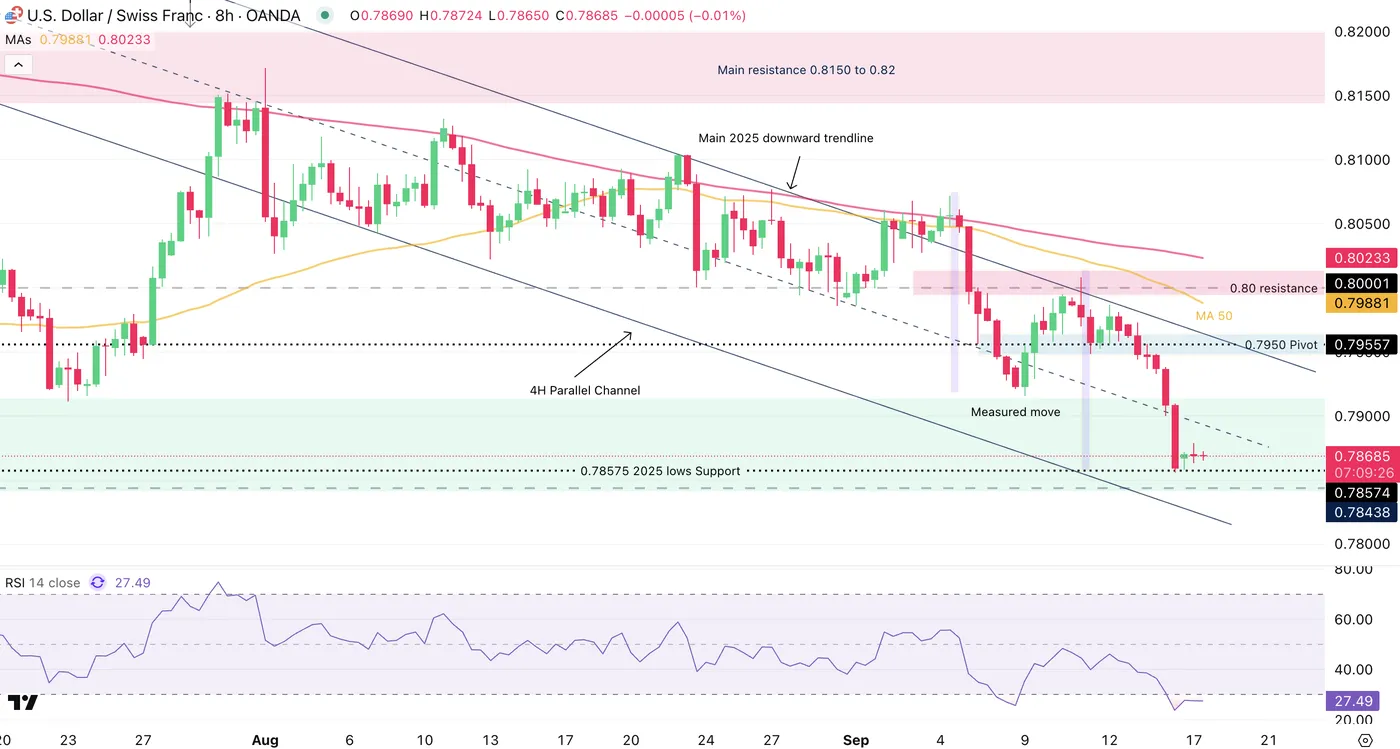
USDCHF 4H Chart, September 17, 2025, Source: TradingView
Here is our latest in-depth analysis of the USDCHF (from yesterday) that was published as things were moving aggressively. Despite new lows being reached, the analysis is still valid!
Levels to watch for USDCHF:
Resistance Levels
- 0.7950 Key pivot
- Long-term pivot 0.80 Zone (0.80 to 0.8010)
- Main resistance 0.8150 to 0.82 (last highs 0.8165)
- May 2025 highs 0.8475 Resistance Zone
Support Levels
- 0.78575 2025 lows Support
- 0.77 to 0.7735 August 2011 lows
- 0.76 Psychological level
The Pound is back on track – GBPUSD
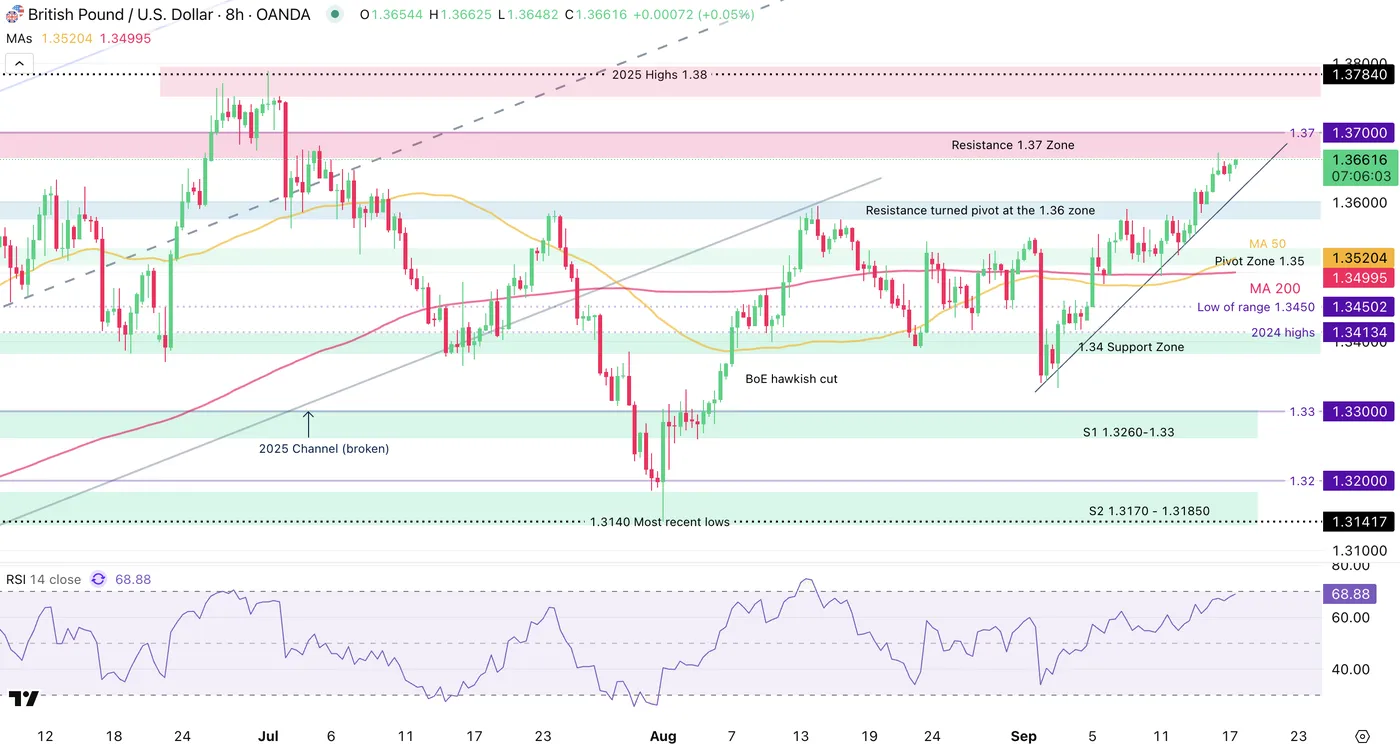
GBPUSD 8H Chart, September 17, 2025, Source: TradingView
Levels to watch for GBPUSD:
Resistance Levels
- 2025 precise high 1.3788
- 2025 Highs resistance 1.3760 to 1.38
- Resistance 1.37 Zone (immediate resistance)
Support Levels
- Resistance turned pivot at the 1.36 zone
- Support Zone 1.35
- 1.34 Support Zone
USDCAD (Subject to change with ongoing Bank of Canada decision, Cut by 25 bps)
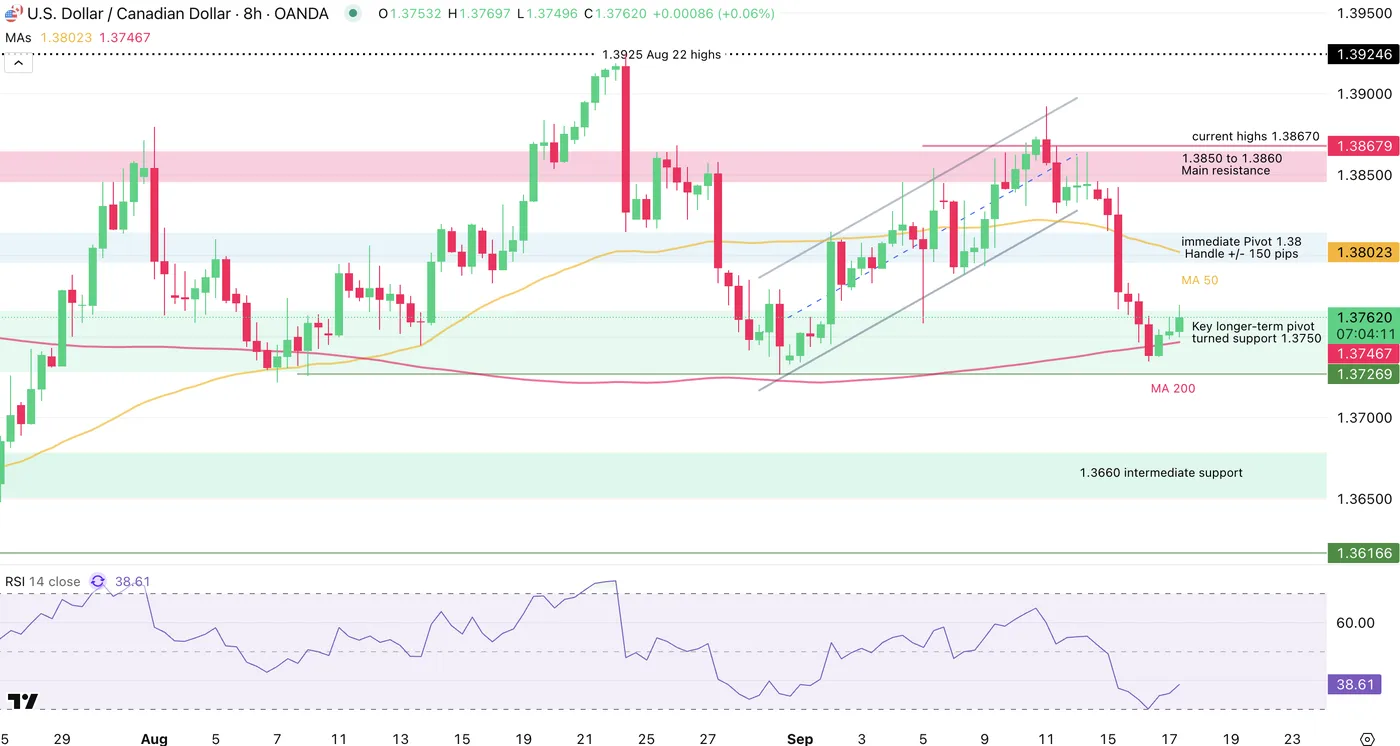
USDCAD 8H Chart, September 17, 2025, Source: TradingView
An update to the chart will be presented in an upcoming piece: Mid-Week NA Markets update with a detailed USDCAD analysis inside. Here is the BoC statement.
Levels to watch for USDCAD:
Resistance Levels
- 1.38 Handle +/- 150 pips
- 1.3850 to 1.3860 Main resistance
- 1.3925 Aug 22 highs
Support Levels
- Key longer-term pivot turned support 1.3750 (currently testing)
- 1.3660 intermediate support
- 1.3550 Main 2025 Support
Safe Trades as the FOMC approaches!