
 has rallied as expected and almost hit the first medium-term resistance of 50,090/50,220 highlighted in our previous publication. It printed a fresh all-time intraday high of 49,970 on 21 October 2025, on the backdrop of the newly appointed Japanese Prime Minister Takaichi’s plan for implementing an expansionary stimulus package that is likely to be more than 13.9 trillion yen that centered on measures to counter inflation, investment in growth industries, and national security.)
Key takeaways
- Japan 225 CFD Index rally: The Japan 225 CFD Index (Nikkei 225 proxy) reached an all-time high of 49,970 on optimism over PM Takaichi’s more than ¥13.9 trillion expansionary stimulus plan.
- Market pullback: The index declined 3.4% from its peak, suggesting investors had already priced in expectations of aggressive fiscal measures.
- Earnings momentum: Forward 12-month EPS growth for Nikkei 225 stocks rose to 9.3% in October from 7% in September, signaling an improving corporate outlook.
- Foreign inflows strengthen: Net foreign purchases of Japanese equities surged sharply, reinforcing continued medium-term bullish momentum for Japan’s equity market.
The Japan 225 CFD Index (a proxy of the Nikkei 225 futures) has rallied as expected and almost hit the first medium-term resistance of 50,090/50,220 highlighted in our previous publication. It printed a fresh all-time intraday high of 49,970 on 21 October 2025, on the backdrop of the newly appointed Japanese Prime Minister Takaichi’s plan for implementing an expansionary stimulus package that is likely to be more than 13.9 trillion yen that centered on measures to counter inflation, investment in growth industries, and national security.
However, the Japanese stock market appears to have already priced in expectations of an aggressive expansionary fiscal policy, as hinted in Prime Minister Takaichi’s previous speeches. The Japan 225 CFD Index has since declined by 3.4% from its all-time high on 21 October 2025, hitting an intraday low of 48,415 on Thursday, 23 October 2025.
This raises an important question, is the medium-term uptrend that has been in place since April 2025 at risk of reversing, given the potential for rising longer-term Japanese Government Bond (JGB) yields amid concerns over a widening fiscal deficit from Takaichi’s policy stance?
Fundamental, flow, and momentum factors are still supportive for a further potential progression of the ongoing medium-term uptrend phase for the Japan 225 CFD Index. Let’s examine each of them.
Nikkei 225 forward earnings growth has picked up
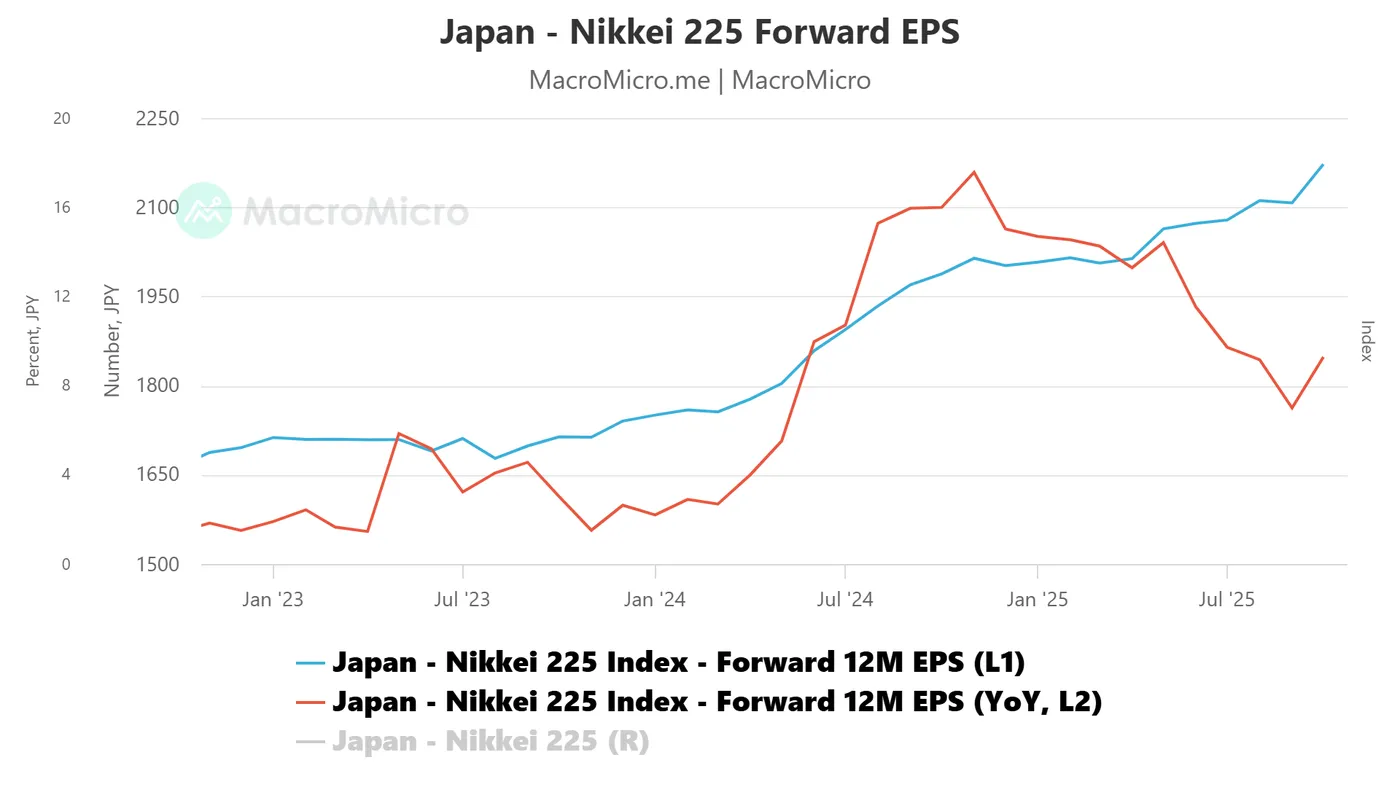
Fig. 1: Nikkei 225 forward 12-month forward EPS growth as of 23 Oct 2025 (Source: MacroMicro)
The forward 12-month earnings per share (EPS) growth for the component stocks of the Nikkei 225 in aggregate has started to improve after a slowdown in the past 11 months. The forward EPS growth of the Nikkei 225 has recently increased to 9.3% year-on-year in October 2025 from 7% in September 2025 (see Fig.1).
This earnings growth uptick suggests that more sell-side analysts have raised earnings projections for the Nikkei 225 for Q3 earnings results that may propel the Nikkei 225 higher.
Net foreign inflows into the Japanese stock market have increased significantly
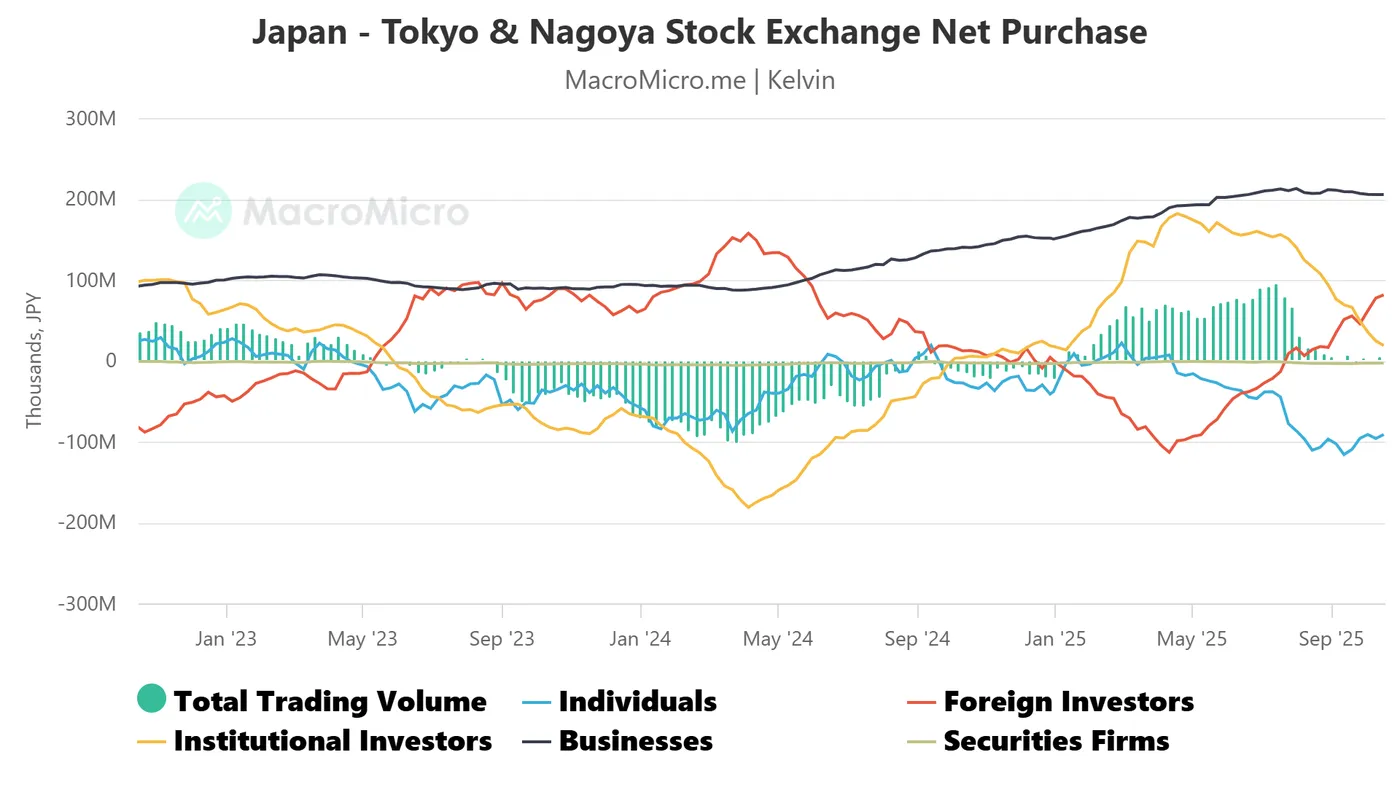
Fig. 2: Net purchases of Tokyo & Nagoya stock exchanges as of 17 Oct 2025 (Source: MacroMicro)
The 52-week average of net purchases of Japanese equities listed on the Tokyo and Nagoya stock exchanges has jumped by a significant amount from 6.2 billion in the week of 8 August 2025 to 81.5 billion as of 17 October 2025 (see Fig. 2).
We shall focus on the short-term (1 to 3 days) trajectory, key elements, and key levels to watch on the Japan 225 CFD Index from a technical analysis/momentum perspective.
Preferred trend bias (1-3 days) – Oscillating within minor & medium-term ascending channels
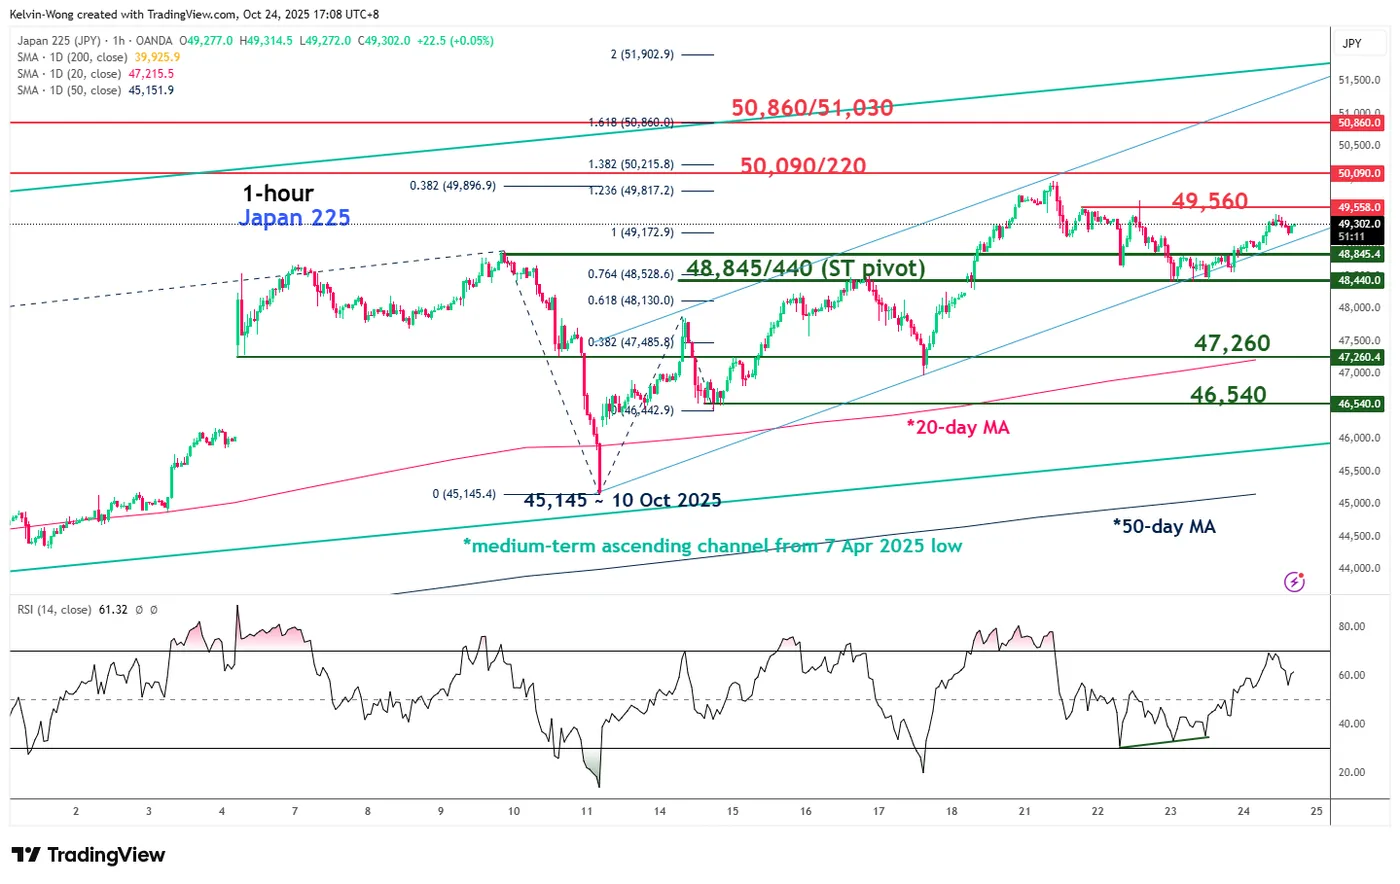
Fig. 3: Japan 225 CFD Index minor trend as of 24 Oct 2025 (Source: MacroMicro)
Maintain bullish bias with 48,845/48,440 as key short-term pivotal support for the Japan 225 CFD Index. A clearance above 49,560 key near-term resistance (upside trigger) opens up scope for the next resistances to come in at 50,090/50,220 and 50,860/51,030 (Fibonacci extension cluster) (see Fig. 3).
Key elements
- Since the key minor swing low of 45,145 on 10 October 2025, induced by US President Trump’s “China trade tariffs bashing”, the price actions of the Japan 225 have been oscillating within a minor ascending channel.
- The hourly RSI momentum indicator of the Japan 225 CFD Index has continued to show a bullish momentum condition since its bullish divergence signal on Wednesday, 22 October 2025.
Alternative trend bias (1 to 3 days)
A break below the 48,845/48,440 key short-term support negates the bullish tone for another extension of the minor corrective decline towards the next intermediate support at 47,260 (also the 20-day moving average).