
After yesterday’s 1.7% rally, many participants believed that the bottom was finally in for Oil—and for good reason.
Exxon (XOM) shares surged to 2025 highs, while a series of headlines about India and other major buyers of Russian oil reinforced strong fundamentals to the fakeout.
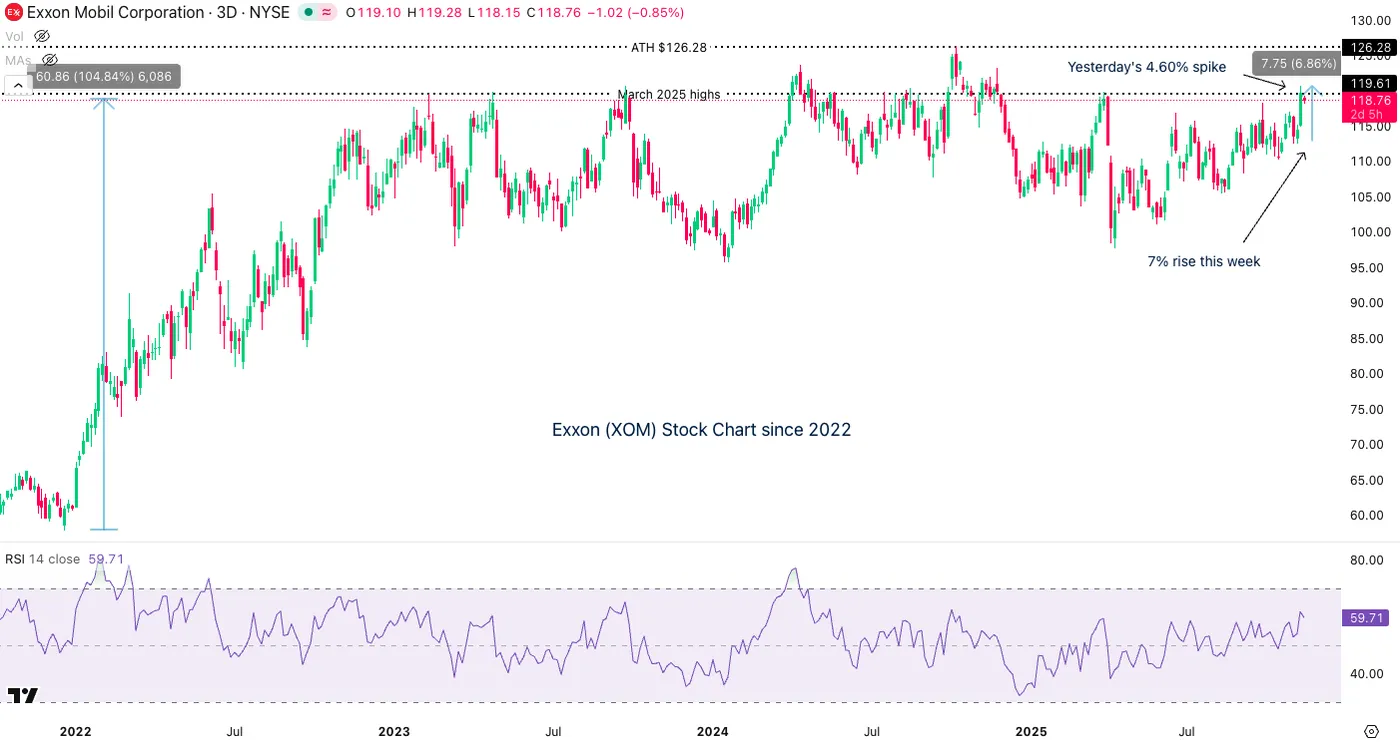
Exxon (XOM) 3-Day Chart, November 12, 2025 – Source: TradingView
But that would hardly fit this year’s pattern for Oil, which has preferred to zig-zag in a cloud of pricing confusion.
As discussed in last month’s Oil analysis, almost every price pop has been followed by a sharp correction, resulting in a rangebound-but-downtrending market.
The latest catalyst came from the Monthly OPEC report released this morning. It highlighted high US strategic reserves, sluggish Chinese growth, and persistent oversupply from nations funding their conflicts—such as Russia and Iran.
The report offers a mine (pun intended) of insightful charts and is worth even a quick glance – You can access it right here.
This dynamic may extend across the energy complex, as other commodities have stalled since the 2022 price spikes, plateauing through much of this year.
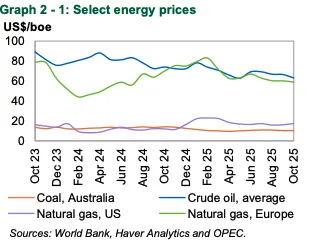
Trends in Energy Commodities throughout the year, November 12, 2025 – Source: OPEC
OPEC+’s internal rivalries only add to the pressure, with member states competing for market share while the major producers continue to flood the market amid elevated supply regimes.
Let’s dive in our multi-timeframe analysis for WTI Oil.
US Oil multi-timeframe analysis
Daily Chart
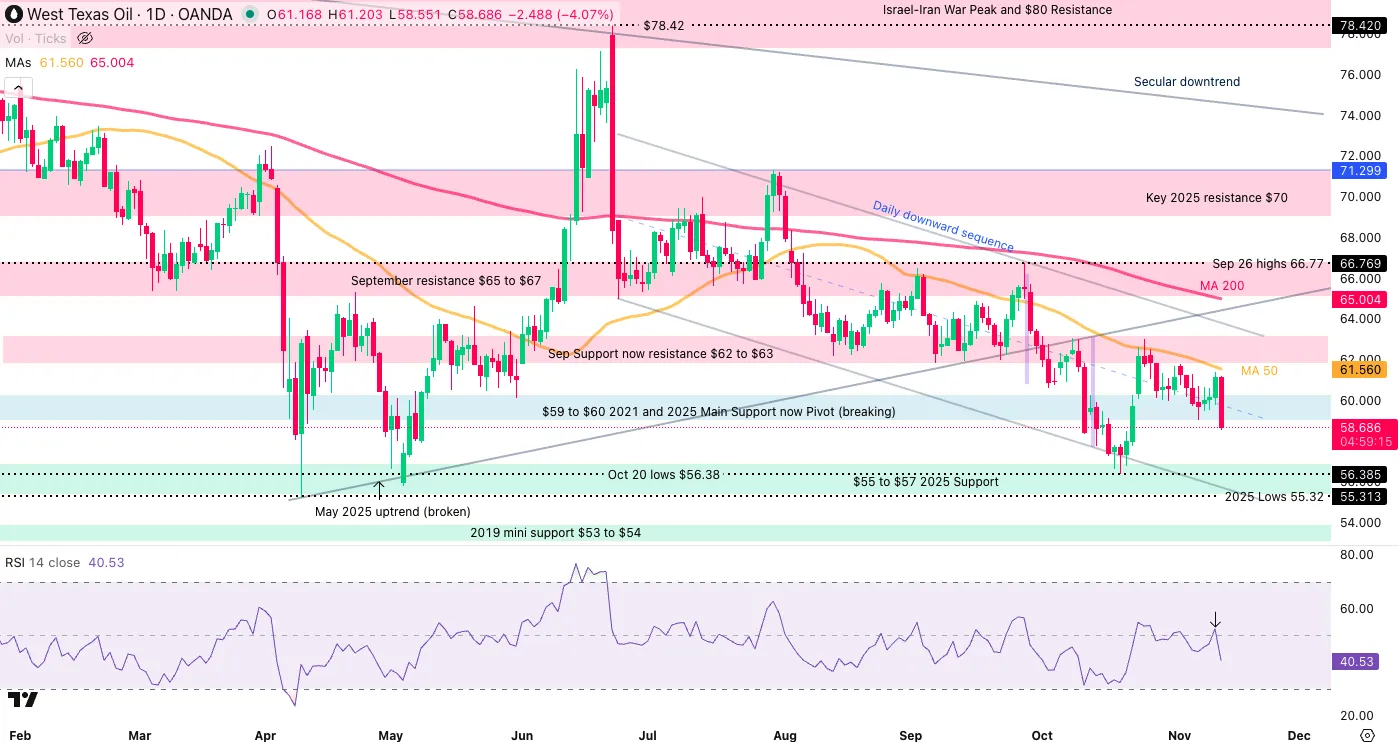
US Oil (WTI) Daily Chart, November 12, 2025 – Source: TradingView
Still evolving in a key downward channel, Oil has been contained by its 50-Day moving average throughout the past week and really stands out as the key technical indicator to watch.
Breaking below its $59 to $60 support yet again, there isn’t much to restrain prices from re0-entering the 2025 low support region between $55 to $57.
The lows of the channel is a level to keep in mind at around $55.70 which would come very close to the Liberation Day lows.
As long as prices fail to break and close above the 50-Day MA, the downtrend has more probabilities to hold.
4H Chart and levels
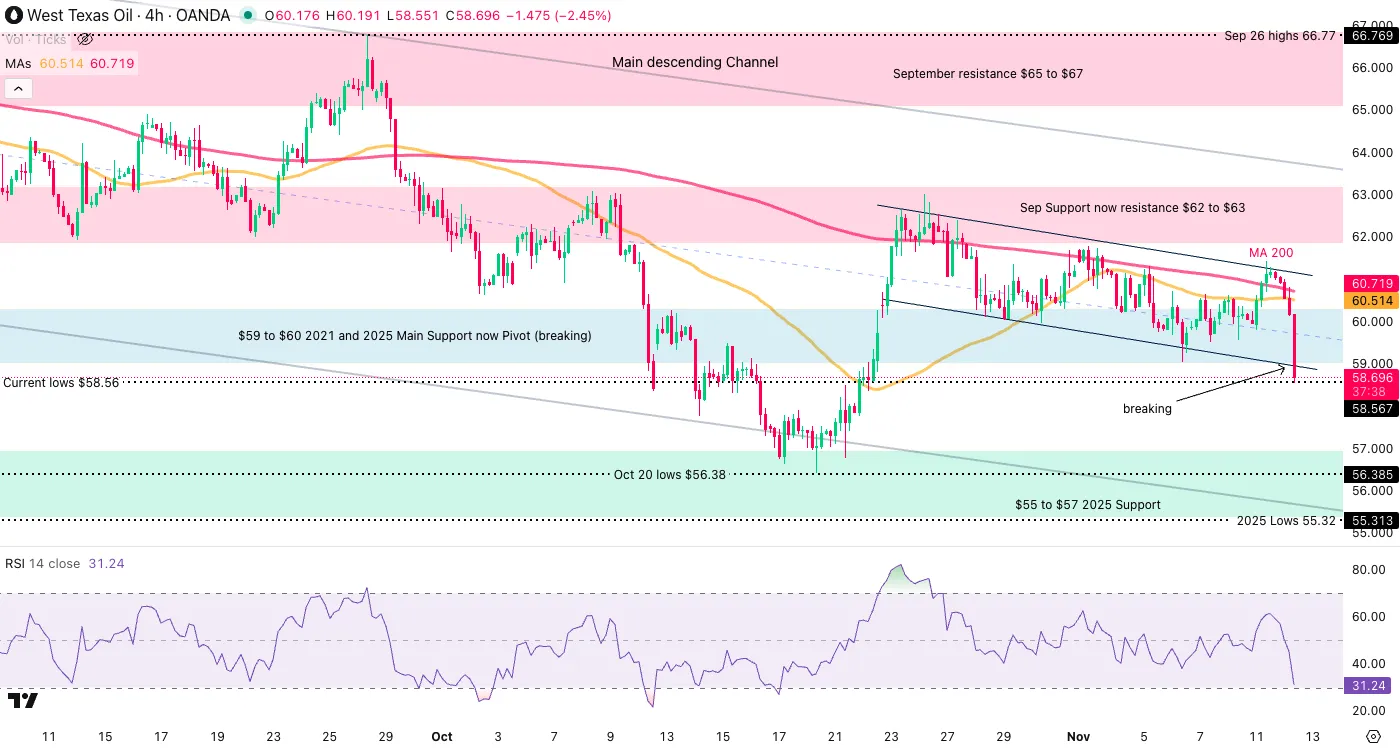
US Oil (WTI) 4H Chart, November 12, 2025 – Source: TradingView
Levels to place on your WTI charts:
Resistance Levels
- Key September Resistance $65 to $66
- Sep Support now resistance $62 to $63
- $61.50 50-Day MA
- $59 to $60 2021 Support now Pivot (breaking)
Support Levels
- $55 to $57 2025 Support
- Oct 20 lows $56.38
- $55.70 channel lows
- Current lows $58.56
1H Chart
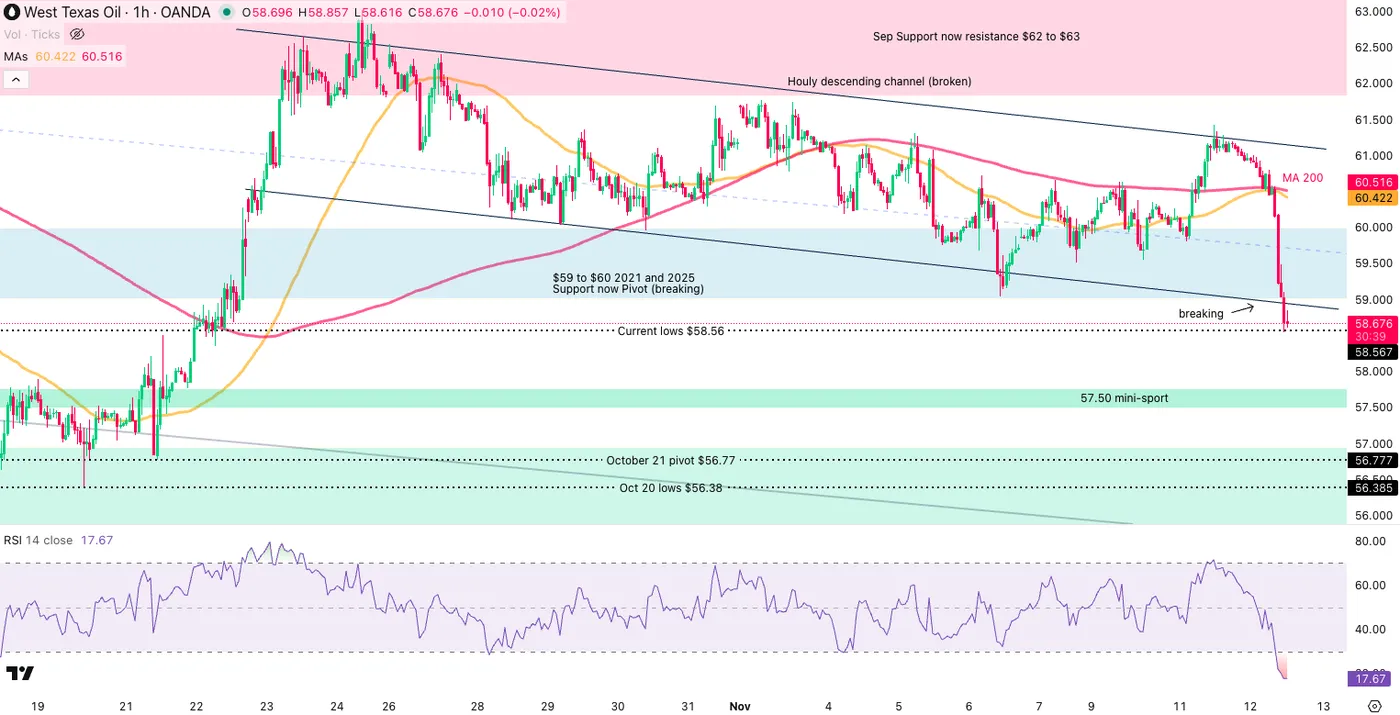
US Oil (WTI) 1H Chart, November 12, 2025 – Source: TradingView
The 1H picture shows one of bear dominance in this morning of price action which even led to the breakdown of this week’s fresh Downward hourly channel.
Still, the 1H RSI is oversold, which is slowing the current fall.
A daily Close below hints at further downside, while a return within keeps a more balanced-bearish outlook.
Expect more volatility looking forward and keep an eye on geopolitical headlines.
Safe Trades!


