
Looking at the crypto market today, the outlook is grim. Bitcoin has lost nearly 50% of its value since that peak, total market capitalization has fallen back to Trump re-election levels, and major altcoins such as Solana have corrected by as much as 70% or more.
What goes up — especially when it goes up too fast — must eventually come down.
Current flows are eerily reminiscent of the November 2021 tech and crypto meltdown, making that period worth revisiting.
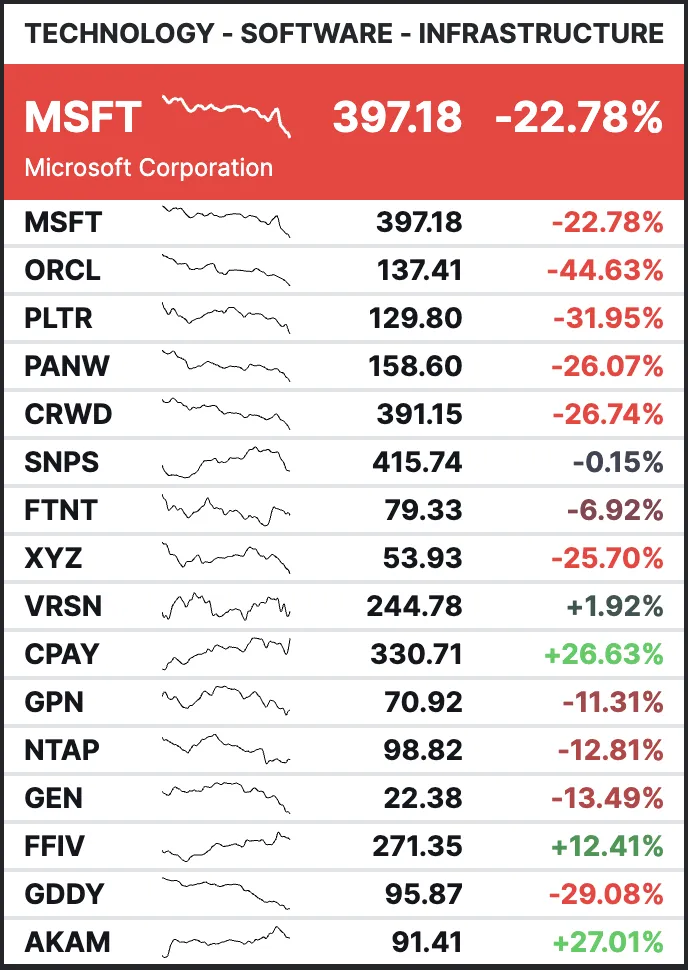
Tech Sector 3-month performance – Courtesy of Finviz. February 5, 2026
At the time, Bitcoin had surged from its $3,800 COVID lows to $69,000 in roughly a year and a half, topping in November 2021 before collapsing nearly 80% to around $15,800 — a move that felt like the end of the world.
Total crypto market cap fell from just over $3 trillion to roughly $736 billion during that drawdown.
That decline was accompanied by a series of brutal headlines, including the Terra/Luna collapse and the eventual FTX blow-up in 2022.
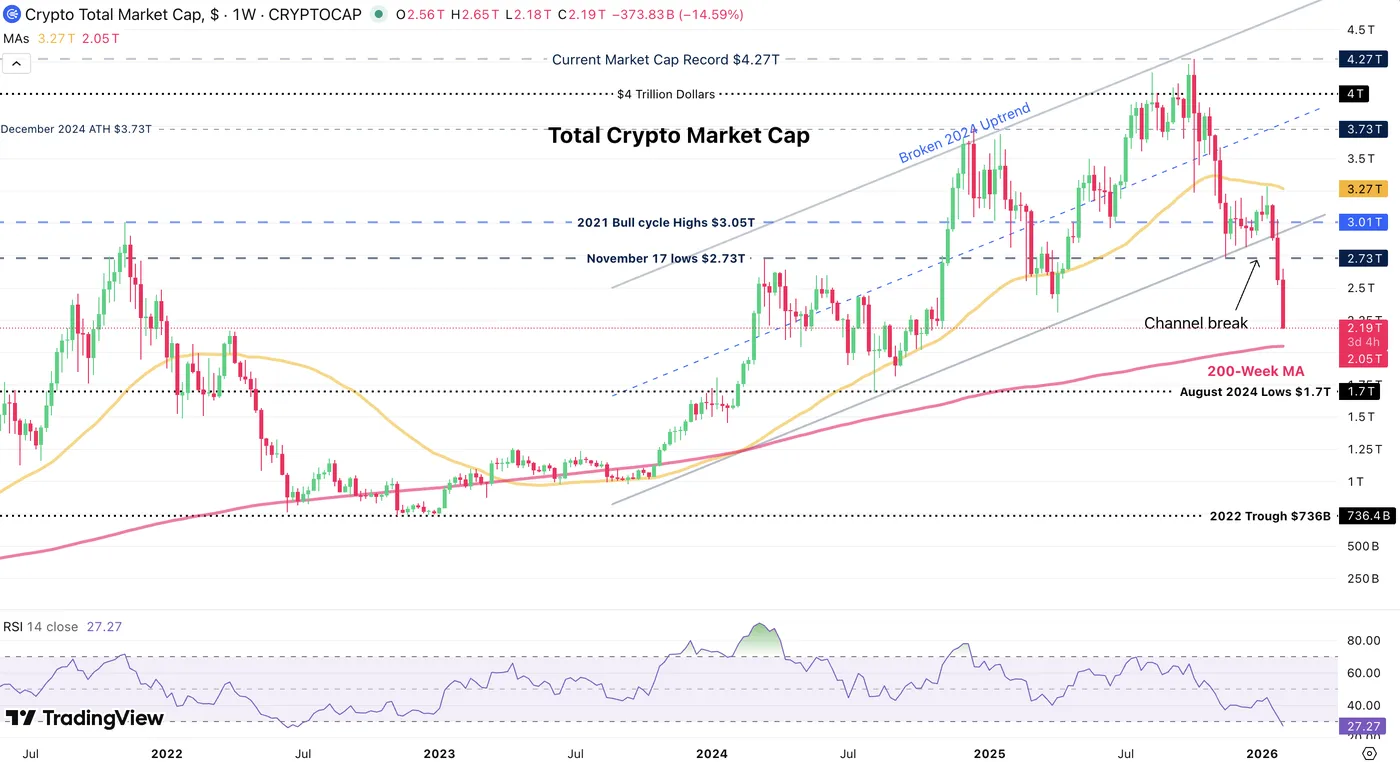
Total Crypto Market Cap, February 2026 – Source: TradingView
Since then, Bitcoin staged an impressive sixfold rally from its November 2022 lows.
Aside from the brief Liberation Day sweep toward $75,000, the market barely retraced — and it is now paying the hefty price.
A 70% decline from the $126,400 record high would bring Bitcoin back toward the $30,000 area – That may sound extreme from today’s levels, but in crypto, nothing is impossible. Extreme volatility is part of the asset class’s DNA, on both the upside and the downside.
Before diving into a deeper analysis of the father of cryptocurrencies, it’s worth remembering that these drawdowns are exactly what markets do best.
They create stories, hope, and spectacular trends — but also nightmares, grief, and collapses. Bubbles are nothing new, and while markets evolve from them, they rarely learn. They simply reflect humanity’s purest forms of exuberance and despair.
The key risk now is whether these declines spill over into other asset classes and trigger cascading effects. But it isn’t only about fear. Historically, assets that lose more than 50% of their value can become attractive accumulation candidates — often more so than buying at full price. Still, catching falling knives is dangerous, and many fortunes have been lost trying.
Plan carefully, scale in progressively, and always spread your risk.
Let’s explore some key levels of interest from Weekly to Daily charts and trading levels for Bitcoin (BTC) to spot where the current drop could hold (and potentially reverse, even if the mood doesn’t corroborate much with this idea).
Bloodshed in the Crypto Market
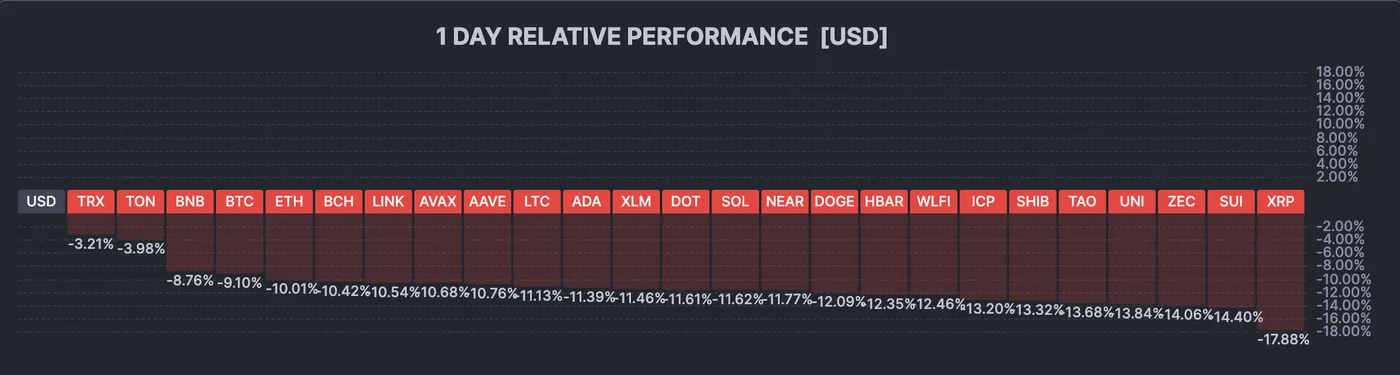
Daily overview of the Crypto Market, February 5, 2026 – Source: Finviz
The daily drops are staggering.
The selloffs have been accelerating in the past few minutes with Ethereum reaching $1,860 and XRP at $1.18 which could prompt short-term buyings of dip.
Still, be careful with falling knives!
Bitcoin multi-timeframe technical analysis
Weekly Chart
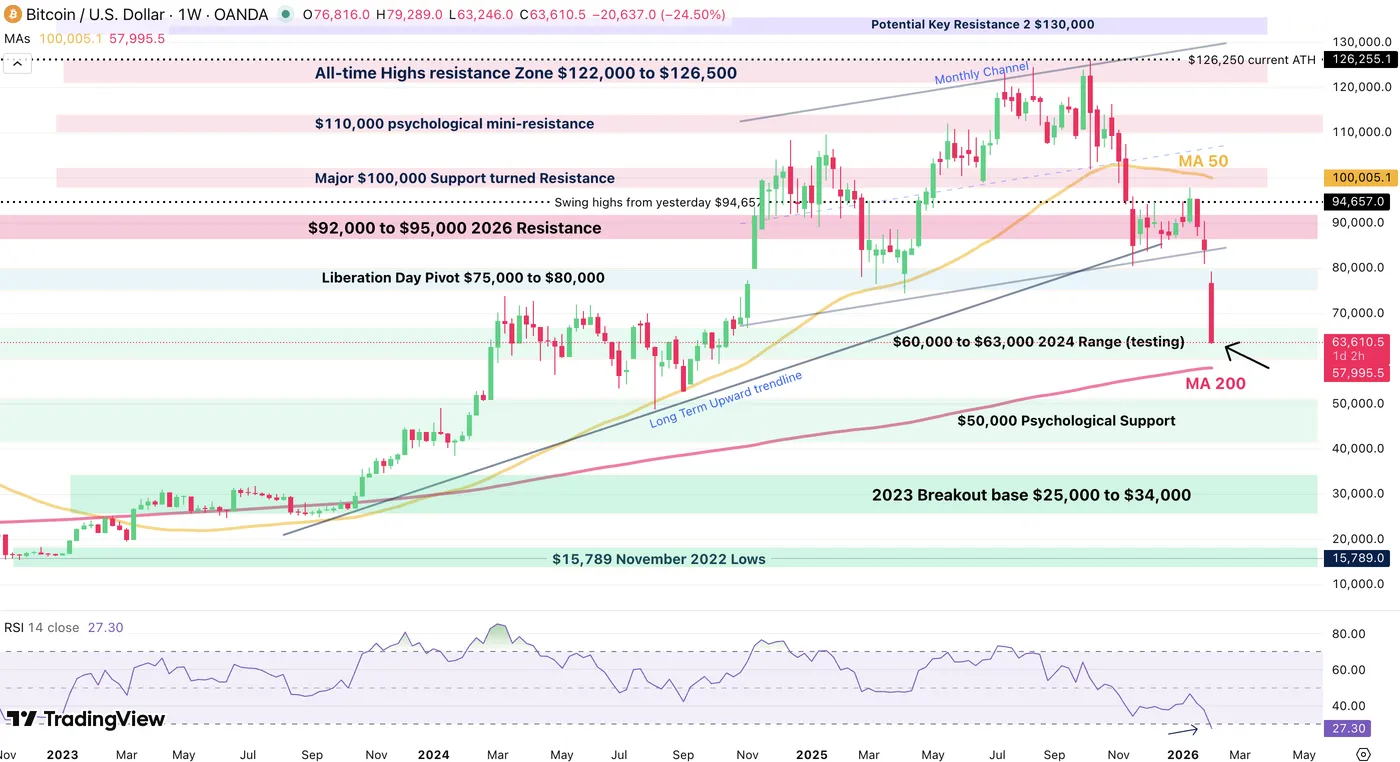
Bitcoin Weekly Chart, February 5, 2026 – Source: TradingView
With the fast-paced acceleration, Bitcoin is now dropping back to the $63,000 Major Support (which extends to $60,000), key level which served as the basis of the 2024 breakout.
The weekly candle is an ugly one.
If this extends further, it will be interesting to see how traders react to the 200-Week Moving average at $58,000. Let’s take a closer look to see where we stand and spot for potential troughs.
Daily Chart and Technical Levels
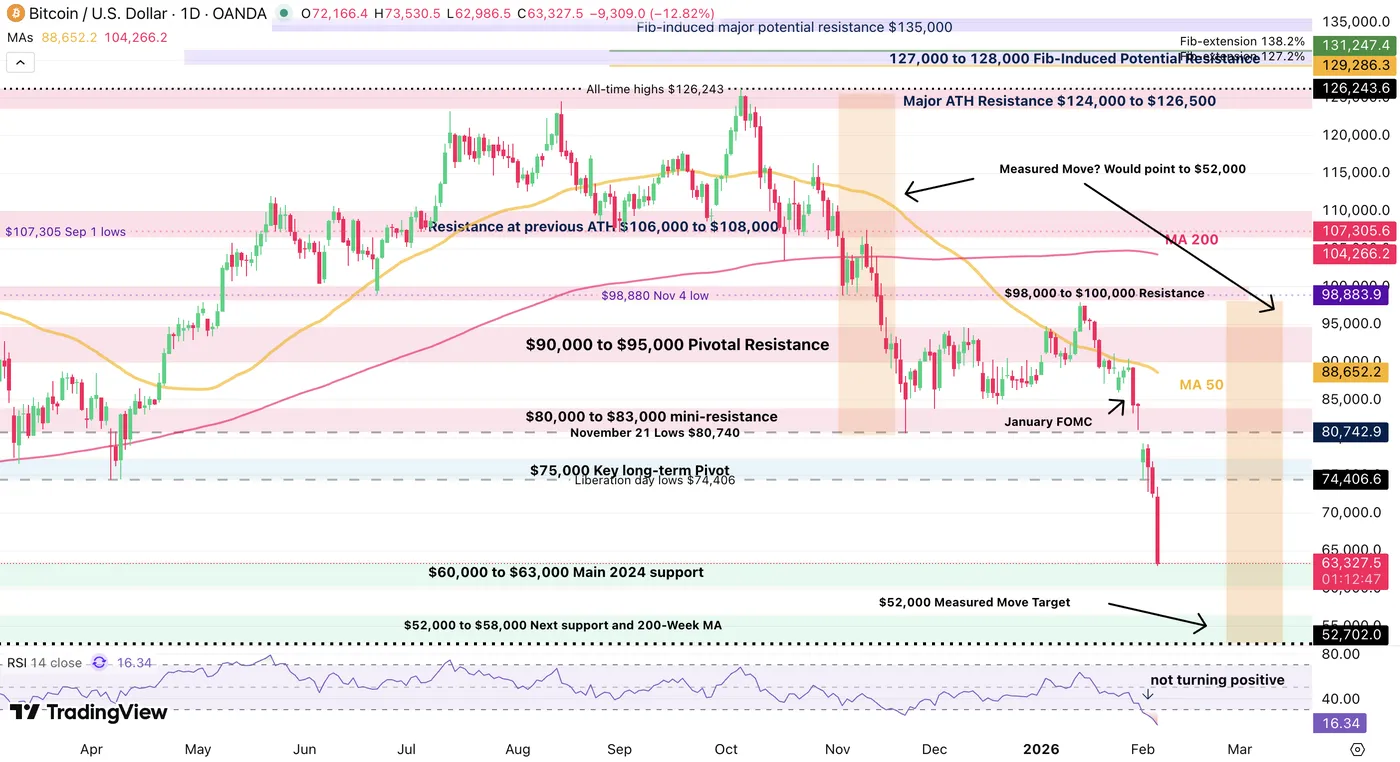
Bitcoin Daily Chart, February 5, 2026 – Source: TradingView
With the daily run, it would be surprising to see the action continue much further in a straight line – However, the fragile market conditions wouldn’t warrant an immediate bottom.
Keep a close look to immediate reactions between $60,000 to $63,000 as the session closes back to pre-breakout levels.
A striking Measured Move pattern could also be developing and seems like a decent target for such a drop.
Taking the October to November 2025 drop gives the base, which extends to $52,000, an interesting level for dip-buying if we get there.
Of course, investors will want to be extremely careful with themes around Markets as we keep correcting.
What starts with liquidations could easily turn into a larger disaster and contribute to even more extreme moves around Markets.
Levels of interest for BTC trading:
Support Levels:
- $60,000 to $63,000 Main 2024 support (immediate test)
- $52,000 to $58,000 Next support and 200-Week MA
- $2023 Breakout base $25,000 to $34,000
Resistance Levels:
- $75,000 Key long-term Pivot
- $80,000 to $83,000 mini-resistance
- $90,000 to $95,000 Pivotal Resistance
- Current all-time high $126,250
Safe Trades!