
The US Dollar has been on a significant run since the beginning of the US-Iran-Israel war, quickly breaching its prior 2026 records.
When the night falls, the wolves step out – Dollar bears had dominated the narrative since early 2025 and have kept insisting on a weaker dollar despite largely rangebound action since July.
This bearishness had largely been covered throughout our previous Dollar analyses and reached a peak after the recent Bank of America’s Fund Manager survey.
When the Market is short and a catalyst for shortage lands, it leads to explosive moves, and that’s precisely what happened with the USD.
The US-Iran war sparked a swift need for dollars to protect against currency volatility, particularly to purchase oil at a much higher price. Hence, firms and institutions require dollar hedging to defend against a double-edged squeeze.
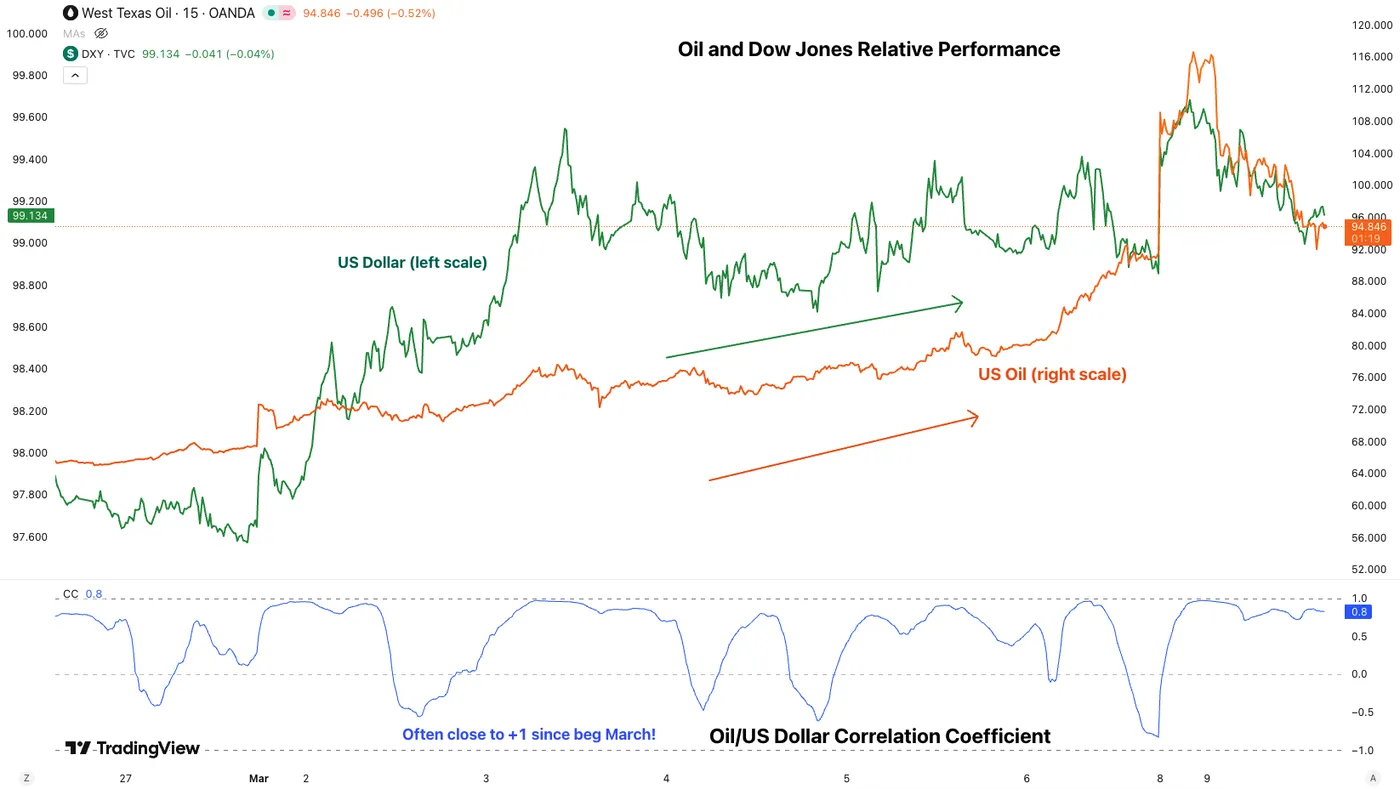
Source: TradingView
This added to the Momentum throughout last week’s Globex Open and this week’s spike.
In case you missed the historic moves, WTI and Brent Oil prices have moved 25% on both sides throughout the overnight and morning session and are now settling closer to $95 as G7 nations expressed a desire to control the situation by releasing strategic reserves, as Maritime traffic near the Strait of Hormuz slowly picks up again.
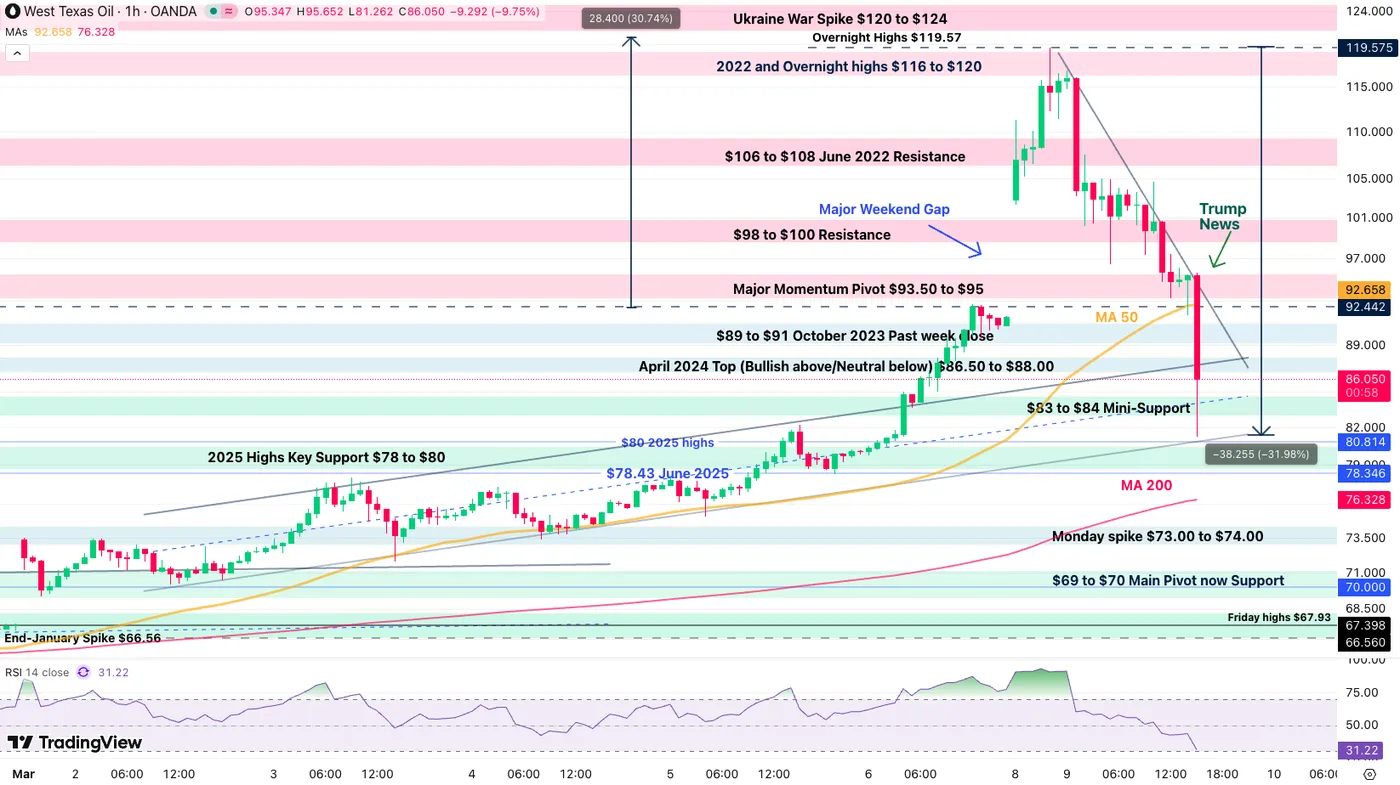
WTI (US) Oil 1H Chart – March 9, 2026. Source: TradingView
Note: Things just took an unexpected turn as I just posted this chart, Oil gapped lower to $83 – Remaining below $85 would bring back sellers in control, but tomorrow’s close will be necessary; Expect volatility to remain high before that.
We will look at the Dollar Index, EUR/USD, and AUD/USD to assess the current state of the Market and whether more upside is warranted for the Dollar after its Market-sweeping rises.
Dollar Index 1H Chart
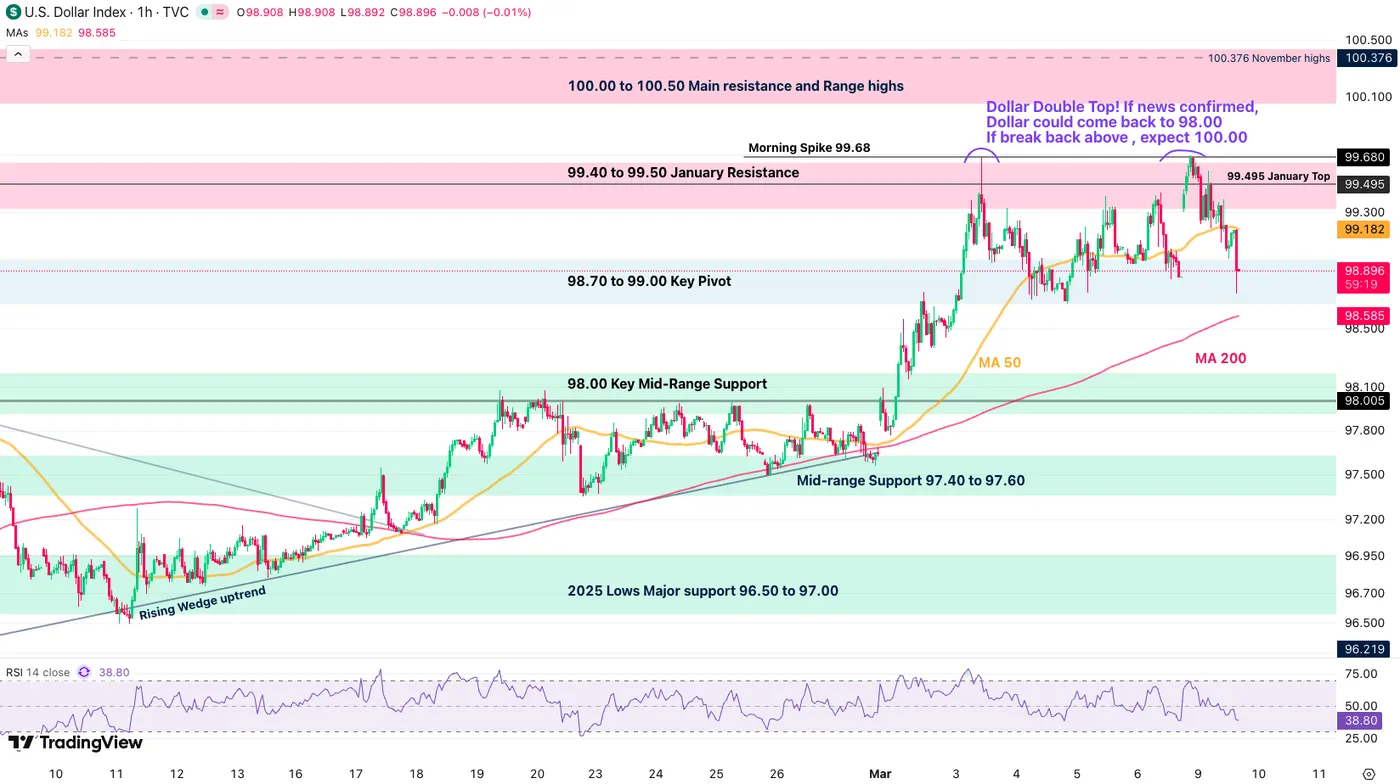
Dollar Index 1H Chart, March 9, 2026 – Source: TradingView
The US Dollar just took a swift turn lower after the Market shaking Trump announcement.
The overnight/morning action now points towards a clear double-top, pointing at a drop back towards 98.00, however, the 200-Hour MA (98.56) could act as support, so a rebound there will have to be monitored!
Three levels are to be watched:
- The 98.56 200-Hour MA – Bouncing from here would maintain the rangebound picture in the Dollar (which would invite to trade ranges in related USD Pairs)
Breaking the level lower points to:
- 98.00 – The pre-War resistance. As long as prices remain above this level, the outlook for the Dollar is neutral and could still see a grind back towards 99.00
- Morning highs: 99.70 – Breaking back above would imply further chaos in the Middle East, hence, could see a breakout back towards November highs at 100.376.
Levels of interest for the Dollar Index:
Resistance Levels
- Morning Spike 99.70 and Double Top
- 99.40 to 99.50 January Resistance
- 100.00 to 100.50 Main Resistance Zone
- 100.376 November highs
Support Levels
- 98.70 to 99.00 Key Pivot (acting as mini-support)
- 98.56 200-Hour MA
- 98.00 Key Mid-Range Support
- December Lows 97.75
- 97.40 to 97.80 August Range Support
- 2025 Lows 96.40 to 96.80 Support
AUD/USD 4H Chart and Technical Levels
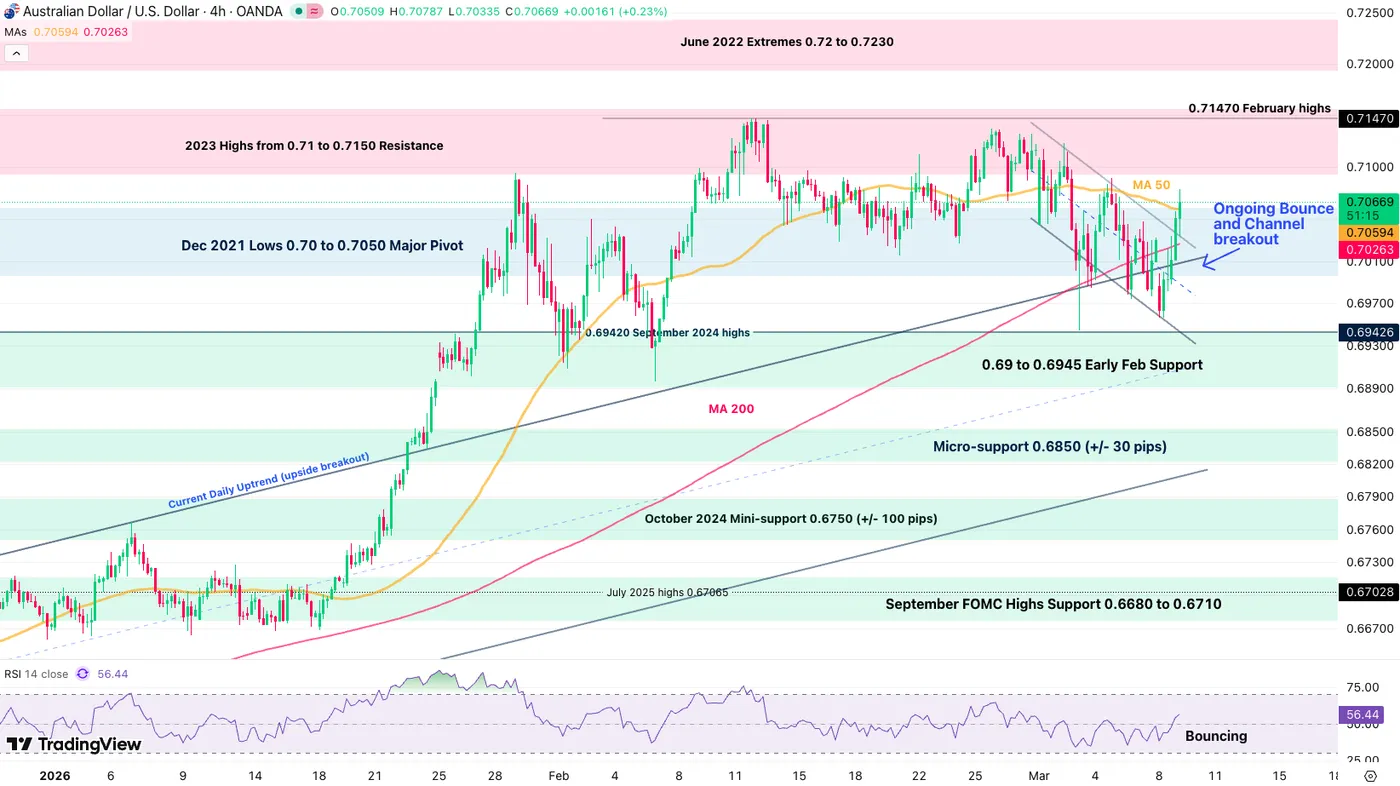
AUD/USD 4H Chart, March 9, 2026 – Source: TradingView
AUD/USD is attempting a bounce but is facing resistance at its 4H 50-period MA (0.7060) – closing above the MA in tomorrow’s session should launch it back towards the February highs (0.7140).
Levels of interest for AUD/USD:
Resistance Levels
- Immediate Resistance 4H MA 50 – 0.7060; Bullish above
- 2023 Highs from 0.71 to 0.7150 Resistance (next resistance)
- 0.71470 February highs
- June 2022 Extremes 0.72 to 0.7230
Support Levels
- 0.69566 Overnight lows
- 0.69 to 0.6945 Early Feb Support (if War drags on, could return here)
- Micro-support 0.6850 (+/- 30 pips)
- October 2024 Mini-support 0.6750 (+/- 100 pips)
EUR/USD 4H Chart and Technical Levels
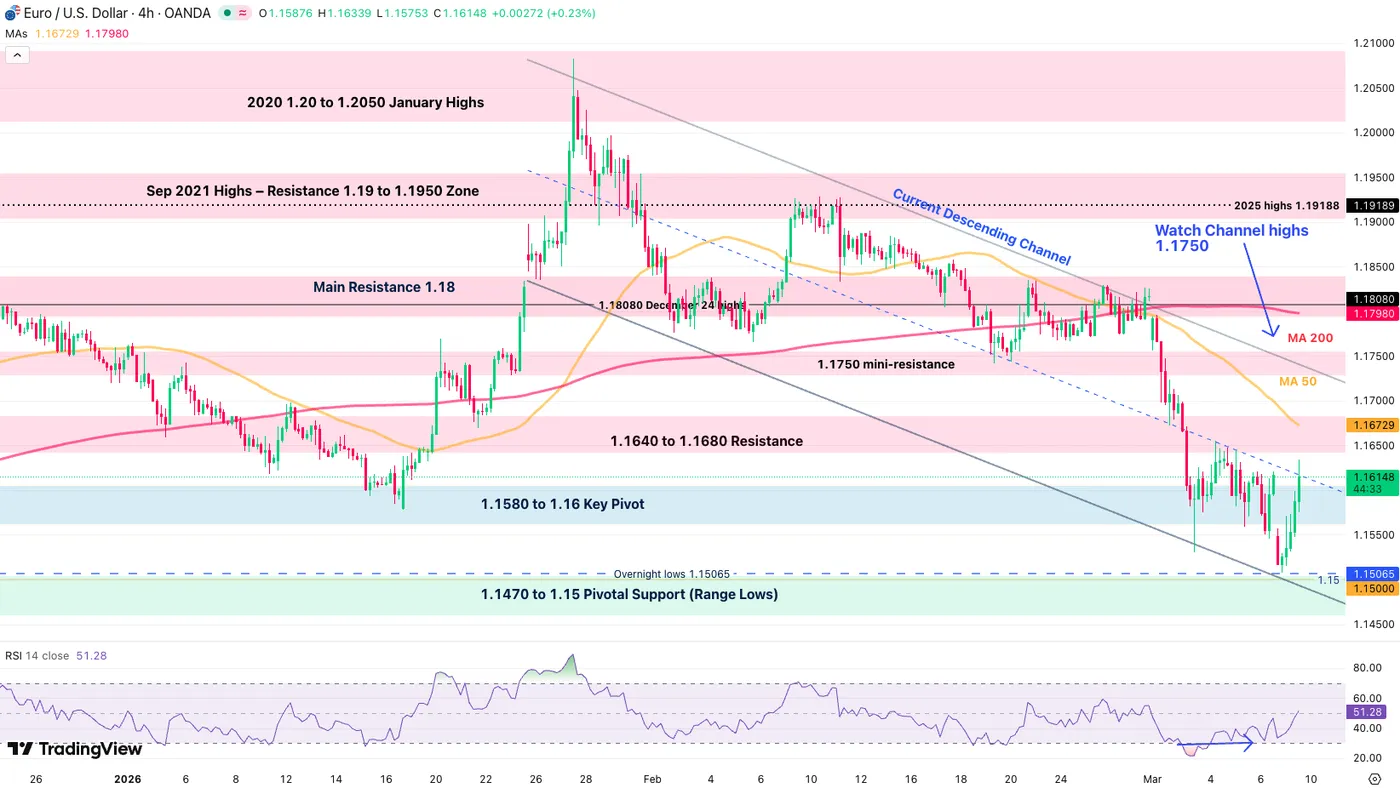
EUR/USD 4H Chart, March 9, 2026 – Source: TradingView
EUR/USD is now bouncing off of its clean downward channel – It will also face its 4H 50-period MA (1.16730).
If it breaks above, keep a very close eye on the downward channel top around 1.1750 to spot if the Channel holds.
Levels to place on your EUR/USD charts:
Resistance Levels
- 1.1640 to 1.1680 Resistance (4H 50-MA)
- 1.1750 mini-resistance and Channel Top
- Resistance Zone around 1.18 (+/- 150 pips)
Support Levels
- 1.1580 to 1.16 Key Pivot
- Overnight and Channel lows 1.15065
- 1.1470 to 1.15 Pivotal Support
- 1.1350 to 1.14 Support
Safe Trades and keep a close eye on Middle East developments!


