
It has been what felt like a few years since the previous FOMC, with what resembles a totally different Market since.
Since January 28, Oil is up close to 60%, Silver is down 25%, previously indestructible US Indexes have eased between 3% to 5%, and the World is now looking very different.
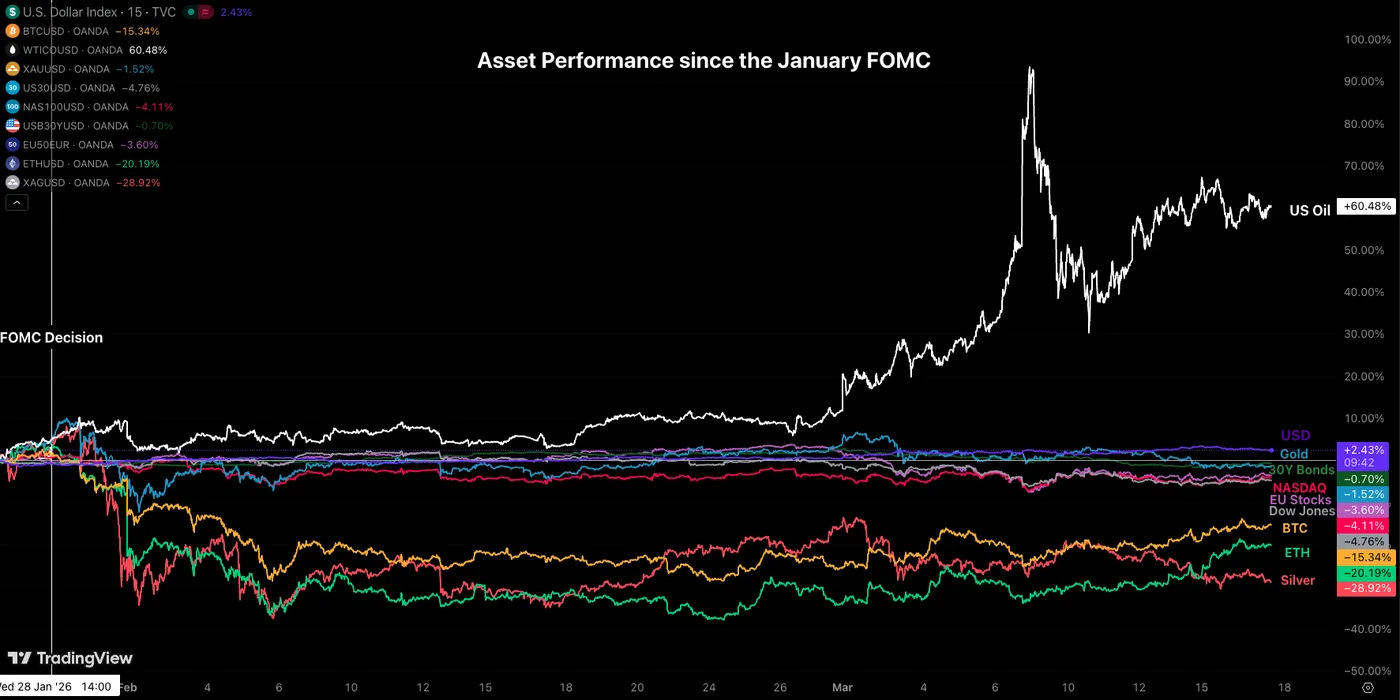
Asset Performance since the January FOMC – March 17, 2026. Source: TradingView
But what is probably the most overlooked Market development remains the US Dollar, aka Petrodollar that reached 10 months highs last Friday, as record bearish positioning led to swift position closures; hence rebounds.
The global Reserve Currency takes the upper hand when it comes down to a squeeze in Oil prices, with countries around the globe forced to hedge, and trade in US Dollars for ever-more expensive Barrels of Crude.
This phenomenon also got magnified by the swift pricing out of Fed Cuts, going from 65 bps pre-conflict to the current ~20 bps.
We will dive into an intraday chart outlook for all Major FX Currency pairs and provide trading levels for the upcoming FOMC event, as traders are anxiously awaiting for the Fed’s own economic projections and impacts from the conflict.
All FX Majors Charts with the key levels in play for the March FOMC
NZD/USD 4H Chart and technical levels
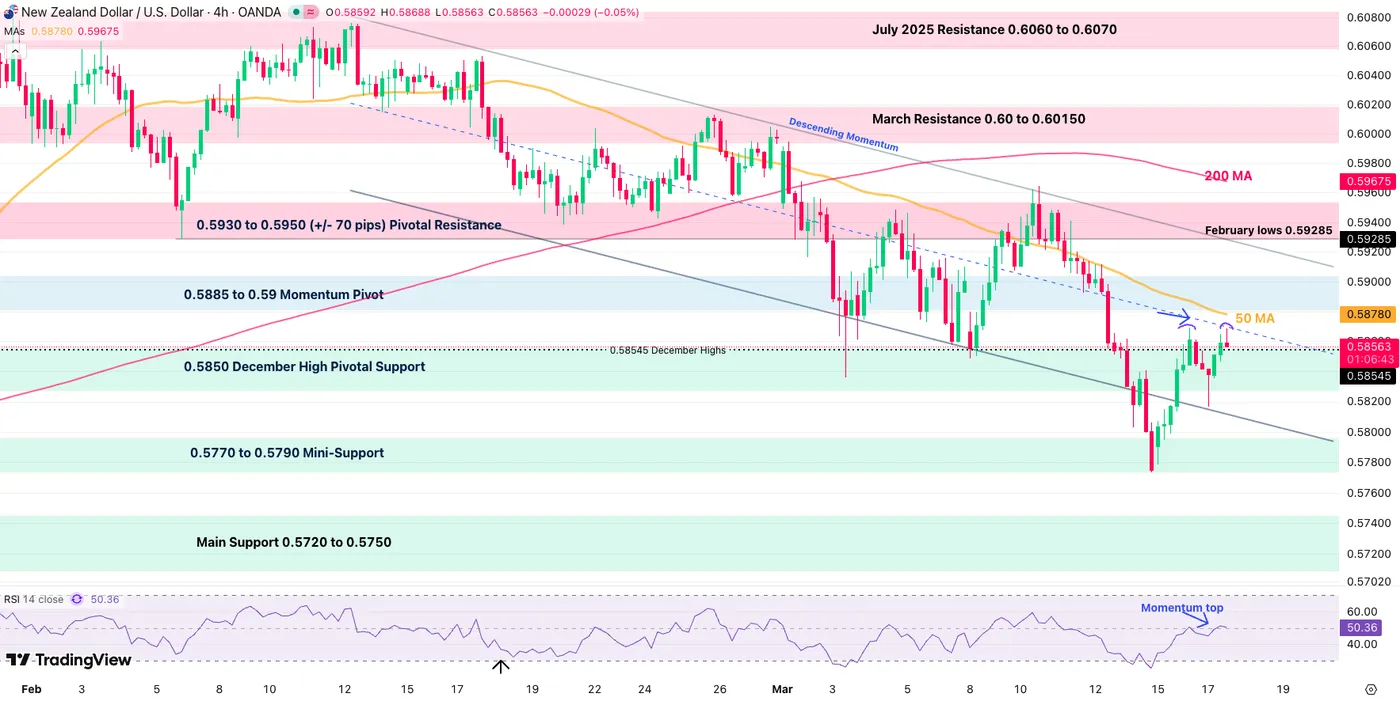
NZD/USD 4H Chart, March 17, 2026, Source: TradingView
FOMC Trading Levels for NZD/USD:
Resistance Levels
- 4H 50-period MA 0.58780
- 0.5885 to 0.59 Momentum Pivot
- 0.5930 to 0.5950 (+/- 70 pips) Pivotal Resistance
- March Resistance 0.60 to 0.60150
- July 2025 Resistance 0.6060 to 0.6070
Support Levels
- 0.5850 December High Pivotal Support
- 0.5770 to 0.5790 Mini-Support
- Main Support 0.5720 to 0.5750
USD/JPY 4H Chart and technical levels
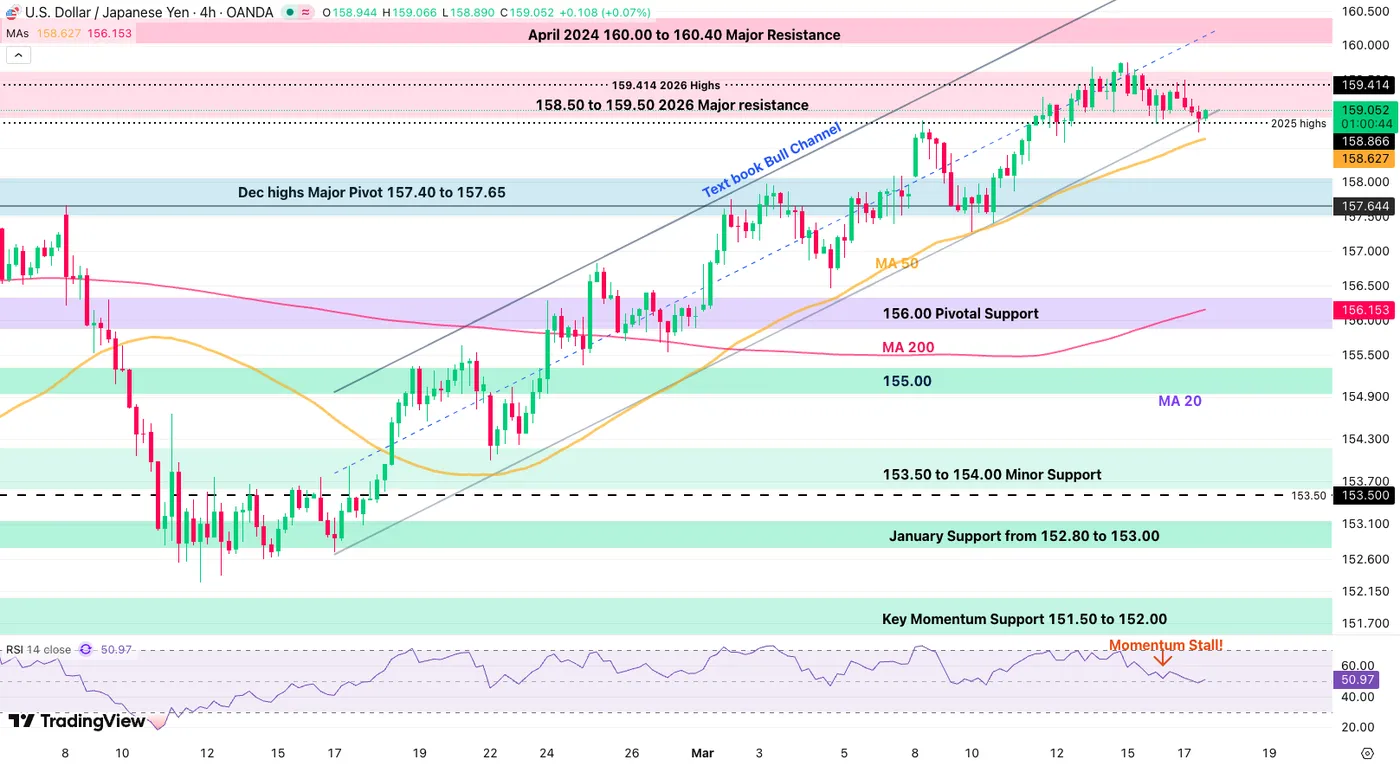
USD/JPY 4H Chart, March 17, 2026, Source: TradingView
FOMC Trading Levels for USD/JPY:
Resistance Levels
- 158.50 to 159.50 2026 Major resistance
- 159.75 2026 Highs
- April 2024 160.00 to 160.40 Major Resistance
Support Levels
- 4H 50-period MA 158.63
- Dec highs Major Pivot 157.40 to 157.65
- 156.00 Pivotal Support
AUD/USD 4H Chart and technical levels
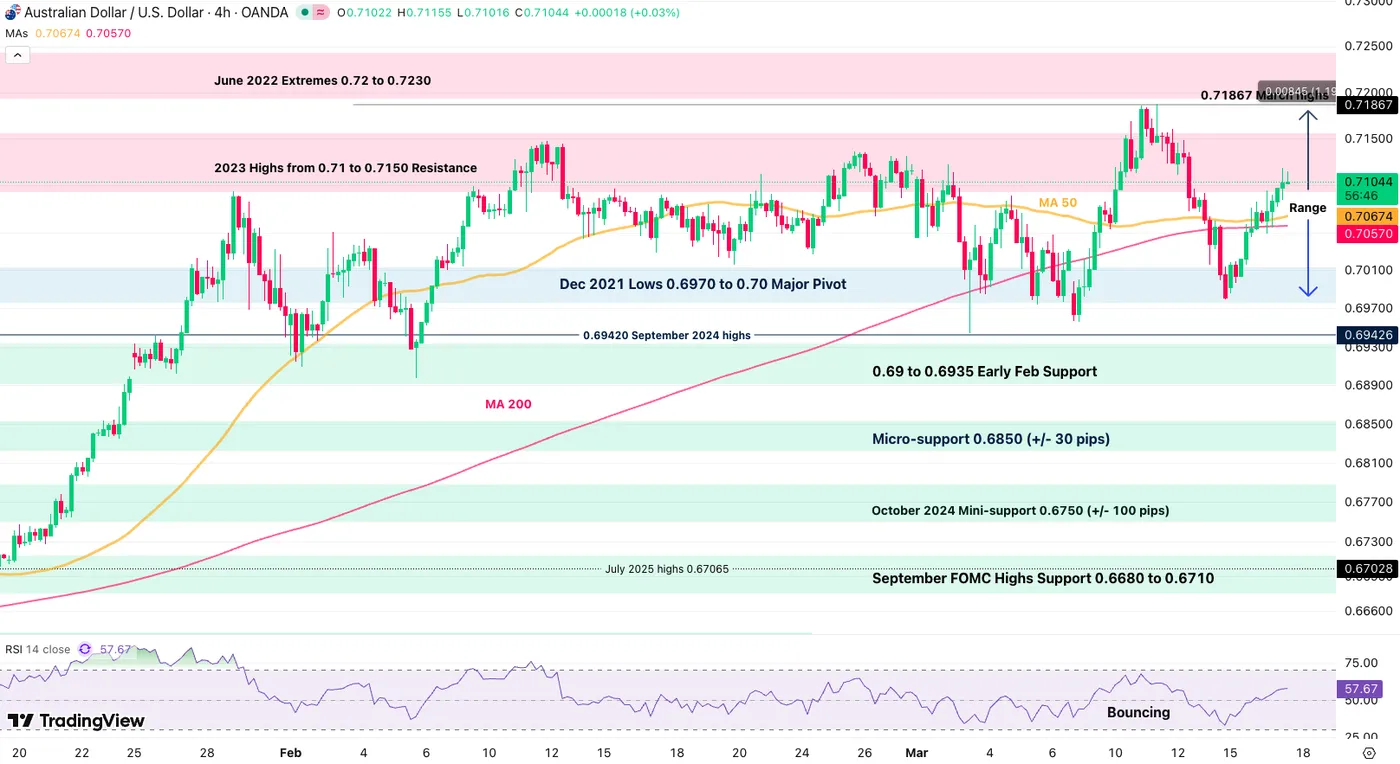
AUD/USD 4H Chart, March 17, 2026, Source: TradingView
FOMC Trading Levels for AUD/USD:
Resistance levels
- 0.71867 2026 Highs
- 2023 Highs from 0.71 to 0.7150 Resistance
- June 2022 Extremes 0.72 to 0.7230
Support levels
- Dec 2021 Lows 0.6970 to 0.70 Major Pivot
- 0.69 to 0.6935 Early Feb Support
- Micro-support 0.6850 (+/- 30 pips)
- October 2024 Minor support 0.6750 (+/- 100 pips)
EUR/USD 4H Chart and trading levels
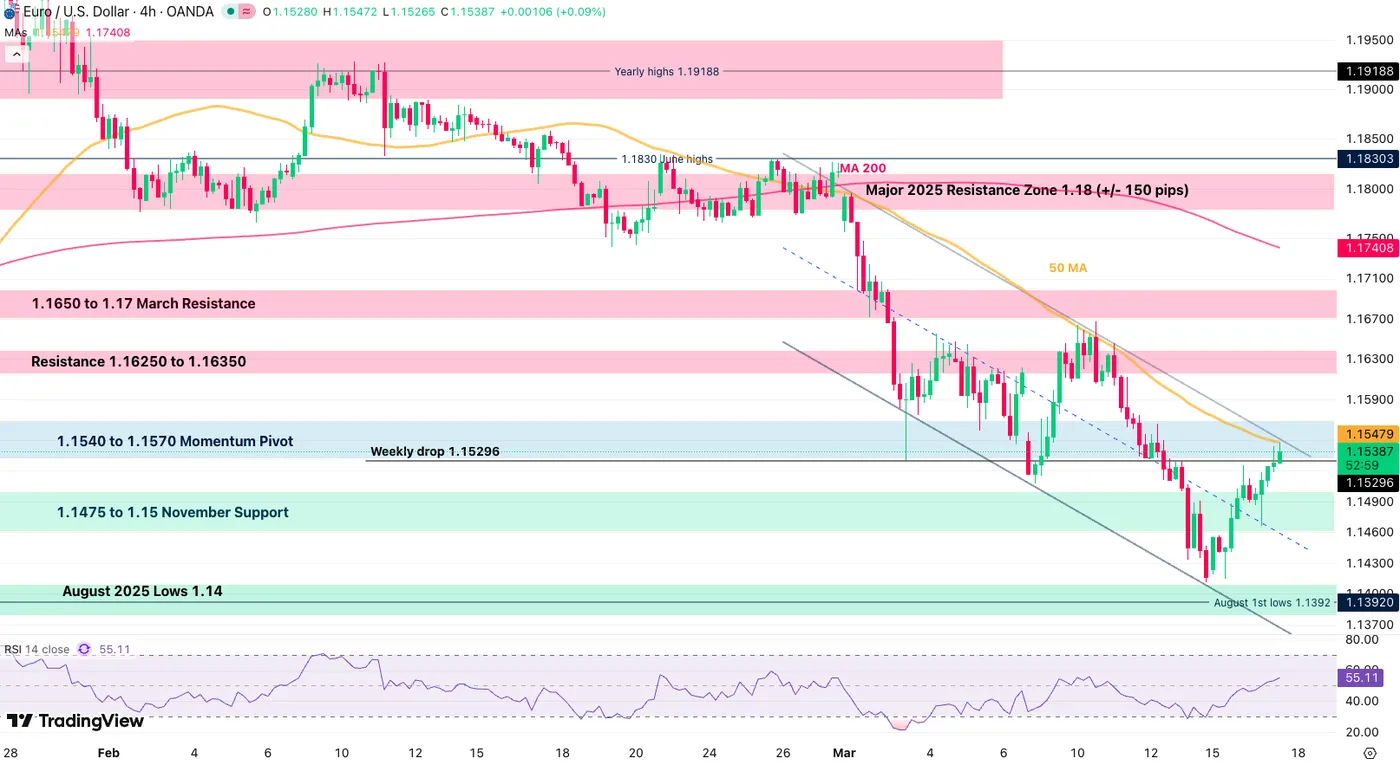
EUR/USD 4H Chart, March 17, 2026, Source: TradingView
FOMC Levels to watch for EURUSD:
Resistance Levels:
- 1.1540 to 1.1570 Momentum Pivot (4H 50-MA and Channel top)
- Resistance 1.16250 to 1.16350
- 1.1650 to 1.17 March Resistance
Support Levels:
- 1.1475 to 1.15 November Support
- August 2025 Lows 1.14
- Channel lows 1.35670
USD/CHF 4H Chart and technical levels
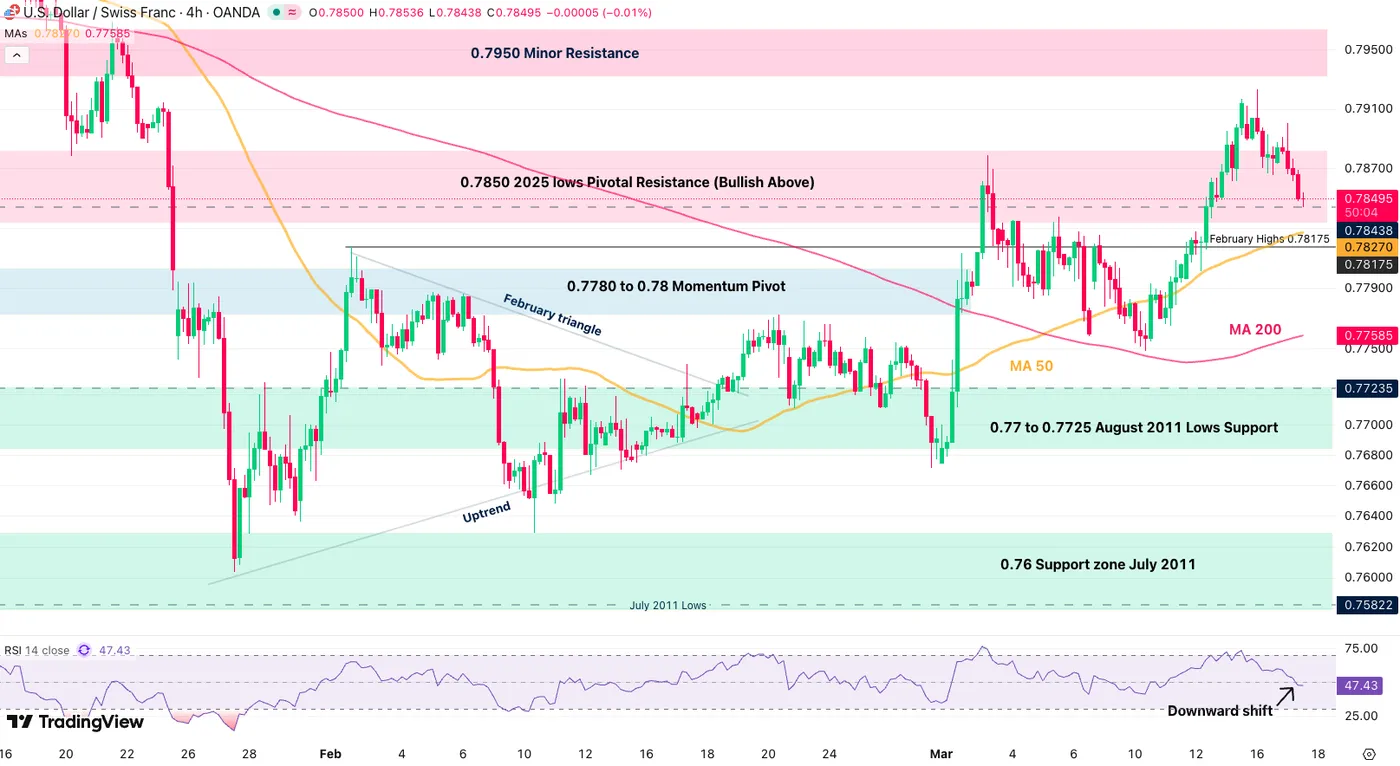
USD/CHF 4H Chart, March 17, 2026, Source: TradingView
FOMC Levels to watch for USD/CHF:
Resistance Levels
- 0.7850 2025 lows Pivotal Resistance (Bullish Above – testing)
- Recent highs 0.79310
- 0.7950 Minor Resistance
- 0.80 Next resistance
Support Levels
- 4H 50-period MA 0.7827
- 0.7780 to 0.78 Momentum Pivot
- 0.77 to 0.7725 August 2011 Lows Support
- 0.76 Support zone July 2011
GBP/USD 4H Chart and trading levels – Reaching 2025 highs
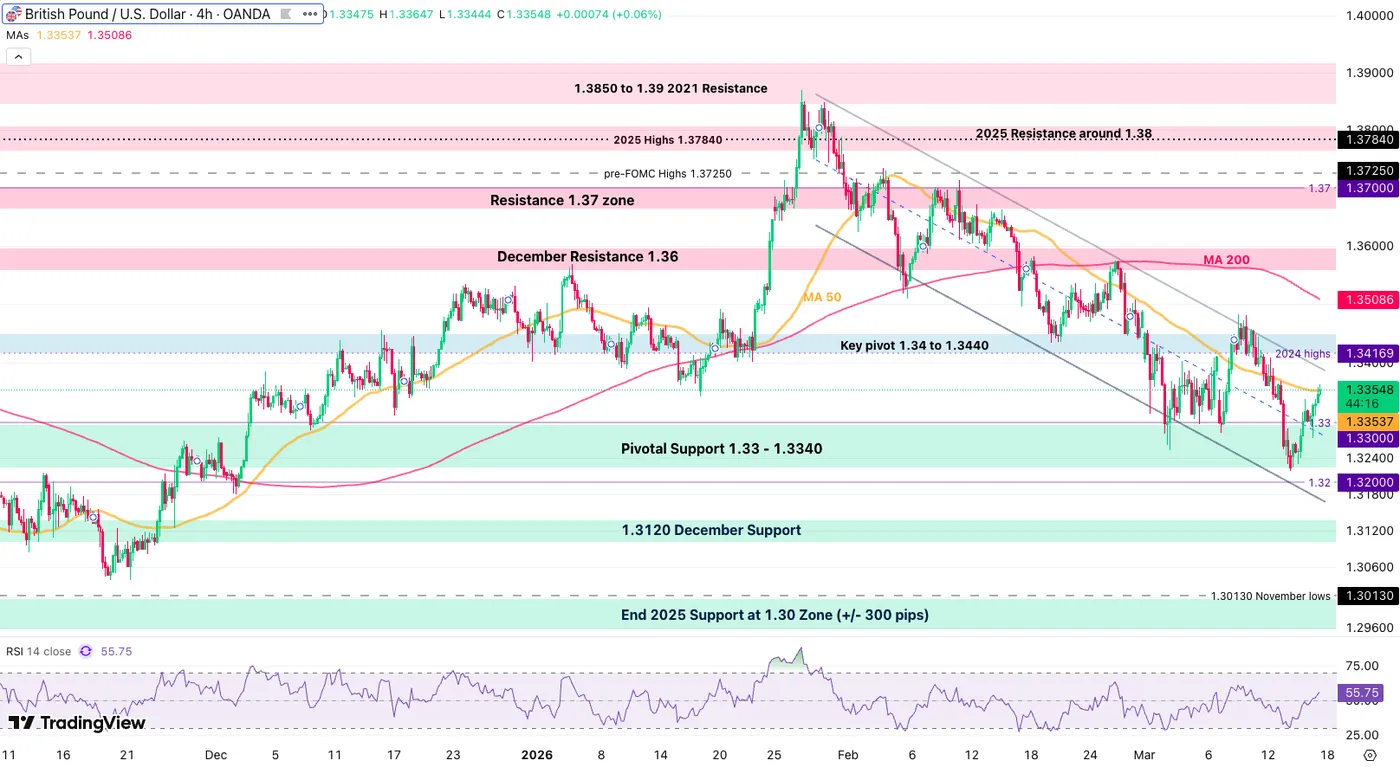
GBP/USD 4H Chart, March 17, 2026, Source: TradingView
FOMC Levels to watch for GBPUSD:
Resistance Levels
- 50-period MA 1.33540 (immediate test)
- Key pivot 1.34 to 1.3440
- 4H 200-period MA 1.3508
- December Resistance 1.36
Support Levels
- Pivotal Support 1.33 – 1.3340
- 1.3120 December Support
- End 2025 Support at 1.30 Zone (+/- 300 pips)
USD/CAD 4H Chart and trading levels – Reaching 2025 highs
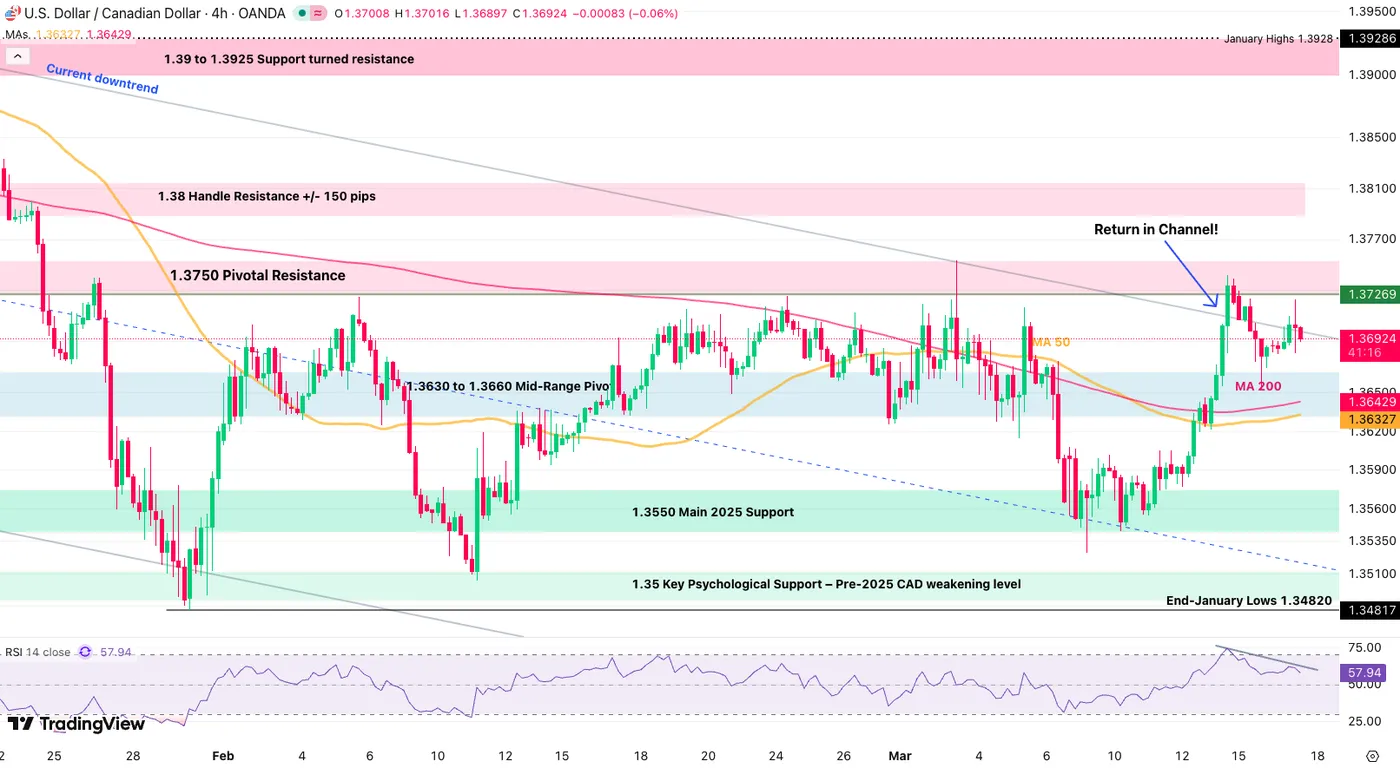
USD/CAD 4H Chart, March 17, 2026, Source: TradingView
Levels to watch for USD/CAD:
Resistance Levels
- 1.3750 Pivotal Resistance (Recent rejection)
- 1.37418 weekly highs
- 1.38 Handle Resistance +/- 150 pips
Support Levels
- 1.3630 to 1.3660 Mid-Range Pivot
- 1.3550 to 1.3570 Main 2025 Support
- 1.35 Key Psychological Support – Pre-2025 CAD weakening level
- 1.34 Next Main Support
Happy Saint-Patrick and Safe Trades as the FOMC approaches!


