
- WTI and Brent Crude Oil Technical Analysis with key levels as US-Iran news are still awaited.
- Despite extreme positivism in Stock Markets, Energy commodities remain doubtful.
- Volatility continues to shrink, but the latest progress has largely stalled.
The pricing of a peace deal between the US and Iran is continuous but also quite coarse.
While Equity Markets have gone on an absolute frantic rally, boosted by short-covering, options delta hedging, TACOs, and an ever-hungrier investor, Commodities are subject to very different dynamics.
Particularly when it comes to Energy products, Supply and Demand play their own very influential role.
While Futures pricing helps to dictate expectations, Traders have to remember that, before anything else, real products are needed for production, consumption, and much more around the world – Hence, physical demand has an immense influence on prices.
A major narrative that has emerged throughout the War is the large difference between physical and futures pricing, which has raised questions about a disconnect between Market pricing and the real-life issues faced by large buyers.
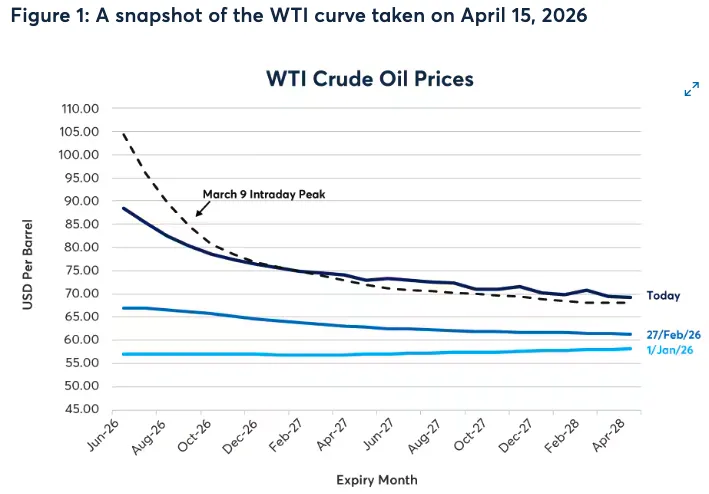
WTI Futures Backwardation from April 15, 2026 – Source: CMEGroup
The Futures Market has been in a large backwardation (where front contracts trade well above later contracts) – A natural formation amid supply fears, but no less damaging for hedgers. I invite you all to discover such dynamics throughout this fantastic CME piece.
Add to this gigantic regional discrepancies in Barrel prices, particularly in Asia, and you get a Market pulled higher by relentless demand while supply remains in a large drought.
This has created another wave of rallying throughout the session, with selloffs remaining supported by fresher bids – As long as Hormuz remains closed, a grind higher on pullbacks in Oil remains the path of least resistance.
Meanwhile, US-Iran talks that were supposed to start again today, are finally set to only start throughout the weekend. This did come with its fair share of good news, with Israel and Lebanon agreeing to a ceasefire, a final step before the discussions.
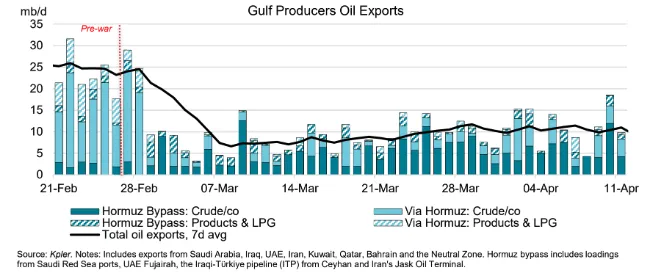
Gulf Oil Delivery Issues since End-February. Source: IEA
With these factors in mind, let’s dive right into an intraday outlook for both WTI and Brent Oil, highlighting their technical levels and outlining scenarios for their breakouts or breakdowns.
Crude Oil Market Check and Technical Levels
WTI 4H Chart
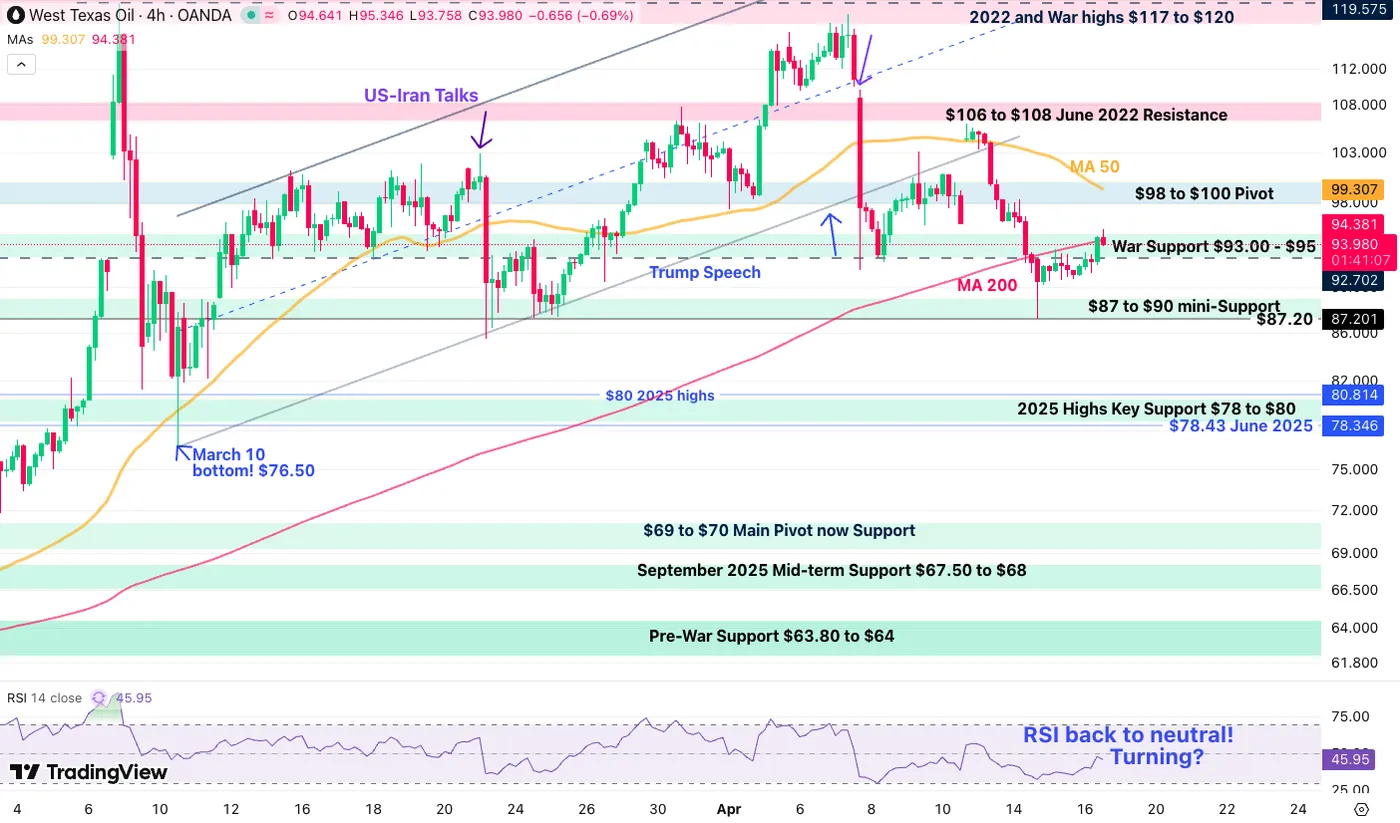
WTI Oil 4H Chart – April 16, 2026. Source: TradingView
WTI Crude has once again fallen below Brent after an irregular Market pricing throughout the past week, tumbling to $87.20 with Israel-Lebanon Peace talks boosting sentiment.
Nevertheless, as expressed in the introduction, the path of least resistance is to the upside, hence, bulls have pushed the commodity right back towards the 4H 200-period moving average (~$94.30).
Having rejected it, sellers will want to see extension back towards $90.
Failing to do so could see a large $90 to $100 range as traders await for clear instructions on where to look next.
Resistance and Support levels remain the best guides to navigate these volatile environments.
WTI Technical Levels:
Resistance Levels
- Daily highs $113.50 to $114.50 (small channel top)
- 2022 and Monday highs $117 to $120 (larger channel top)
- Ukraine War Spike $120 to $124
Support Levels
- War Support $93.00 – $95 (testing)
- $87 to $90 mini-Support (recent bounce)
- $82.80 to $84 micro-Support
- 2025 Highs Key Support $78 to $80
- $69 to $70 Final War Support
Brent 4H Chart
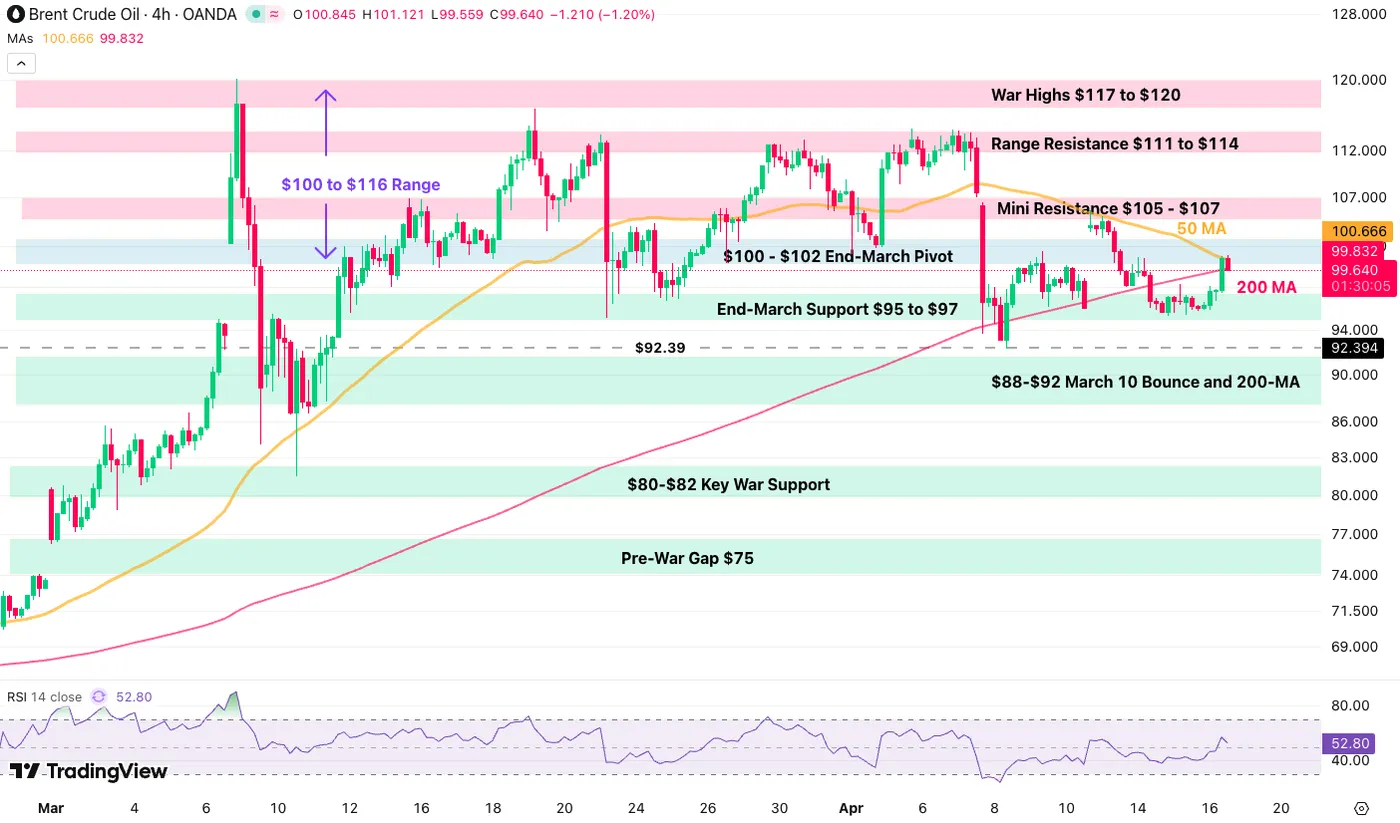
Brent Oil 4H Chart – April 16, 2026. Source: TradingView
Brent is still in a more contained price action compared to WTI, with the range now extending to $95 to $107.
Now testing its key 50 and 200-4H MAs, the action remains quite undecided.
Breakout traders will want to see a daily close below $95 (for sellers) and a clean break above $107 for buyers.
If the situation remains uncertain, the range should maintain.
Brent Technical Levels:
Resistance Levels
- $100 – $102 End-March Pivot
- Mini Resistance $105 – $107
- Range Resistance $111 to $114
- War Highs $117 to $120
Support Levels
- End-March Support $95 to $97
- $92.39 Recent dip
- $88 – $92 March 10 Bounce and 200-MA
- $80 – $82 Key War Support
- Pre-War Gap $75
Keep track of the headlines as the talks come closer by the second.
Safe Trades!


