


- WTI Oil is back to early May levels, when initial peace processes were announced, as Trump foreshadowed a reopening of the Strait of Hormuz in 30 days.
- Crude tumbles 7% in this low-volume session, with traders looking for confirmation from price and volume, but the narrative is positive for markets to start the week.
- Exploring an in-depth technical analysis of crude oil.
WTI Crude Oil is experiencing a concrete free-fall today, tumbling 7% and crashing right back down to early May levels.
The huge catalyst driving this violent downside action is President Trump’s blockbuster announcement foreshadowing a complete reopening of the critical Strait of Hormuz within the next 30 days.
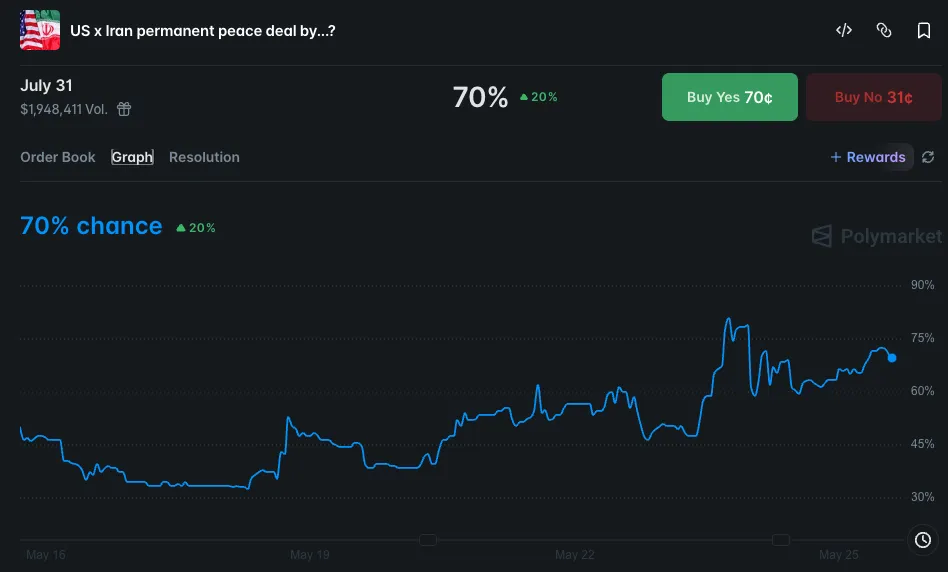
Peace Deal odds for July 31 – Source: Polymarket. May 25, 2026.
Although this severe collapse is unfolding during a notably low-volume holiday trading session, traders are still looking to confirm the price action and volume.
Regardless, the overarching narrative provides an incredibly positive fundamental tailwind for broader financial markets to kick off the trading week.
While the headline alone is enough to severely drain the geopolitical risk premium from the energy sector, traders remain acutely aware of the complex physical realities on the ground.
Crude oil may only experience its true structural correction once the strait actually resumes normal maritime operations, and even then, existing supply droughts will inevitably create lagging effects before physical prices can fully normalize lower.
Nevertheless, this massive diplomatic breakthrough represents the most concrete, actionable news the market has received in over two months.
Looking at the explosive reactions across global assets as futures markets finally open to start the shortened week, traders active during this holiday session are treating this breakthrough as a profoundly pivotal turning point for the entire energy complex.
Now, let’s take a closer look at the technical analysis for WTI Crude to see if prices can continue to correct.
US Oil Intraday Timeframe Analysis
WTI 4H Chart and Technical Levels
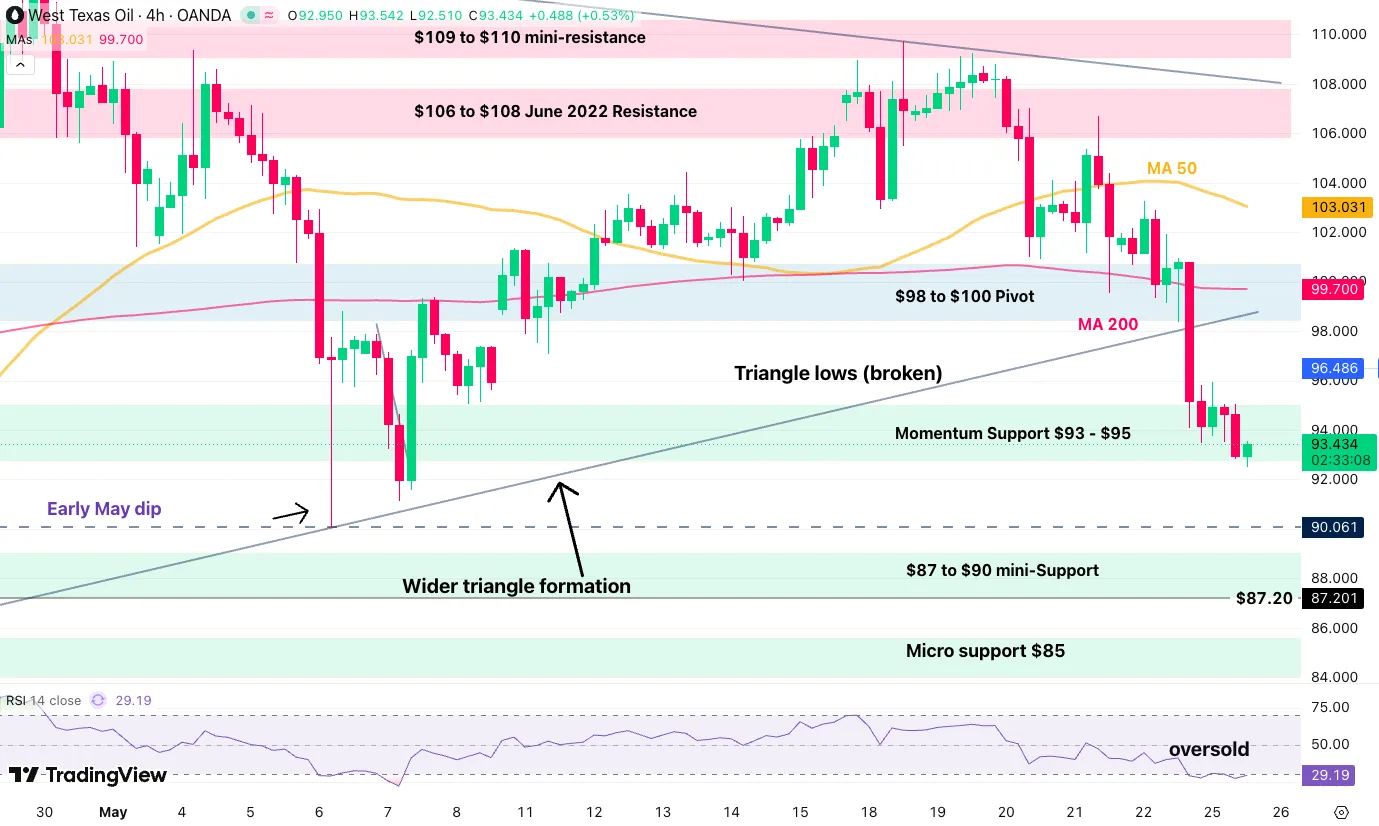
WTI Oil 4H Chart – May 25, 2026. Source: TradingView.
WTI Crude has just broken its large triangle formation, which had held since early April and now points to more downside ahead.
The headlines just landed and traders will have to be critical of how serious the idea of a Hormuz reopening really is, but what is clear is that the dynamic in oil has changed.
Reaching a key support, long-term bearish momentum will be more probable if the action fails to rebound above the $96 level, the top of the momentum support.
WTI Technical Levels:
Resistance Levels
- $98 to $100 pivot — 4H 200-period MA, short-term bearish below
- $103.03 — 4H 50-period MA
- $106 to $108 — June 2022 resistance
- $109 — Triangle resistance
- 2022 and Monday highs: $117 to $120 — larger channel top
Support Levels
- Momentum support: $93 to $95 — testing, fully bearish below
- $90 — Psychological level
- $87 to $90 — Mini-support
- $85 — Micro support
- $82 — Friday 17 lows
- $78 to $80 — 2025 highs key support
1H Chart and Action Levels
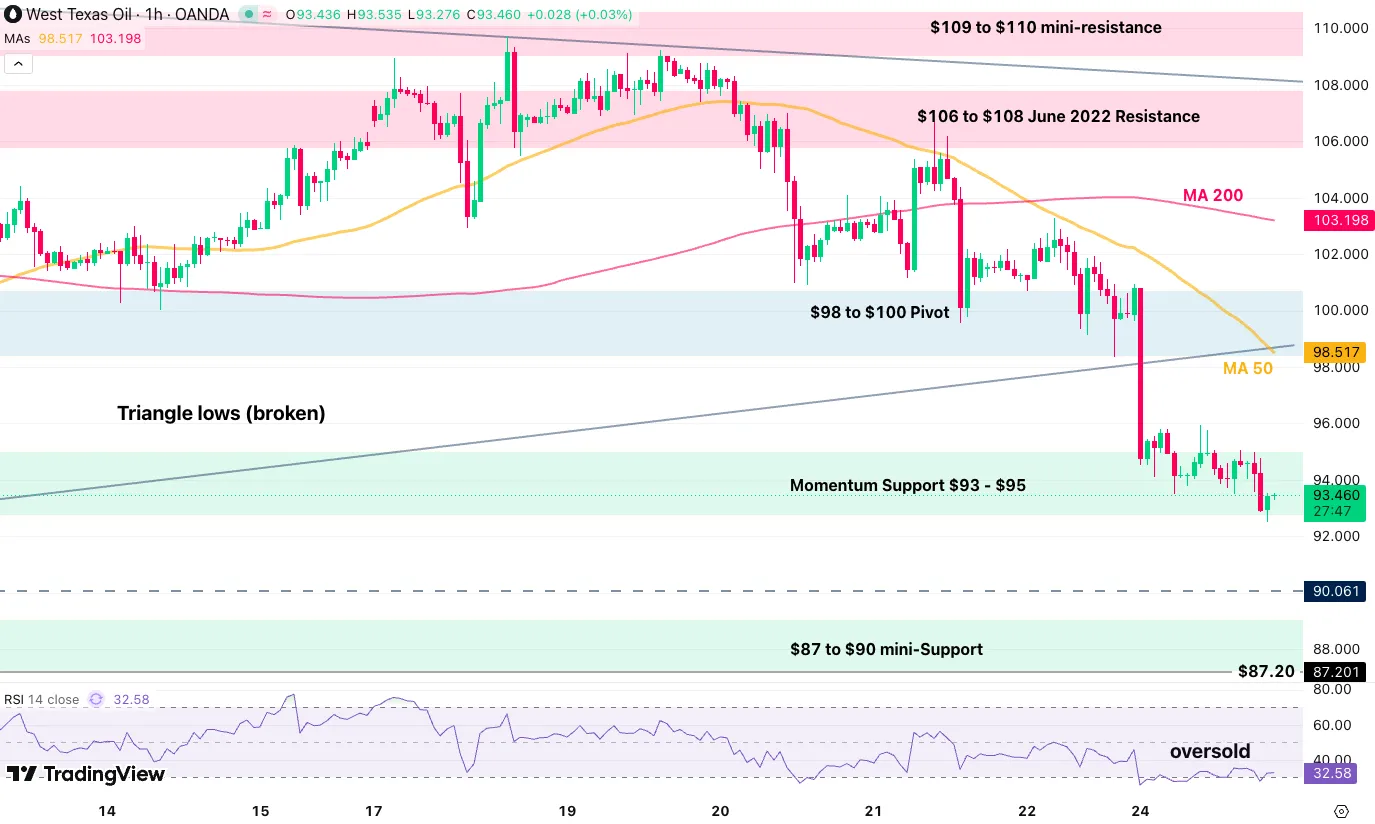
WTI Oil 1H Chart – May 25, 2026. Source: TradingView.
A good sign for bears is that despite the oversold conditions, bulls have not surged back in to buy the dip for the first time, indicating a change in momentum.
With the 50-hour MA crossing below the 200-MA, expect more selling on pops rather than buying on dips.
This would be confirmed further if bulls fail to close tomorrow’s session above the $96 highs.
Breaching below $90 reopens the way toward $80 and lower.
Safe trades and keep your eyes on the news!





