
Key Highlights
- GBP/USD started a recovery wave and tested the 1.3520 resistance.
- A contracting triangle is forming with resistance at 1.3480 on the 4-hour chart.
- EUR/USD is again moving lower and might decline below 1.1575.
- Bitcoin seems to be facing an increase in selling pressure and might dive below $70,000.
GBP/USD Technical Analysis
The British Pound found support at 1.3300 against the US Dollar. GBP/USD started a recovery wave above 1.3380 and 1.3420 before the bears appeared.
Looking at the 4-hour chart, the pair climbed above the 50% Fib retracement level of the downward move from the 1.3653 swing high to the 1.3302 low. However, the bears seem to be active near the key hurdle at 1.3520.
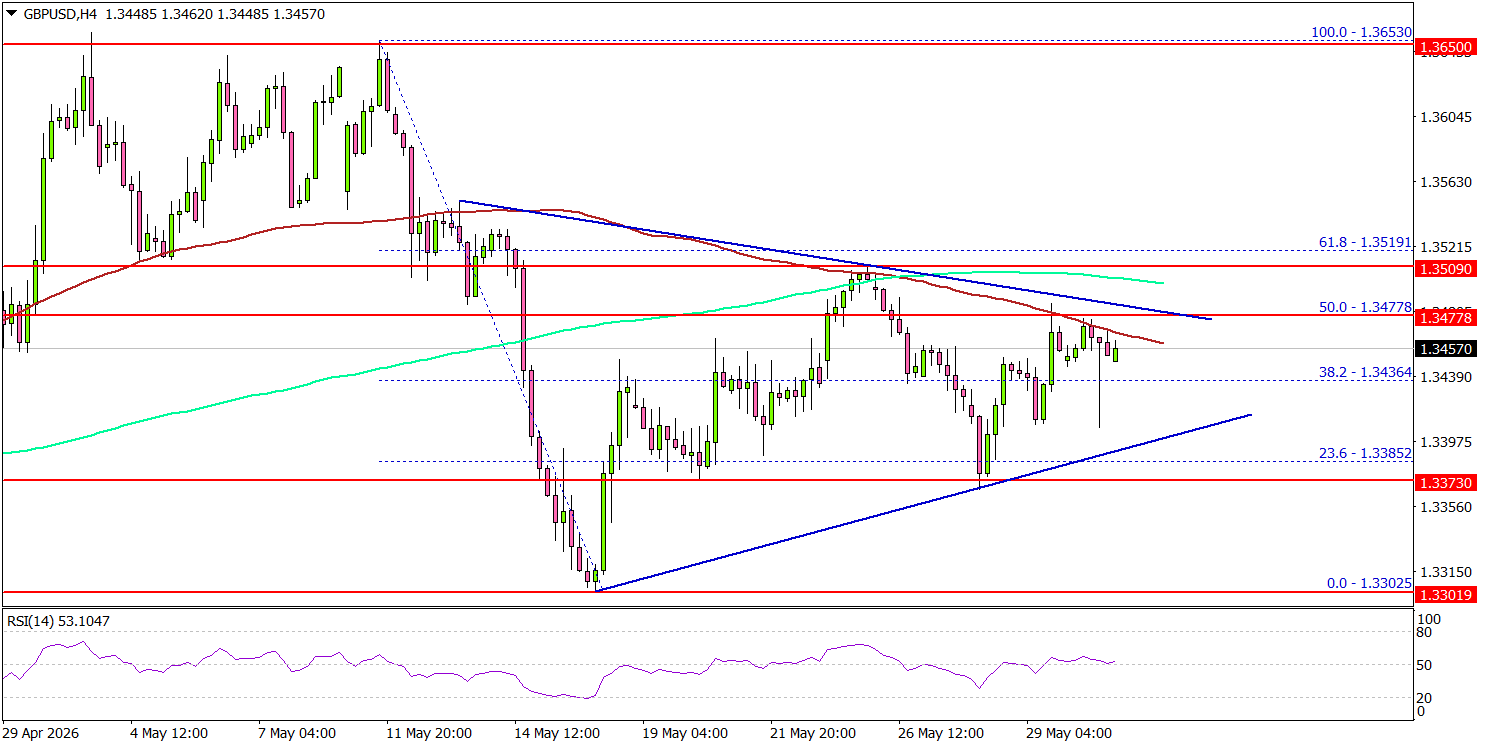
There is also a contracting triangle forming with resistance at 1.3480. The pair is now trading below the 100 simple moving average (red, 4-hour) and the 200 simple moving average (green, 4-hour).
On the upside, an immediate resistance could be 1.3480. The next major resistance might be 1.3520 and the 61.8% Fib retracement level of the downward move from the 1.3653 swing high to the 1.3302 low. A close above 1.3520 could open doors for gains above 1.3550. In the stated case, the bulls could aim for a move to 1.3650.
On the downside, the pair could find bids near 1.3420. The first major support might be 1.3400. A close below 1.3400 might initiate a drop to 1.3300. Any more losses might open the doors for a drop toward the 1.3220 zone.
Looking at EUR/USD, the pair failed to continue higher, started a fresh decline, and might move below the 1.1600 support.
Upcoming Key Economic Events:
- BoE’s Governor Bailey speech.
- BoE’s Greene speech.


