
Key Takeaways
- The S&P 500 faces growing downside risks amid deteriorating market breadth. Despite a sharp rebound in semiconductor stocks, only three of the eleven S&P 500 sectors advanced, highlighting narrow leadership and a lack of broad-based participation in the rally.
- Rising expectations of Fed rate hikes are tightening financial conditions. Following a stronger-than-expected US jobs report, markets are increasingly pricing in Fed rate hikes starting as early as October 2026, which could pressure valuations, particularly in AI infrastructure and semiconductor-related sectors.
- Technical indicators point to further near-term weakness. The S&P 500 remains capped below its 20-day moving average, while the NYSE Advance/Decline line has broken below key support and flashed a bearish divergence, suggesting underlying distribution rather than accumulation.
The S&P 500, one of the four major US benchmark stock indices, posted a 2.6% weekly decline, halting its 9-week streak of consecutive gains, and recorded its worst weekly performance since the week of 23 March 2026 during the depths of the US-Iran war.
The bulk of last week’s losses came on Friday, 5 June, ex-post US non-farm payrolls induced a plunge of 2.64%, reinforcing a tighter liquidity condition ahead as Fed funds futures traders start to position for a more hawkish US Federal Reserve.
Based on the latest data from the CME FedWatch tool as of 9 June 2026, the increased odds of 63% that the Fed may start to enact its first 25 basis points (bps) rate hike as soon as the October 2026 FOMC meeting and another hike of 25 bps (63% chance) to come in April next year.
This hawkish Fed funds rate repricing is likely to dampen the earlier optimistic revenue guidance reported during the first-quarter US earnings reporting session, especially in the AI-infrastructure and semiconductor sectors, in turn, triggering a negative feedback loop into the S&P 500.
Weak Market Breadth

Fig. 1: S&P 500 medium-term trend with cumulative AD line as of 8 Jun 2026 (Source: TradingView). The information presented is historical information, and past performance is not indicative of future performance.
The “buy-the-dip” behaviour seen in US semiconductor stocks on Monday, 8 June, when the PHLX Semiconductor index surged by 5.6% to lead the intraday recovery, could be a “bull trap” as market breadth was weak.
Out of the 11 S&P 500 sectors, only three of them managed to notch gains on Monday: Technology (+1.5%), Energy (+1.1%), and Consumer Discretionary (+0.5%).
Also, the cumulative Advance/Decline line of all stocks traded on the New York Stock Exchange (NYSE) has broken below a former medium-term ascending support after a bearish divergence condition, indicating a distribution pattern underneath rather than an accumulation after yesterday’s rally in US semiconductor stocks (see Fig. 1).
Let’s now decipher the short-term trajectories (1 to 3 days) of the SPX 500 CFD (a proxy of the S&P 500 E-mini futures).
Capped Below the 20-Day Moving Average
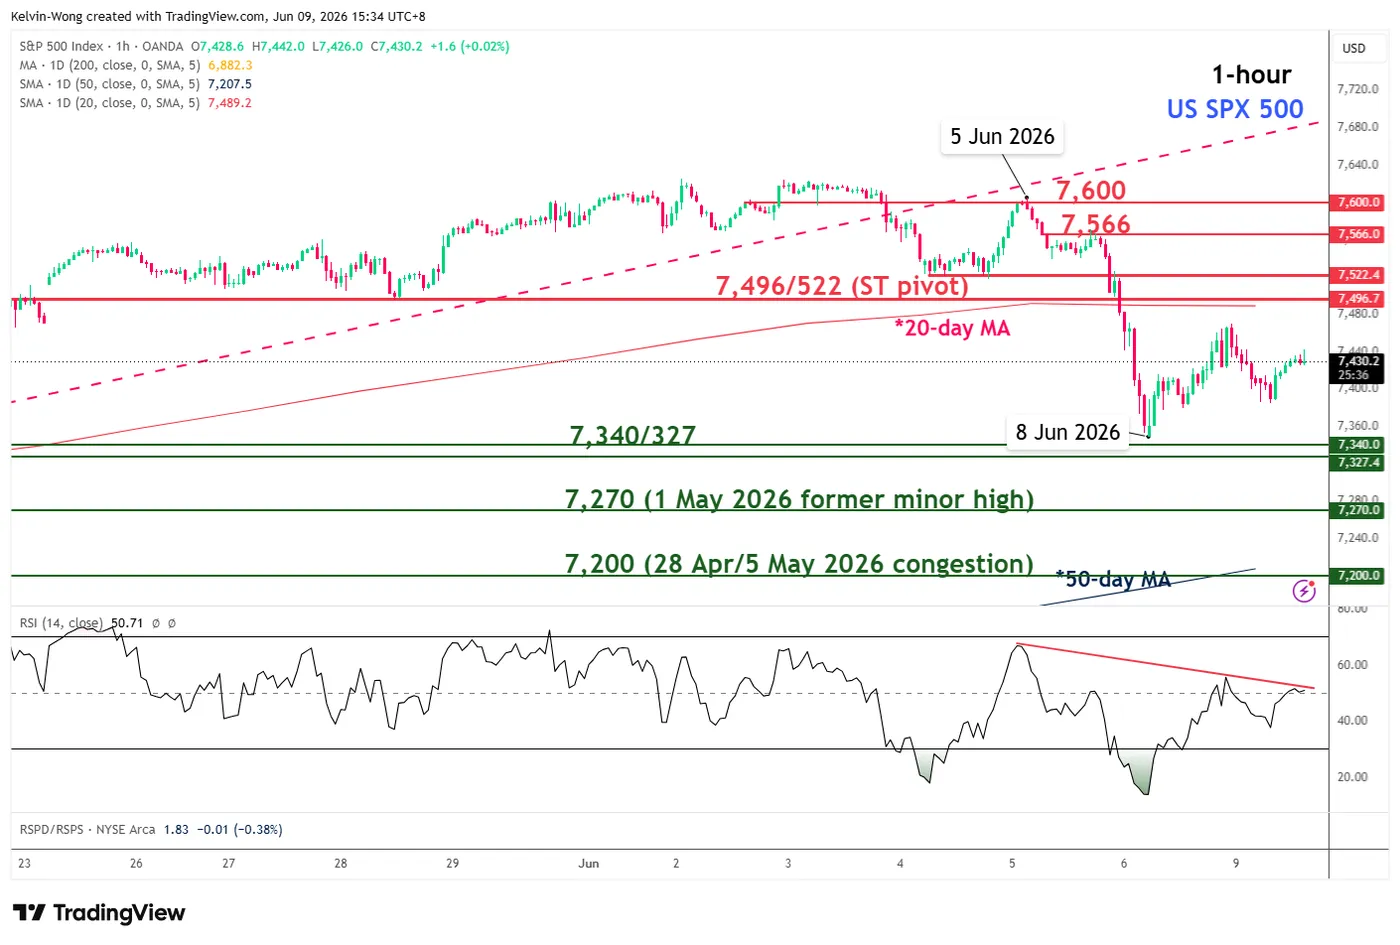
Fig. 2: US SPX 500 CFD minor trend as of 9 Jun 2026 (Source: TradingView). The information presented is historical information, and past performance is not indicative of future performance.
Trend bias: Bearish reversal of medium-term uptrend, 7,496/522 key short-term pivotal resistance (see Fig. 2).
Supports: 7,340/327 (8 May/19 May 2026 minor lows), 7,270 (1 May 2026 former minor high & Fibonacci extension), 7,200 (28 April/5 May 2026 congestion & Fibonacci extension).
Next resistances: 7,566 (5 June 2026 minor high), 7,600 (2/5 June 2026 congestion).
Key Elements to Support the Short-Term Bearish Bias on SPX 500 CFD
- Yesterday’s rebound stalled at around 50% Fibonacci retracement of the prior minor drop from the 5 June 2026 high to the 8 June 2026 low.
- Price actions remain below the 20-day moving average.
- The hourly RSI momentum indicator remains capped below a descending resistance at around the 50 level.


