


Key Highlights
- Gold started a downside correction from $4,700 and tested the $4,280 support.
- A bearish trend line is forming with resistance at $4,480 on the 4-hour chart.
- WTI Crude Oil remained elevated and might continue to rise toward $95.00 or $100.00.
- EUR/USD started a recovery wave after it found support near 1.1565.
Gold Price Technical Analysis
Gold failed to surpass $4,700 and corrected gains against the US Dollar. The price dipped below $4,500 before the bulls appeared near $4,280.
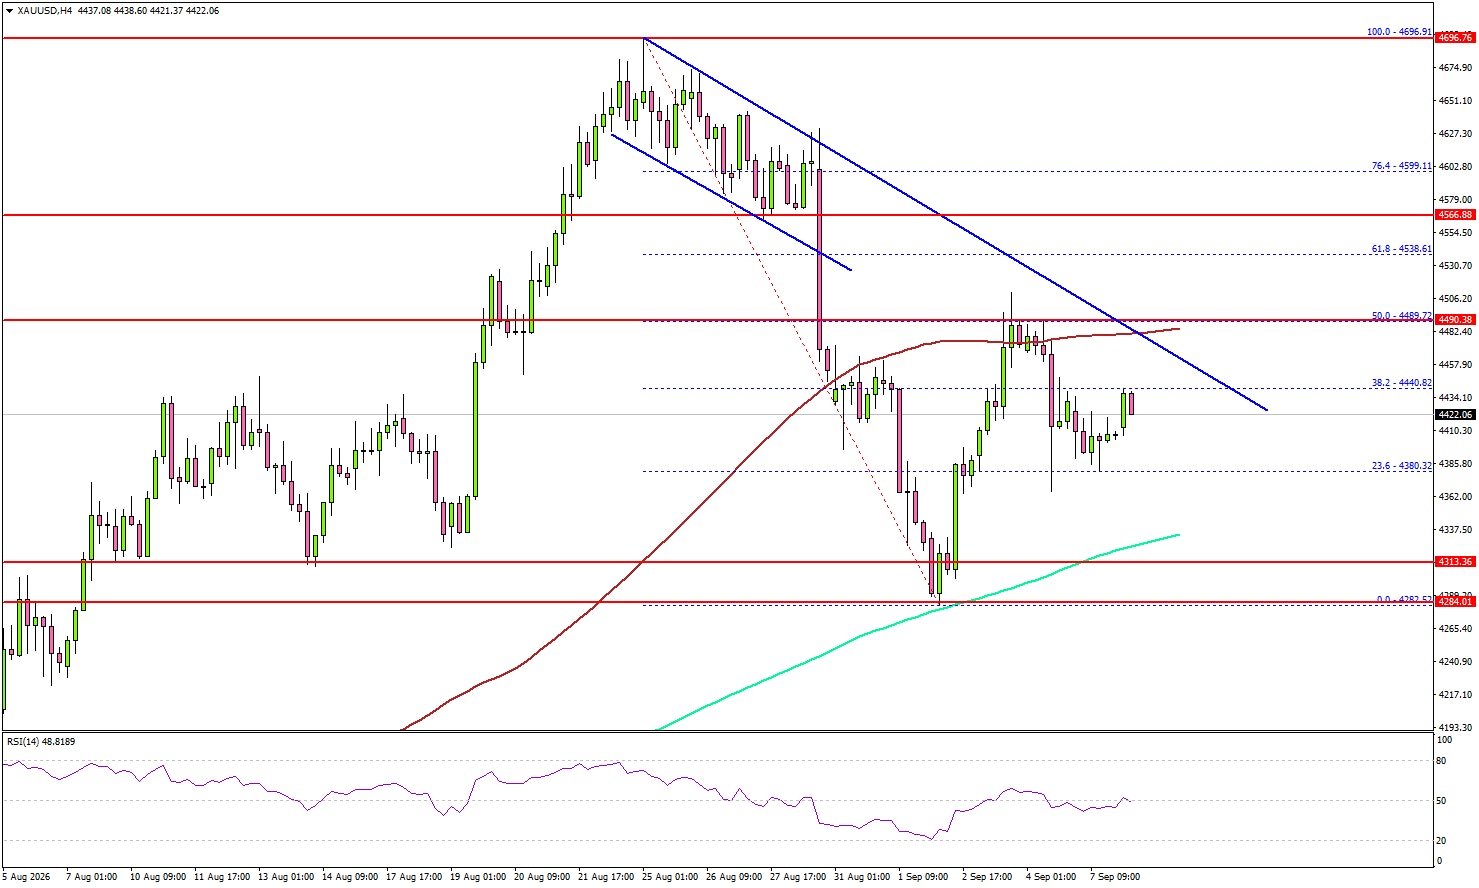
The 4-hour chart of XAU/USD indicates that the price formed a lot at $4,282 and recently attempted a recovery wave. The price climbed above $4,400 and $4,450. The price even spiked above $4,480, the 100 Simple Moving Average (red, 4 hours), and the 50% Fib retracement level of the downward move from the $4,696 swing high to the $4,2852 low.
On the upside, immediate resistance could be $4,465. The next major resistance might be $4,480. There is also a bearish trend line forming with resistance at $4,480.
A clear move above $4,480 could open the door for more upside. In the stated case, the bulls could aim for a move toward $4,565 or even $4,580. Any more gains might send the price toward the $4,680 level.
If there is a fresh decline, the price could test the 200 Simple Moving Average (green, 4 hours) at $4,320. The first major support sits at $4,300. The next support could be $4,280, below which the price might slide to $4,220. The main support sits at $4,20. Any more losses might call for a test of $4,050 or even $4,020 in the coming days.
Looking at WTI Crude Oil, the price could stay in a positive zone, and the bulls might aim for a larger move to test $100.00.
Economic Releases to Watch Today
- US ADP Employment Change 4-week Average- Forecast 10K, versus 11.75K previous.
- BoE Monetary Policy Report Hearings.
- ECB’s Elderson speech.





