The common European currency continued to appreciate against the New Zealand Dollar after hitting the dominant support line near the 1.6520 level in early January.
After reaching the 50.00% Fibonacci retracement level, the pair started making a U-turn to the south. The retracement can be measured by connecting the January low at 1.6520 and the December high at 1.7480.
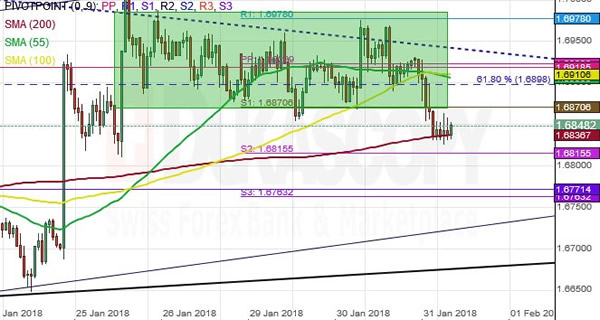
Meanwhile, in the 1H time frame there is already a breakout from a rectangle pattern, which can be observed on the chart. The currency exchange rate is likely to continue south until it finds support at the weekly pivot point level at 1.6690.