
Currency pair GBP/USD
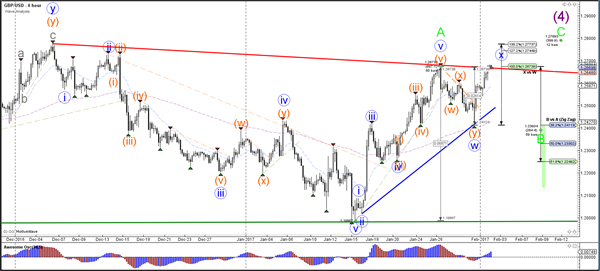
The GBP/USD is retesting the resistance trend line (red). A bearish bounce could confirm a wave X (blue) and see price test the Fibonacci levels of wave B (green). A break above the 138.2% Fibonacci level of wave X vs W invalidates wave X (blue) and makes an uptrend likely.
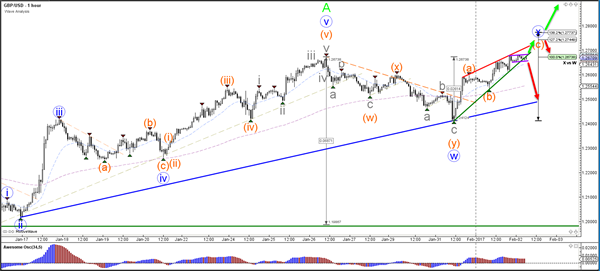
The GBP/USD seems to be building a rising wedge chart pattern (red/green). A breakout (arrows) could occur to both sides of the support and resistance trend lines.
Currency pair EUR/USD
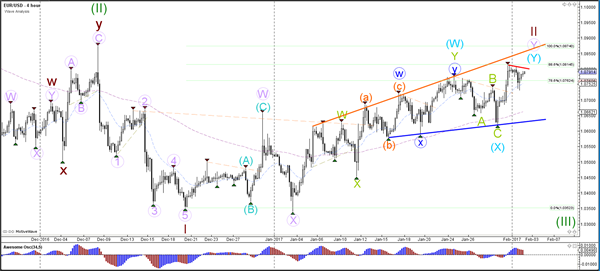
The EUR/USD showed a bearish bounce as expected at the 88.6% level resistance level. The bearish bounce however has been choppy and mild. A break above the 88.6% makes a wave 2 (brown) unlikely and a break above 100% invalidates this wave structure. A break below support (blue) could spark wave 3 (green).
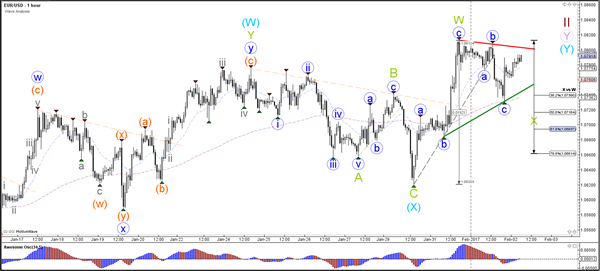
The EUR/USD is showing hesitation when developing bearish price action and is finding support along the way. Price bounced at the 38.2% Fibonacci support level of wave X vs W and is now retesting the resistance trend line (red).
Currency pair USD/JPY
The USD/JPY is retracing back to the Fibonacci levels of wave 4 (purple). Either the 38.2% or 50% are likely bounce spots for such a wave 4 (purple).
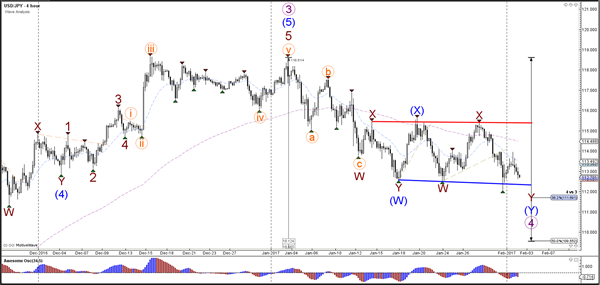
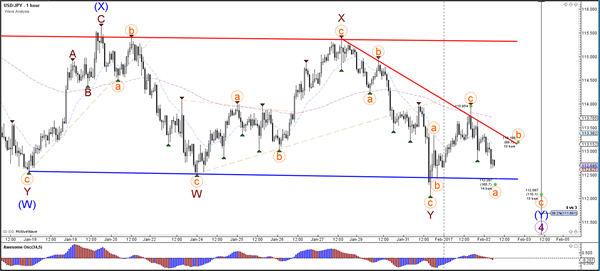
The USD/JPY is building a bearish ABC (orange) zigzag within wave Y (blue).


