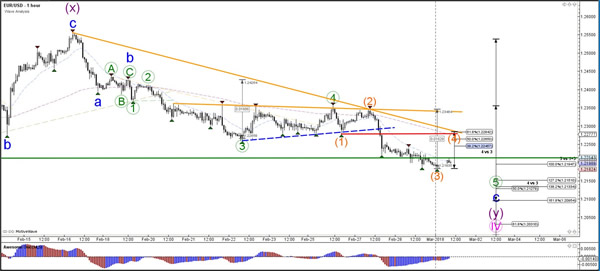
Currency pair EUR/USD
The EUR/USD is trying to break below the previous bottom (green) but the bearish price action is mild and candles are small. The support zone and the 50% Fibonacci level of wave 4 (pink) is a key decision level for a bullish bounce or bearish breakout. A bearish break makes a wave 4 (purple) pattern less likely.
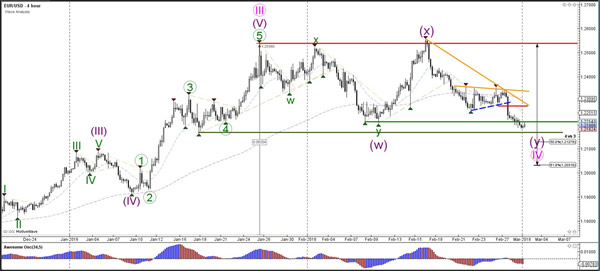
The EUR/USD is probably building a wave 4 (orange) unless price breaks above the bottom of wave 1 (red line), which indicates a potential bullish breakout.
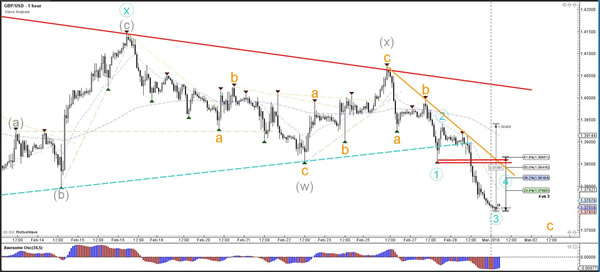
Currency pair GBP/USD
The GBP/USD broke belowthesupport (dotted blue) of the triangle chart pattern and reached the 61.8% Fibonacci level. This Fib is a new bounce or break spot.A bearish break invalidates the wave 4 (green) pattern.
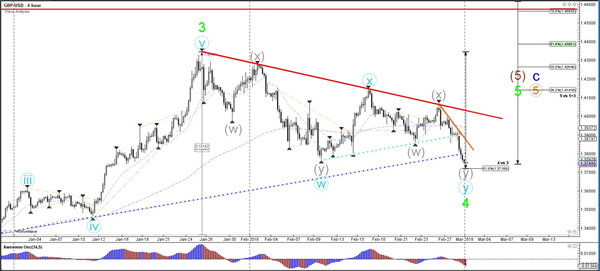
The GBP/USD created strong bearish momentum yesterday which is most likely a wave 3 (blue), unless price breaks above the bottom of the wave 1 (red line).
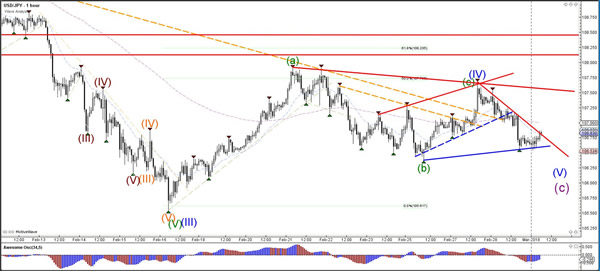
Currency pair USD/JPY
The USD/JPY is probably in a wave 4 (blue) but price will need to break below support (blue) to confirm a wave 5 (blue) pattern.
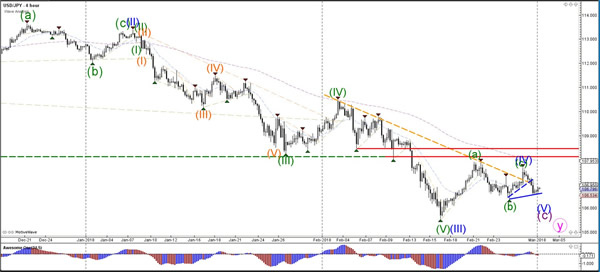
The USD/JPY Is building a larger correction on the 1 hour chart.