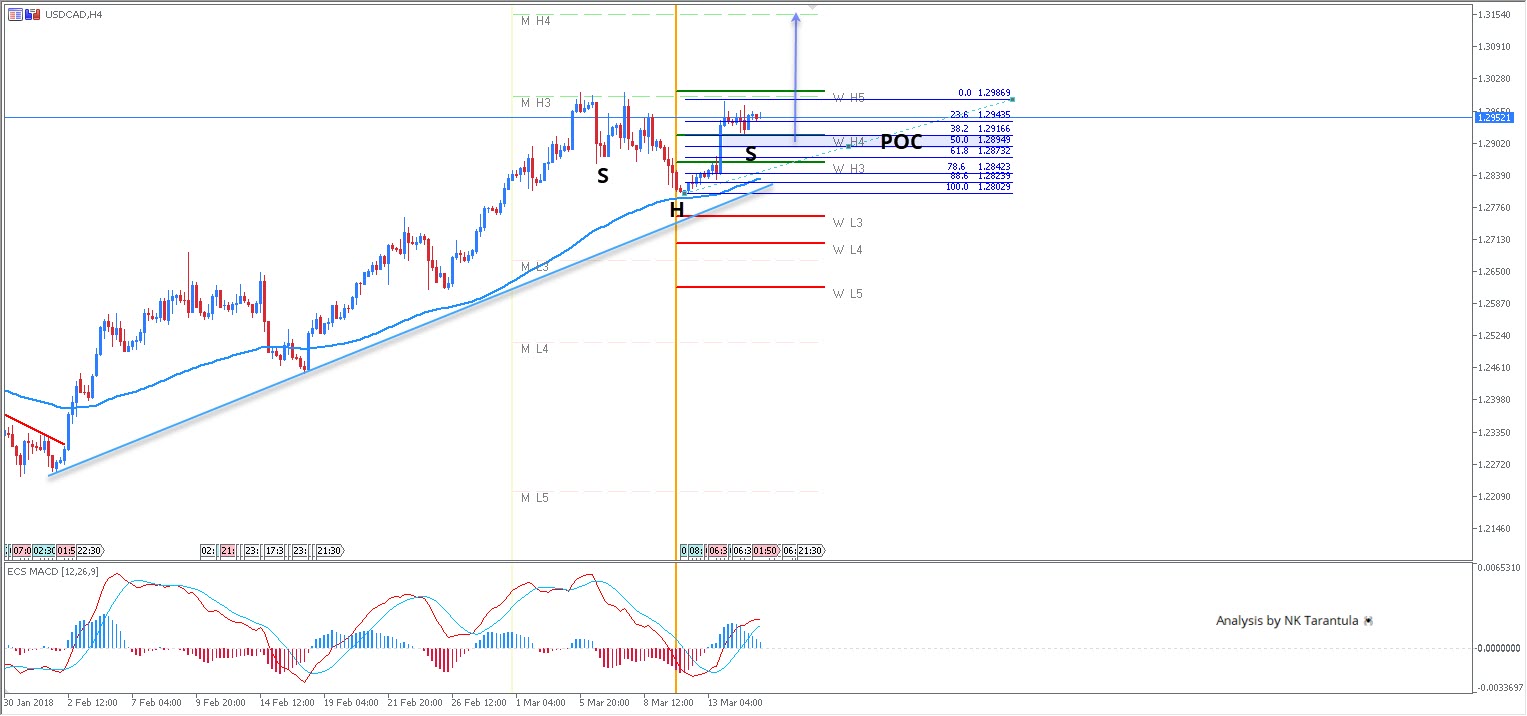
The USD/CAD has formed an inverted head and shoulder bullish pattern. The right shoulder has been formed, however the price could still retrace down before a possible bounce. At this point the price might go straight up (from 1.2943) or retrace exactly to POC then bounce. 1.2895-1.2915 is the POC zone so pay attention to it. Targets are 1.2990 – confluence of W H5 and M H3 camarilla pivots. This is a strong resistance zone and the pair needs a 4h close above 1.3000 to proceed further up. In that case, it could even target M H4 in upcoming days. As long as the pair is holding above 1.2800 it is bullish.
W H3 -Weekly Camarilla Pivot (Weekly Interim Resistance)
W L3 – Weekly Camarilla Pivot (Weekly Interim Support)
W H3 – Weekly Camarilla Pivot (Weekly Interim Resistance)
W H4 – Weekly Camarilla Pivot (Strong Weekly Resistance)
M H4 – Monthly Camarilla Pivot (Very Strong Monthly Resistance)
M L3 – Monthly Camarilla Pivot (Monthly Support)
M L4 – Monthly H4 Camarilla (Very Strong Monthly Support)
POC – Point Of Confluence (The zone where we expect price to react aka entry zone)