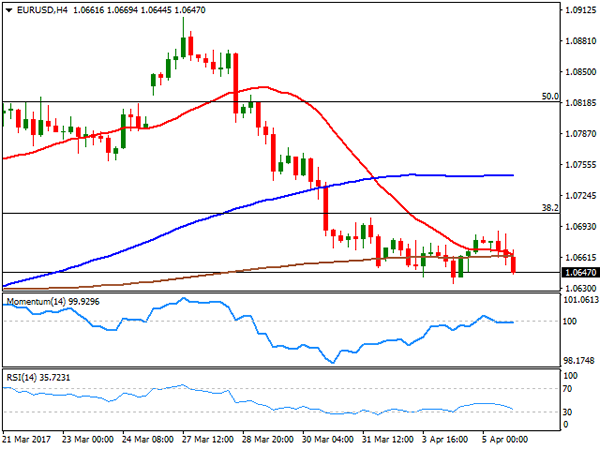
EUR/USD
A re-surge in market’s confidence on the US economy, following the release of a much better-than-expected ADP survey, pushed the greenback higher across the board, although majors held within familiar ranges. The EUR/USD pair fell down to 1.0634 and closed the day a couple of pips above it, with the common currency weighed by slightly worse-than-expected Markit Services PMIs for the EU. Despite growth in the sector for the whole region was confirmed near six-year highs, initial estimates for March were revised lower, with the index printing 56.0, down from the flash reading of 56.5. The composite PMI for the EU, ended up at 56.4 from 56.7.
The dollar gained traction after the ADP survey showed that the private sector added 263K jobs in March, beating expectations of 187K, although February reading was downwardly revised to 245K, still way above average. The final services PMIs in the US also suffered downward revisions, with the Markit index at 52.8 and the ISM Non-manufacturing PMI down to 55.2. These lasts, were barely enough to halt dollar’s advance, albeit Wall Street kept rallying. FOMC Minutes released in the US afternoon, showed that the Fed favors a plan to start shrinking its balance sheet later this year, prompting the greenback initially higher across the board, although the movements were quickly reverted.
Market’s reaction indicates that speculative interest is eagerly waiting for a reason to buy the greenback, at least against the EUR. Despite the pair was unable to leave its tight weekly range, the risk remains towards the downside, given that in the 4 hours chart, the price was unable to settle above a bearish 20 SMA, whilst the RSI indicator resumed its decline, now heading south around 35. The momentum indicator, however, remains attached to its 100 level, lacking directional strength. The key support is 1.0620 as the pair needs to break it to be able to extend its decline down to 1.0565.
Support levels: 1.0620 1.0590 1.0565
Resistance levels: 1.0675 1.0710 1.0745
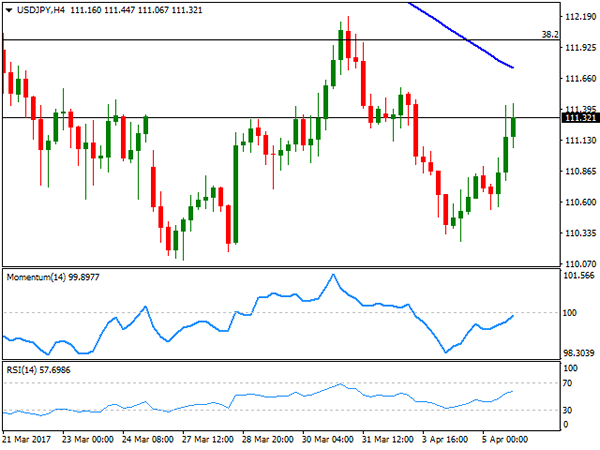
USD/JPY
The USD/JPY pair trimmed most of its weekly losses and settled near its daily high of 111.44, with the yen easing amid improving market’s mood. Asian shares advanced, following the lead of Wall Street, and following improved Japanese data as the Nikkei PMI surged to 52.9 in March its highest in almost two years. The manufacturing PMI also showed expansion in the month, printing 52.4, indicating firm demand for goods and services. The pair jumped to the mentioned high following the release of the US ADP survey, spending the rest of the day consolidating nearby. Nevertheless, and from a technical point of view, the upward potential remains limited according to technical readings in the 4 hours chart, as the intraday advance stalled well below a bearish 100 SMA, whilst the Momentum indicator was unable to recover above its 100 level, as the RSI indicator lost upward strength around neutral levels. The pair has an immediate resistance at 111.60, and a stronger one around 112.00, this last expected to cap advances on Thursday ahead of Friday’s NFP release.
Support levels: 110.95 110.50 110.10
Resistance levels: 111.60 112.00 112.50
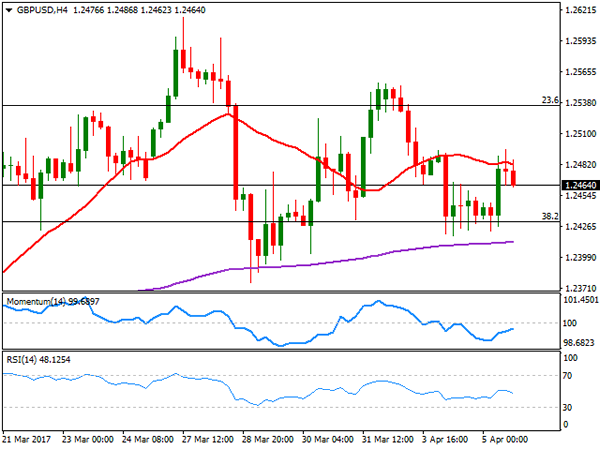
GBP/USD
The GBP/USD pair topped at 1.2496, with the Pound attracting intraday buying interest after the release of a better-than-expected services PMI for March, as the Markit index printed 55.0, up from 53.3 in February. The pair, however, was unable to regain the 1.2500 level, retreating from the mentioned high after the release of the US ADP report, to settle around 1.2460. The UK macroeconomic calendar has nothing to offer this Thursday, although things will get more interesting on Friday with fresh data including manufacturing and industrial production, the trade balance and the NIESR GDP estimate. From a technical point of view, the pair maintains a neutral-to-bearish bias, as in the 4 hours chart, the pair was unable to surpass a horizontal 20 SMA around 1.2490, while technical indicators hold within bearish territory, but with no clear directional strength. The same chart shows that the pair bottomed multiple times over the last few days in the 1.2420/30 region, confirming that a break below 1.2410 is required for a downward extension that can extend down to 1.2330.
Support levels: 1.2450 1.2410 1.2370
Resistance levels: 1.2490 1.2540 1.2585
GOLD
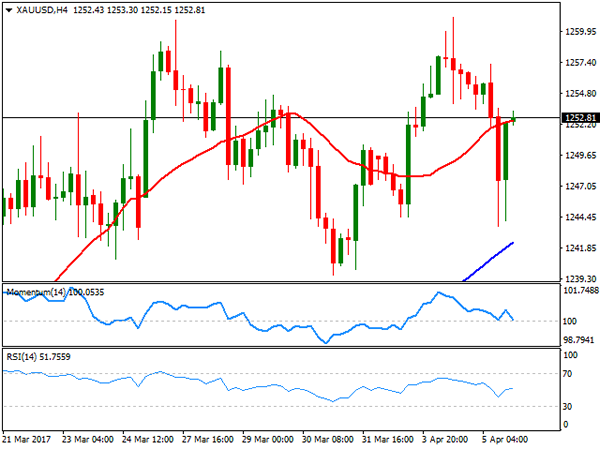
Gold prices traded in the red for most of the day, on improving risk sentiment following Wall Street’s Tuesday advance. Spot traded as low as $1,243.67 a troy ounce, but bounced back in the US afternoon and settled around 1,252.40, buoyed on bargain hunting after the commodity tested a major technical support. The bright metal gained, in spite of a stronger dollar, confirming that speculative interest is bullish on the metal. The daily chart, shows that the price bounced sharply after testing the 200 DMA, whilst a bullish 20 SMA stands right below the largest. Technical indicators in the mentioned time frame within positive territory, reflecting the inability of the commodity to break higher rather than suggesting downward exhaustion. In the 4 hours chart, the price settled a few cents above its 20 SMA, while the intraday decline stalled above a sharply bullish 20 SMA. In the same chart, technical indicators hold within positive territory, but with no clear directional strength, as the RSI lost upward strength around 53, whilst the Momentum indicator heads lower right above 100.
Support levels: 1,249.45 1.243.60 0 1,230.00
Resistance levels: 1,258.30 1,263.80 1,272.80
WTI CRUDE
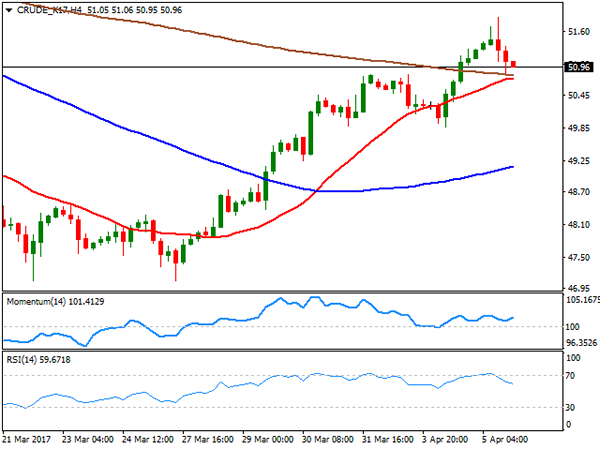
West Texas Intermediate crude oil futures rallied up to $51.86 a barrel backed by the American Petroleum Institute report released late Tuesday, that showed that crude inventories fell by 1.3 million barrels in the week ending March 31st. The commodity however, pulled back and settled around $50.96 a barrel, as the EIA weekly report showed an unexpected build of 1.6 million barrels, denting hopes of a balanced market. Daily basis, the index is midway between bullish 100 and 200 SMAs with the shortest capping the upside around 52.20, and with technical indicators having lost directional strength, but holding within positive territory. Shorter term, the 4 hours chart shows that the price pulled back to its 20 and 200 SMAs, both converging at 50.80, while the Momentum indicator is aiming to bounce from its 100 level and the RSI turned south around 58. The decline could accelerate on a break below 50.80, but it will take a slide below 49.90 to confirm further declines ahead.
Support levels: 50.80 50.30 49.90
Resistance levels: 51.65 52.20 52.90
DJIA
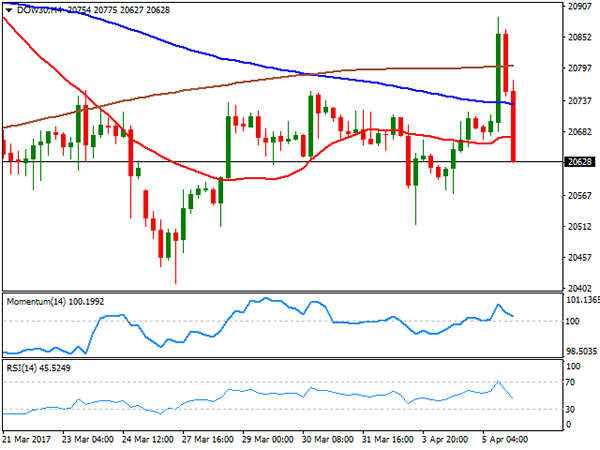
Wall Street opened with a strong tone, with the DJIA posting a three-digit gain before the release of FOMC Minutes. Indexes suffered a sharp reversal afterwards, as the minutes showed that most officials backed a policy change that would begin shrinking the central bank’s $4.5 trillion balance sheet later this year, seen by analyst as an option to rising rates. Furthermore, the document showed that some officials expressed their concerns about equity prices being "quite high." The Dow Jones Industrial Average shed 41 points, and settled at 20,648.15, while the Nasdaq Composite lost 0.58%, to 5,864.48. The S&P closed at 2,352.95, down by 7 points. Most members were down within the Dow, with Cisco Systems being the worst performer, down 1.17%, followed by JPMorgan Chase that shed 1.15%. The best performer was El du Pont that managed to gain 0.84%. The daily chart shows that the index failed to sustain gains beyond a bullish 20 DMA, ending the day below it, whilst technical indicators head lower within negative territory, aiming for fresh weekly lows. In the 4 hours chart, the index settled above all of its moving averages that anyway continue to lack directional strength, whist technical indicators turned sharply lower, with the RSI currently at 46, anticipating some additional declines ahead.
Support levels: 20,616 20,562 20,515
Resistance levels: 20,705 20,751 20,790
FTSE 100
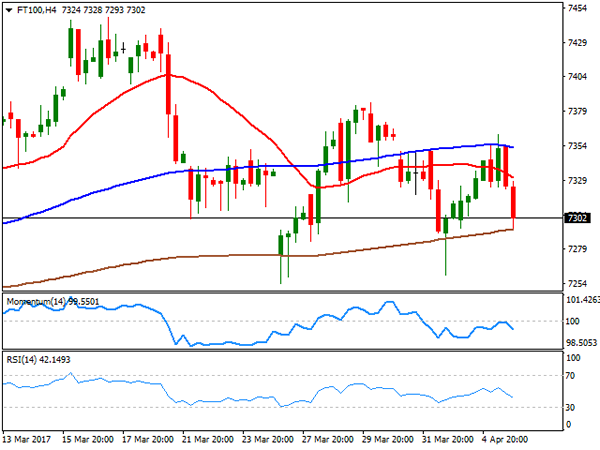
The FTSE 100 added roughly 10 points and settled at 7,331.68, lifted by an advance and mining and energy-related equities, as oil surged to a fresh 1-month high during the London session. The biggest gainer was Whitbread up 2.95%, while BHP Billiton added 1.75% and Antofagasta gained 1.55%. The biggest loser was insurer Old Mutual D down 4.38%, followed by Croda International that shed 3.6% after it received a downgrade from Credit Suisse. The index is currently trading a couple of points below 7,300, and the daily chart shows that an early advance was rejected by selling interest aligned around its 20 DMA , whilst technical indicators head further lower within negative territory, pointing for a continued decline. In the 4 hours chart, the index faltered around its 100 SMA, and now pressures the 200 SMA, whilst technical indicators retreated from their mid-lines, maintaining their bearish slopes into the Asian opening, in line with the longer term perspective.
Support levels: 7,294 7,254 7,210
Resistance levels: 7,349 7,387 7,415
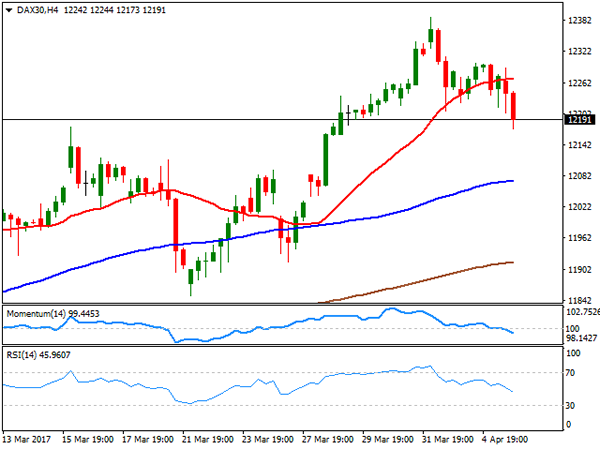
DAX
The German DAX closed the day at 12,217.54, down 64 points or 0.53%, with major European indexes ending the day mixed. The German benchmark was dragged lower by automakers, as the sector was the worst performer. Continental topped losers’ list down by 1.63%, followed by Daimler AG that shed 1.49%. Banks were the best performers after optimism returned, with Commerzbank adding 2.21% and Deutsche Bank ending the day 0.67% higher. The index fell further in after-hours trading, holding around 12,180 ahead of the Asian opening, as Wall Street suffered a sudden u-turn after in the last hour of trading on following the release of FOMC Minutes. The daily chart shows that the technical indicators gained downward momentum, still holding within positive territory, whilst a bullish 20 DMA offers a critical support at 12,094 now. In the 4 hours chart, the index broke below its 20 SMA for the first time in a week, with the moving average now horizontal, and technical indicators heading sharply lower within negative territory, supporting additional declines ahead.
Support levels: 12,137 12,096 12,052
Resistance levels: 12,206 12,245 12,290