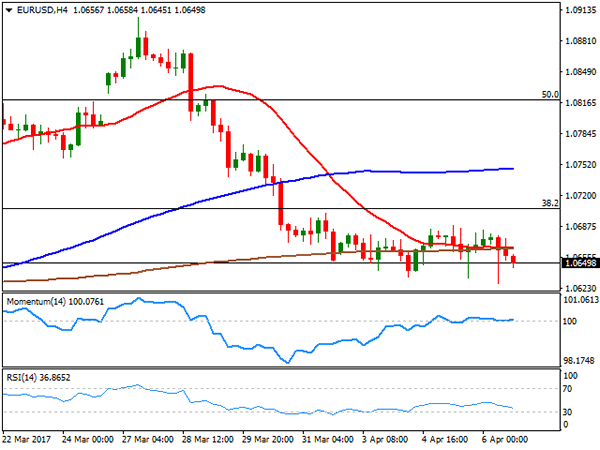
EUR/USD
The EUR/USD pair continued trading uneventfully for a fourth consecutive day, settling around 1.0650 this Thursday, where it spent all of the week. The common currency came under moderate pressure early Europe, extending its weekly slide by a few pips, to 1.0628, following a press conference offered by ECB’s Draghi, who dampened expectations of a tighter monetary policy, as he said, referring to policy makers, "we still need to build sufficient confidence that inflation will indeed converge to our aim over a medium-term horizon, and will remain there even in less supportive monetary policy conditions."
In the macroeconomic front, Germany released February factory orders, which rose by 3.4% in February, slightly below the 3.5% expected and better than a previously revised -6.8%. In the US, weekly unemployment claims for the week ending March 31st accounted 234K, better than the 250K expected, giving support to the greenback and Wall Street, ahead of the release of the US Nonfarm Payroll report this Friday. As usual lately, the market is heading into the report with high expectations, fueled by the ADP survey.
From a technical point of view, the pair maintains it’s the neutral-to-bearish stance, having traded within 60 pips ever since the week started. The 4 hours chart shows that the price settled below the 20 and 200 SMAs, both converging in the 1.0670 region, whilst the Momentum heads nowhere around its 100 level, and the RSI heading lower around 35. The immediate support comes at 1.0620, with a break below it on a strong Payroll exposing 1.0590 and 1.0565 later, whilst 1.0710 is the key resistance to surpass to see the common currency advancing further.
Support levels: 1.0620 1.0590 1.0565
Resistance levels: 1.0675 1.0710 1.0745
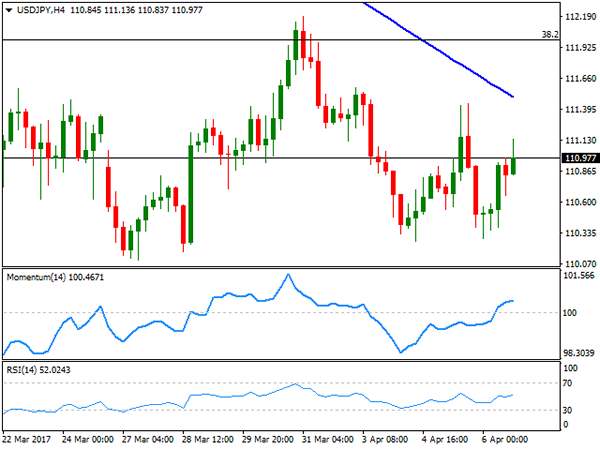
USD/JPY
The USD/JPY pair recovered the ground lost post-Fed, rallying up to a daily high of 111.13, to settle around the 111.00. Nevertheless, the yen remains strong heading into the US Nonfarm Payroll report, amid softer US Treasury yields and the poor performance of equities during the Asian and European sessions. Japanese consumer confidence released during the past Asian session surged to its highest since September 2013, printing 43.9 from previous 43.1, also beating expectations of 43.5, although the news failed to affect the yen. Much of the upcoming direction of the pair depends on the outcome of the US employment report, as the safe-haven currency tends to be the most sensitive to US data. From a technical perspective, the upward potential remains limited according to the 4 hours chart, as the price remains below a bearish 100 SMA, currently around 111.50, whilst indicators in the mentioned time frame barely stand in positive territory with limited upward strength. The pair has a major Fibonacci resistance at 112.00, the 38.2% retracement of the late 2016 monthly rally, with an extension above it favoring additional gains for the following sessions.
Support levels: 110.95 110.50 110.10
Resistance levels: 111.60 112.00 112.50
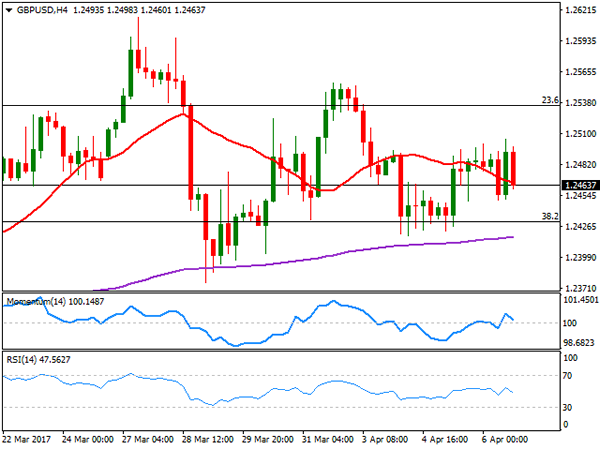
GBP/USD
The GBP/USD pair is marginally lower at the end of the day, still contained by selling interest around 1.2500. The pair peaked at 1.2505, but retreated to current 1.2460 region, having hovered around it for the last three days. There were no macroeconomic releases in the UK, but on Friday, the kingdom will release multiple fundamental readings, including manufacturing and industrial production, the goods trade balance, and the Halifax house prices index. Although none of them is considered first-tier data, the reports may offer a clear picture of the health of the local economy. Soft readings, now that the Brexit has been officially triggered, could weigh further in the Pound. The pair bottomed at 1.2450 this Thursday, now the immediate support, although a more relevant one comes at 1.2410, and only below this last the pair can gain bearish momentum. Technical readings in the 4 hours chart present a neutral-to-bearish stance, as the price is holding around a modestly bearish 20 SMA, whilst technical indicators have turned lower around their mid-lines, with not enough directional strength to suggest the next move.
Support levels: 1.2450 1.2410 1.2370
Resistance levels: 1.2490 1.2540 1.2585
GOLD
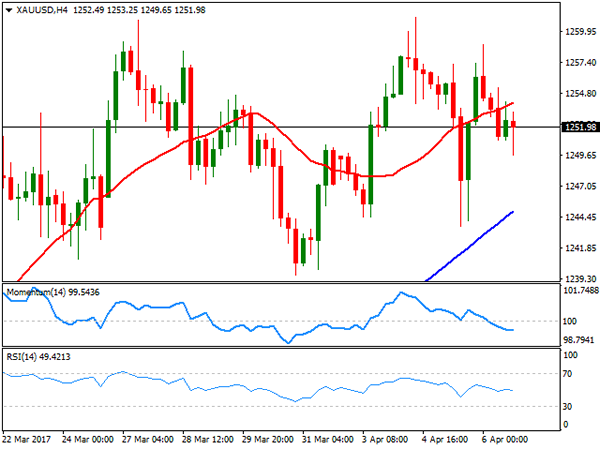
Spot gold closed the day marginally lower at $1,251.90 a troy ounce, as market’s mood improved during the past American session, with stocks and the greenback higher. Softer physical demand in Asia affected prices at the beginning of the day, although the intraday decline was limited, amid the absence of strong clues. The price holds near its recent highs, but technical readings in the daily chart indicate that the upward potential keeps fading, given that technical indicators have extended their declines within positive territory. Still the price is holding above its 20 and 200 SMAs, with the shortest crossing above the largest for the first time this year, both around 1,242.30 and providing a strong dynamic support. In the 4 hours chart, the price is below a bullish 20 SMA, whilst technical indicators are entering negative territory with limited bearish slopes, not enough to confirm a bearish extension, but clearly indicating diminishing buying interest.
Support levels: 1,249.45 1.242.30 0 1,230.00
Resistance levels: 1,258.30 1,263.80 1,272.80
WTI CRUDE
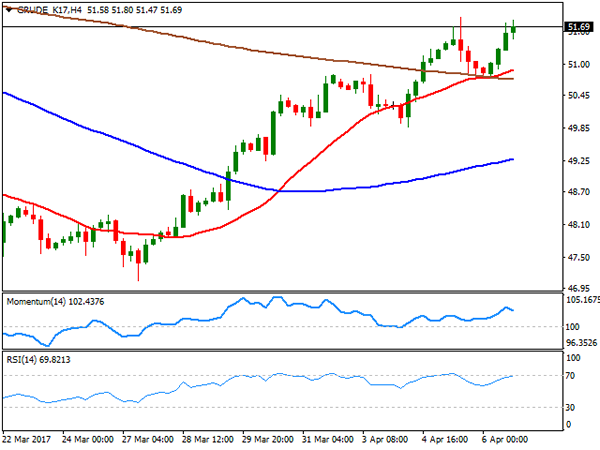
Crude oil prices resumed their advance this Wednesday, with West Texas Intermediate crude futures settling at $51.70 a barrel, not far from the near 1-month high reached this week at 51.88. There was no certain catalyst for the recovery, although expectations of strengthening demand in Asia and hopes the OPEC may extend its output cut deal, may have helped. Concerns over US increasing production, however, are still high and may affect the commodity in any sentiment swing. Technical readings in the daily chart indicate that futures may advance further, as technical indicators accelerated above their mid-lines now at fresh monthly highs, whilst the 20 DMA gained upward strength far below the current level. The 100 DMA still offers an intermediate resistance at 52.20. Shorter term, and according to the 4 hours chart, the price stands above all of its moving averages, with the 20 SMA extending above the largest ones and maintaining it bullish slope, whilst technical indicators have pared their advance near overbought readings, but are far from changing course, overall favoring a new leg higher on an advance beyond the mentioned 52.20.
Support levels: 51.30 50.80 50.30
Resistance levels: 52.20 52.90 53.60
DJIA
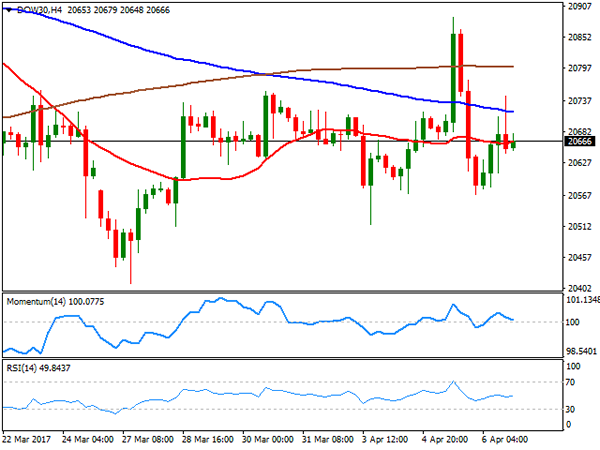
US indexes managed to post some modest daily gains this Thursday, with the Dow Jones Industrial Average adding 14 points to 20,662.95, while the S&P added 0.19%, to 2,357.49. The Nasdaq Composite gained 14 points and closed at 5,878.95. Stocks were on pause, ahead of the US Nonfarm Payroll report, and with President Trump going into a two-day meeting with his Chinese counterpart, Xi Jinping. Retailers led the advance, but within the DJIA, Caterpillar was the best performer, adding 1.62%, and followed by Exxon Mobil that gained 0.60%. Procter & Gamble led decliners, shedding 0.66%. The daily chart for the Dow shows that, once again, the index met selling interest on an advance towards a modestly bearish 20 DMA, currently at 20,720, although technical indicators have turned modestly higher, still holding within neutral territory and lacking enough strength to confirm a new leg higher. In the shorter term, and according to the 4 hours chart, the index maintains a neutral stance, standing below the 100 and 200 SMAs, but stuck around a horizontal 20 SMA, and with technical indicators heading nowhere around their mid-lines. The index will likely respond to the release of the US Nonfarm Payroll report better than the greenback, as a positive number will likely build confidence among stocks’ traders.
Support levels: 20,616 20,562 20,515
Resistance levels: 20,720 20,754 20,790
FTSE 100
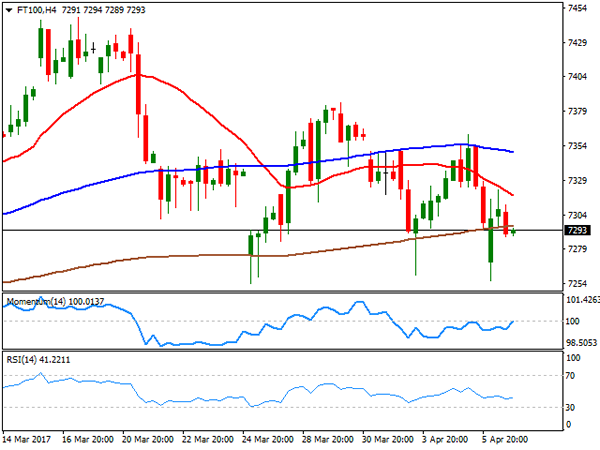
The FTSE 100 lost 28 points or 0.39%, and closed at 7,303.20, as FOMC Minutes dented market’s sentiment, by indicating their will to shrink the balance sheet later this year. Risk aversion dominated the first half of the day, with the banking sector suffering the most across the region. Within the Footsie, EasyJet was the best performer, adding 4.23%, followed by British Land that gained 2.25% and Persimmon, up 2.14%. Shire led declines, shedding 1.91%, while Pearson lost 1.77% after going ex-dividend. The daily chart for the index shows that the risk remains towards the downside as its settled a lower low and a lower high daily basis, remaining below its 20 DMA and with indicators heading marginally lower within negative territory. In the 4 hours chart, the index is a few points below its 200 SMA, whilst a bearish 20 SMA capped the upside at the beginning of the day, and technical indicators hold below their mid-lines, with no directional strength.
Support levels: 7,254 7,210 7,173
Resistance levels: 7,349 7,387 7,415
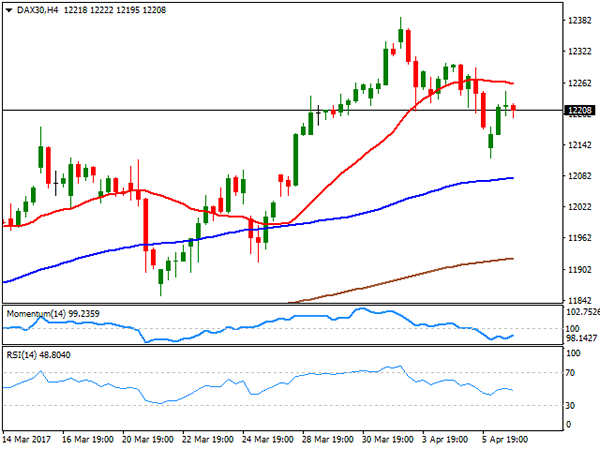
DAX
European major indexes closed mixed, as a dovish Draghi added to an already sour sentiment. The German DAX, however, managed to advance 13 points, to 12,230.89, despite ECB’s head indicated that it’s too early to consider tightening the monetary policy. Utilities and real estate stocks led the way higher in the region, and within the DAX, RWE AG was the best performer, ending 1.56% higher followed by Adidas that gained 1.14%. Commerzbank led decliners, shedding 0.84%, followed by Heidelberg Cement that closed 0.40% lower. The index posted a lower low for a fourth consecutive session, but bounced sharply from a bullish 20 DMA, whilst technical indicators also managed to recover from their mid-lines, limiting the downside. In the 4 hours chart, the index settled below a horizontal 20 SMA, whilst technical indicators present a soft tone within negative territory, indicating that in the short term, the benchmark may fall further. A recovery above 12,245, the daily high, would on the contrary favor a recovery, particularly if market’s sentiment improves during the upcoming sessions.
Support levels: 12,195 12,137 12,096
Resistance levels: 12,245 12,290 12,341