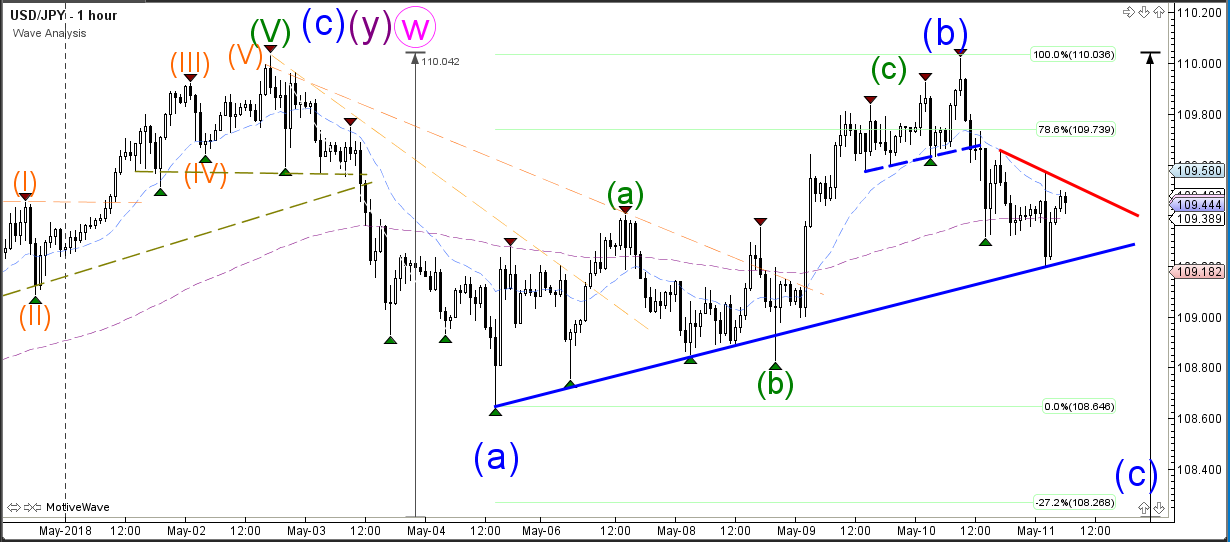
The USD/JPY uptrend failed to break above the resistance and previous top at 110, which could indicate a potential double bottom reversal chart pattern. The bearish bounce could confirm a larger ABC (blue) correction if price manages to break below the support trend line (blue). In that case price could move towards that Fib targets of wave X (pink). A bullish break however above the previous high could still indicate a continuation of the uptrend.
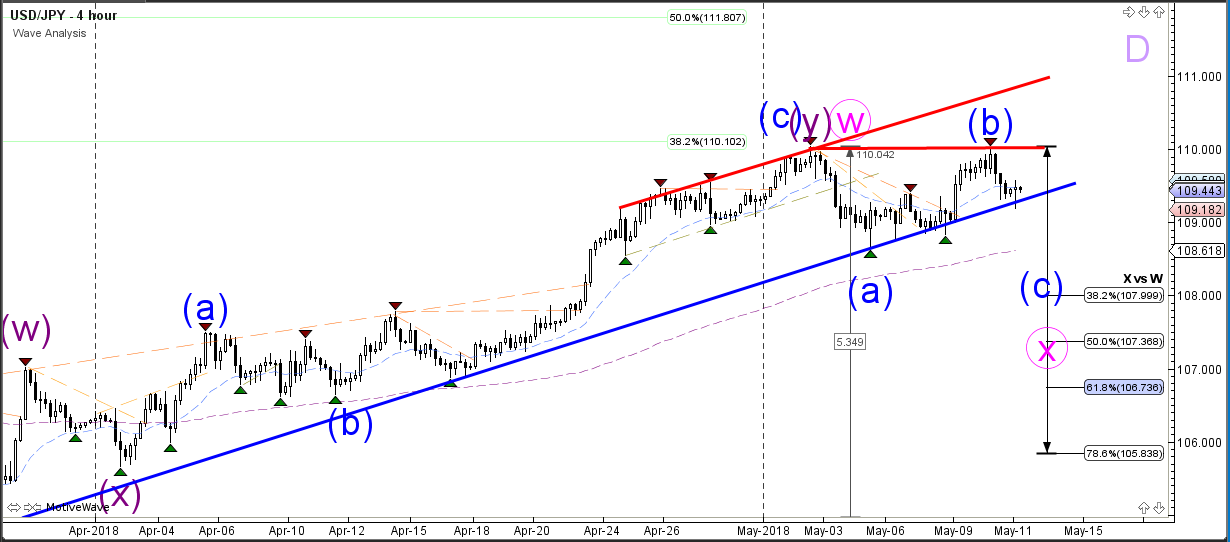
The USD/JPY chart looks corrective and choppy. A breakout below the resistance (red) or support (blue) trend line is needed before a larger impulsive price action can start.