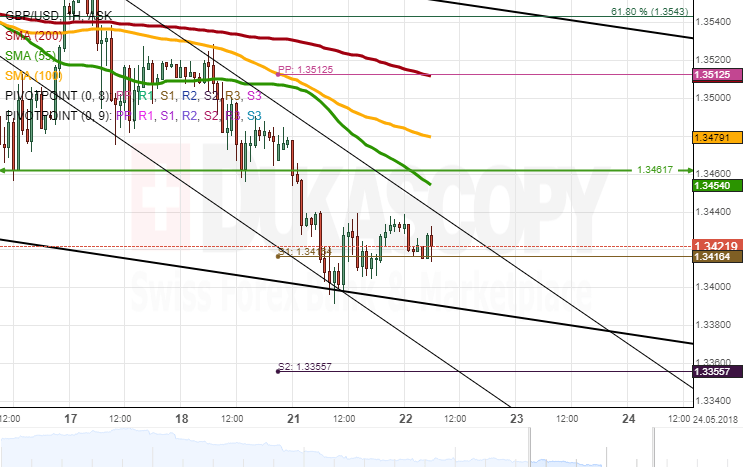
After breaching the previous 2018 low and a strong support level, GBP/USD remained under bearish pressure until the psychological 1.34 level and the bottom channel line were reached. The pair’s subsequent movement was sideways in a very narrow range.
Technical indicators are starting to recover which might point to appreciation in this session. However, the pair faces the combined resistance of the 55– and 100-hour SMA at 1.3460—the level which might not surrender unless strong bullish sentiment pushes the pair higher. This upside momentum might be provided by UK Inflation Report Hearings at 0900GMT.
In this case, the next target is the weekly PP and the 200-hour SMA at 1.3520. Conversely, a breakout of 1.34 should send the pair for the weekly S2 at 1.3360.